Market this Week
Analysis , Blogs , Financial , Information , Weekly
“After a bullish candle- a pause on weekly chart is observed. Overall weekly price action is still bullish, despite a correction las week”…[..}
Last Expiry – Overview
NIFTY 50
Nifty was very volatile on the last trading session and it remained rangebound. And buying observed from bottom.
BANK NIFTY
Banknifty traded very positively and buying seen at the bottom with good volumes.
Technically, Market this Week.
NIFTY 50
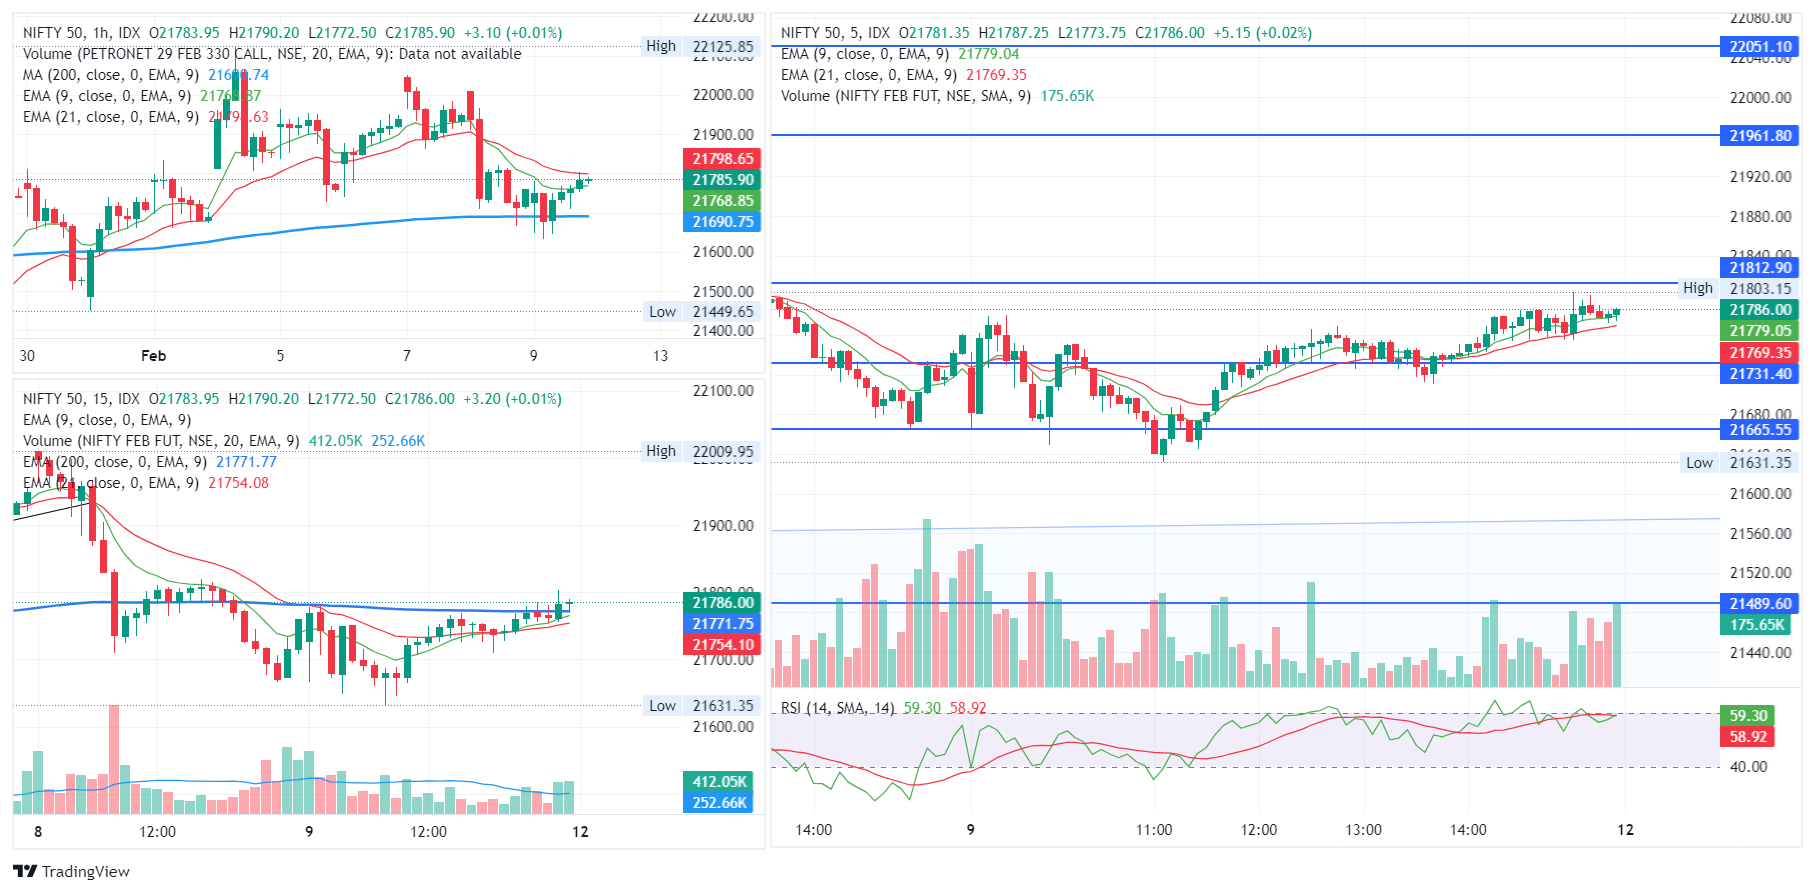
View :
After a bullish candle- a pause on weekly chart is observed. Overall weekly price action is still bullish, despite a correction last week.
Not a clear bullish harami but looks like one, it looks market is unable to to sustain at the top.
Important Levels
- Resistance – 21,900 – 22,000
- Support – 21,650 – 21,750
- No trading Zone – 21,650 – 21,750
BANKNIFTY
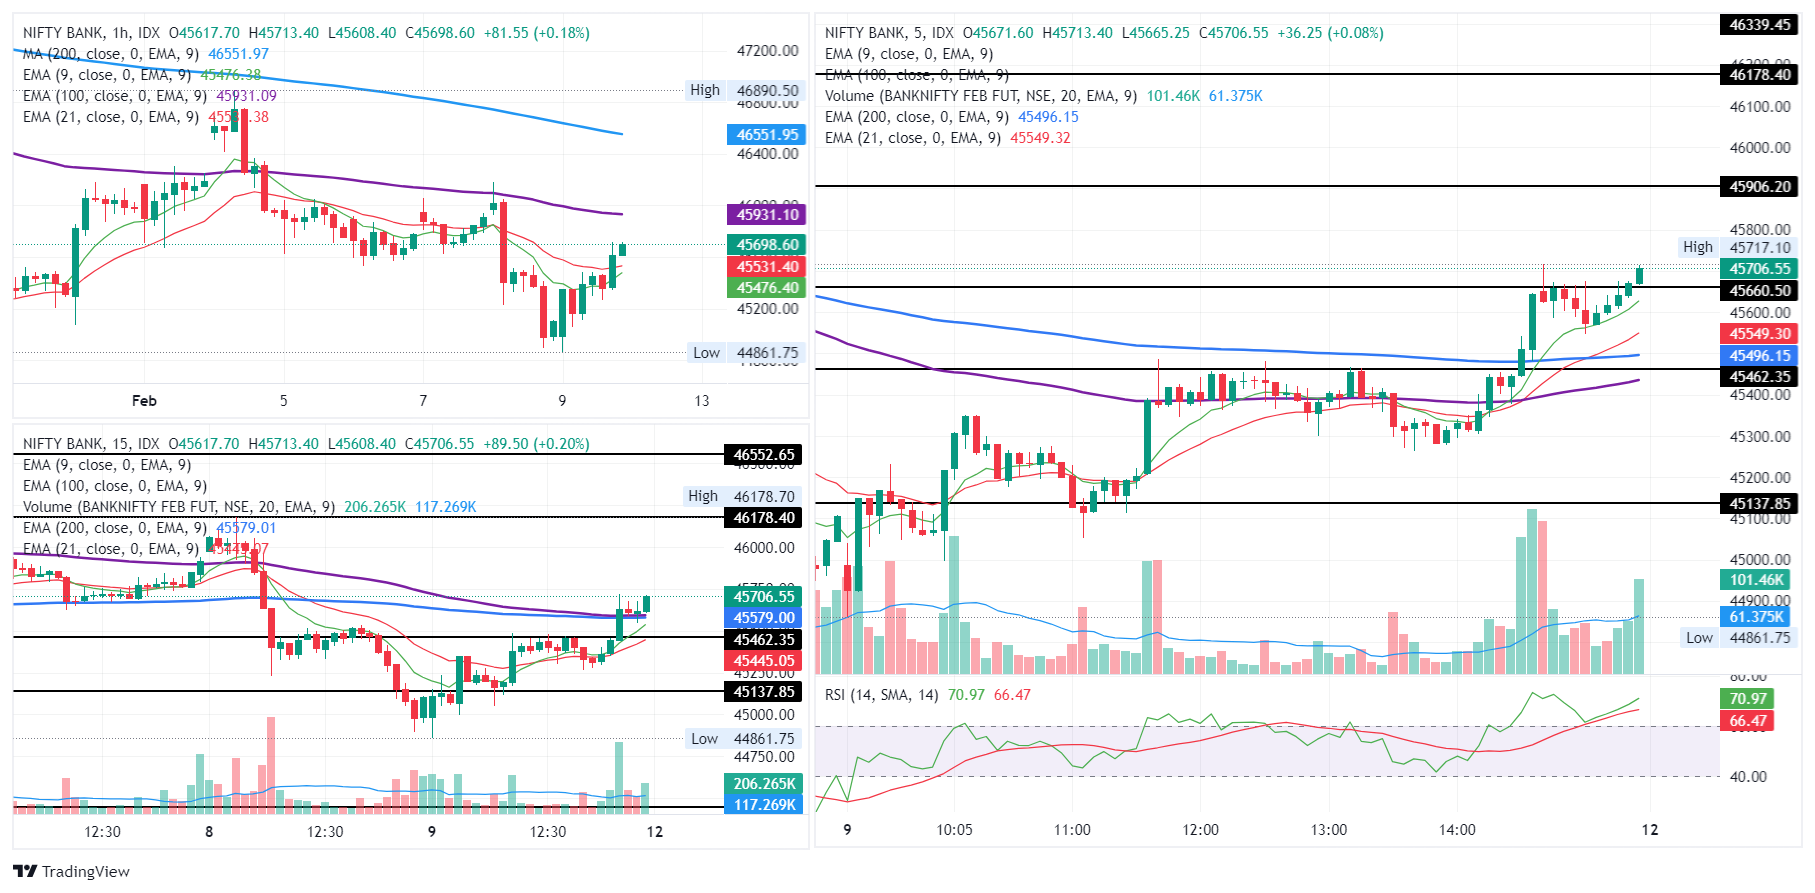
View :
Post the formation of a bullish harami in the weekly chart, a bearish candle with a long wick at the bottom is formed, this suggests a buying at the lower levels.
On daily time frame, after a back to back negative candles in the last session a strong bullish marubuzo is formed with a good volume.
Important Levels
- Resistance – 45,900 – 46,000
- Support – 44,400 – 44,500
- No trading – 44,400 – 44,500
Please follow the link to see the detail chart analysis.
What does data say about the market this week?
FII & DII Activity
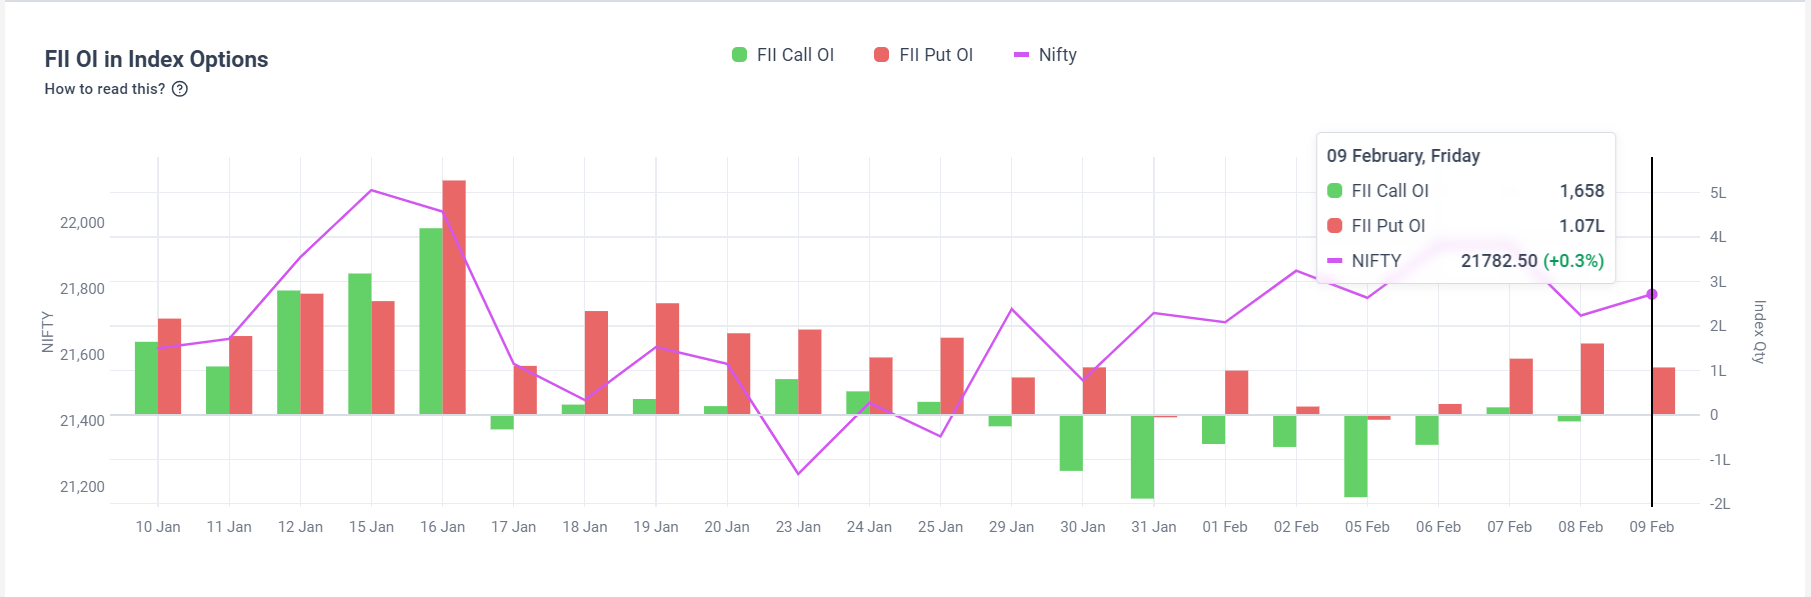
Observations:
FII & DII data suggest market to trade in flat to Bullish:
- Outstanding puts is 51K bought along with 15K calls – Looks Bullish.
- Last session FII, PRO, Clients & DII activity – Bullish inclined as FII, Pro & DII But Clients are Bearish.
- FII stocks is 142Cr bought – Does not hold relevance for intraday.
- Net Future OI change = have dip to -83K , Improved.
Open Interest (OI)-
OI data suggest market to remain volatile, No Clear Horizon is visible.
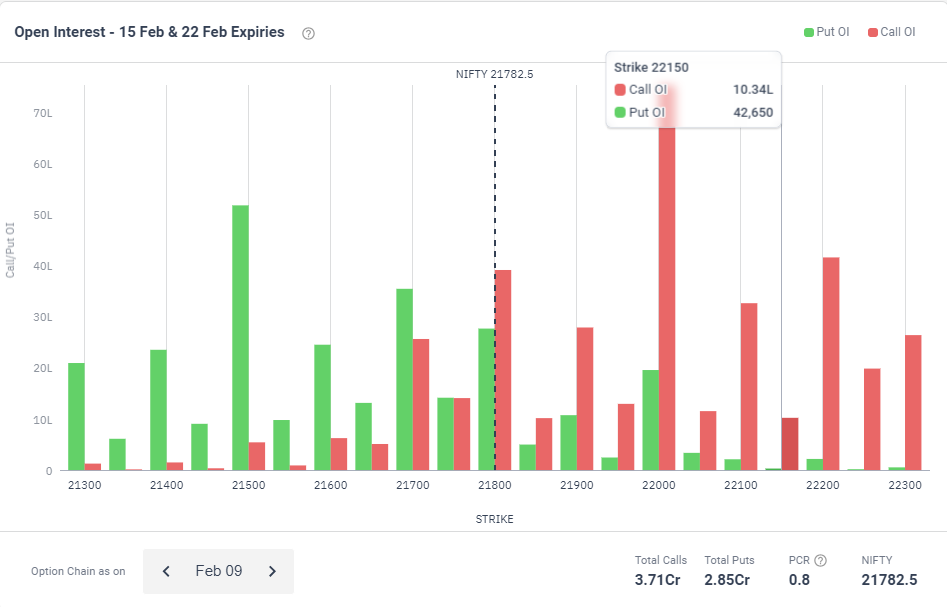
Nifty OI
- Max OI Calls:: 22000 , 0.75 Cr
- Max OI Puts:: 21500, 0.52 Cr
- PCR:: 0.8
Note:: OI suggests a support at 21500 , and a Resistance at 22000. Likely to remain volatile and range bound.
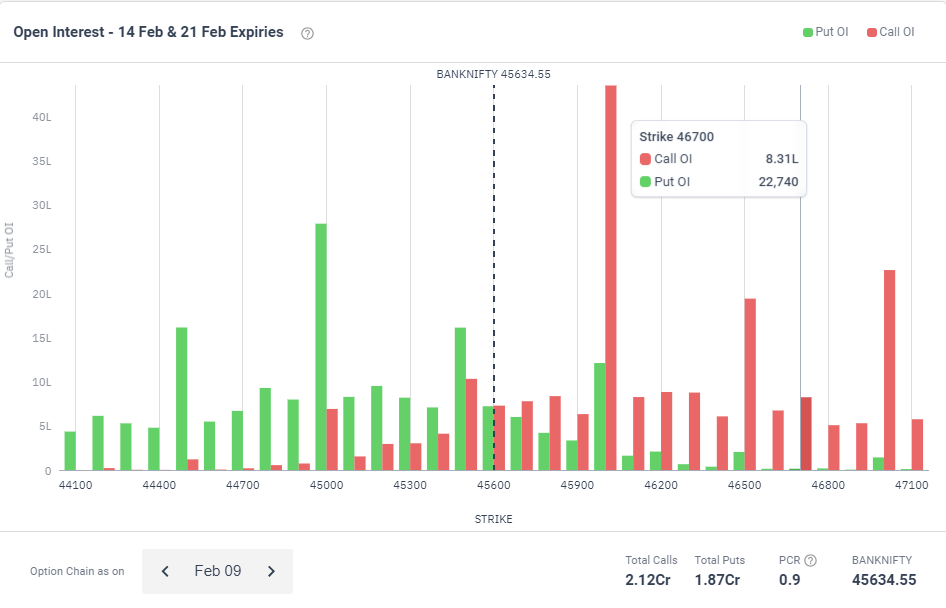
Banknifty OI
- Max OI Calls:: 46000 , 0.44 Cr
- Max OI Puts:: 45000, 0.28 Cr
- PCR:: 0.9
Note:: OI suggests a support at 45000 , and Resistance at 46000. Likely to remain volatile and range bound.
Please follow the link to see the detail chart analysis.
Data for 12th February, 2024 Week.
Market Sentiments
World Markets – World market traded mostly flat to bullish.
GIFT NIFTY FUTURES – Closed around 21,850 at 01:15am 11-02-2024.
Events Upcoming
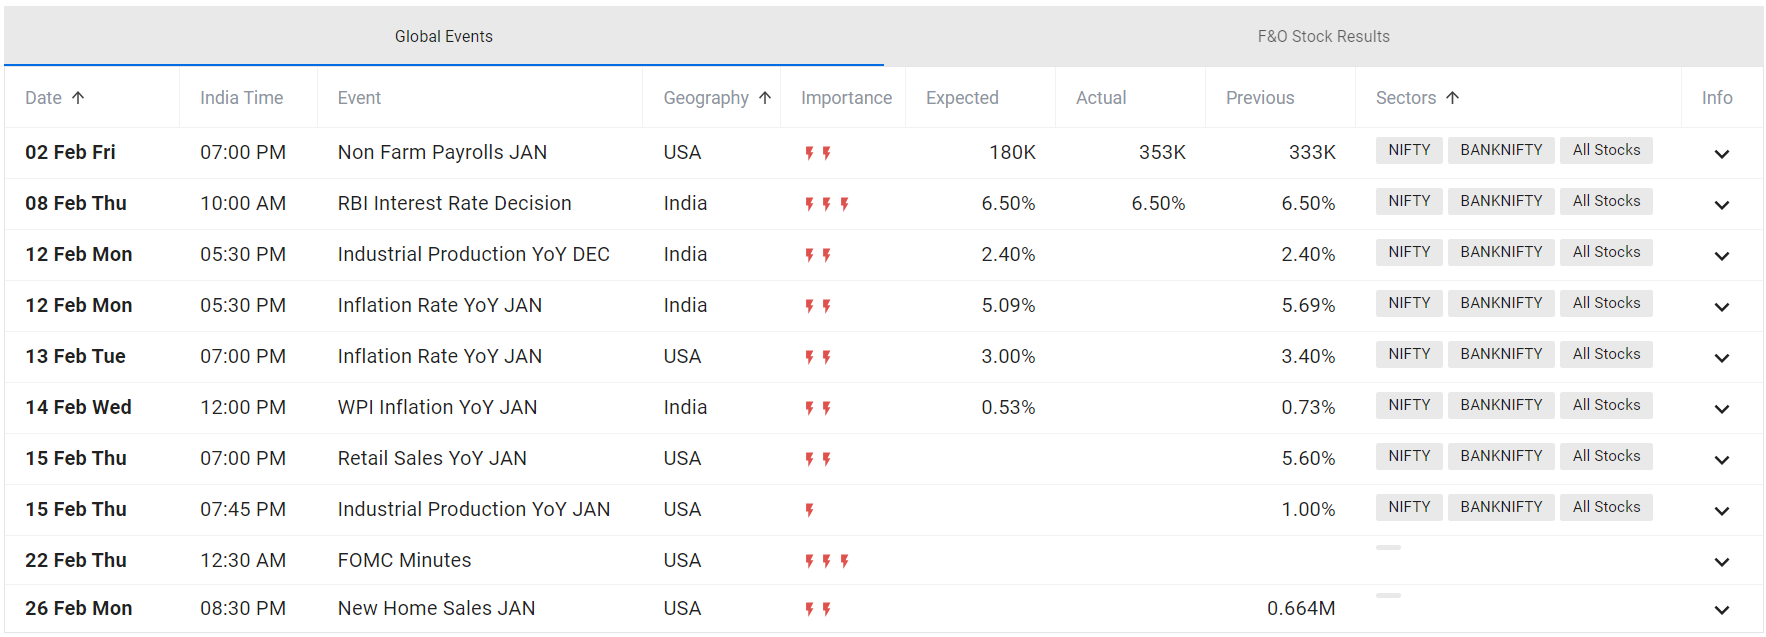
Fig. Events this week
Disclaimer:-The above analysis is solely the opinion of the author, no way an assured tips/direction to trade, they are solely for educational purposes. Please do not trade with out a proper study and analysis, we will not be responsible for your loss. We are not SEBI registered.
#SafeBull, #pixarts.Trade