Chart analysis for the week, 12th February 2024
Charts , Market , Weekly
NIFTY 50
View :
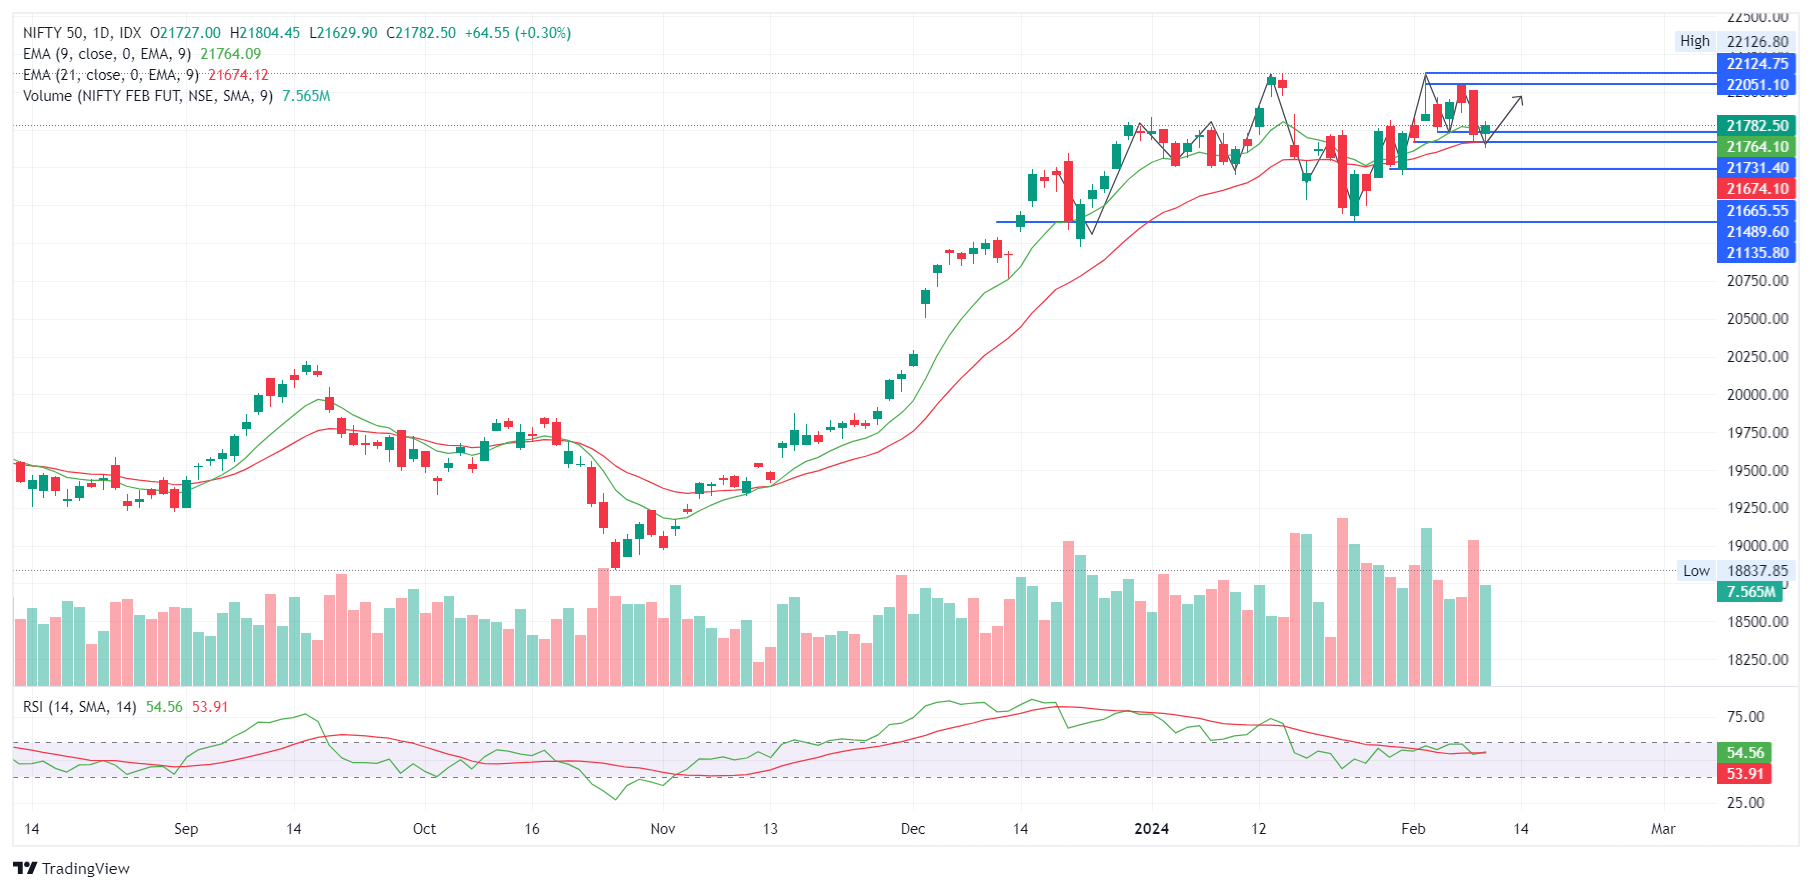
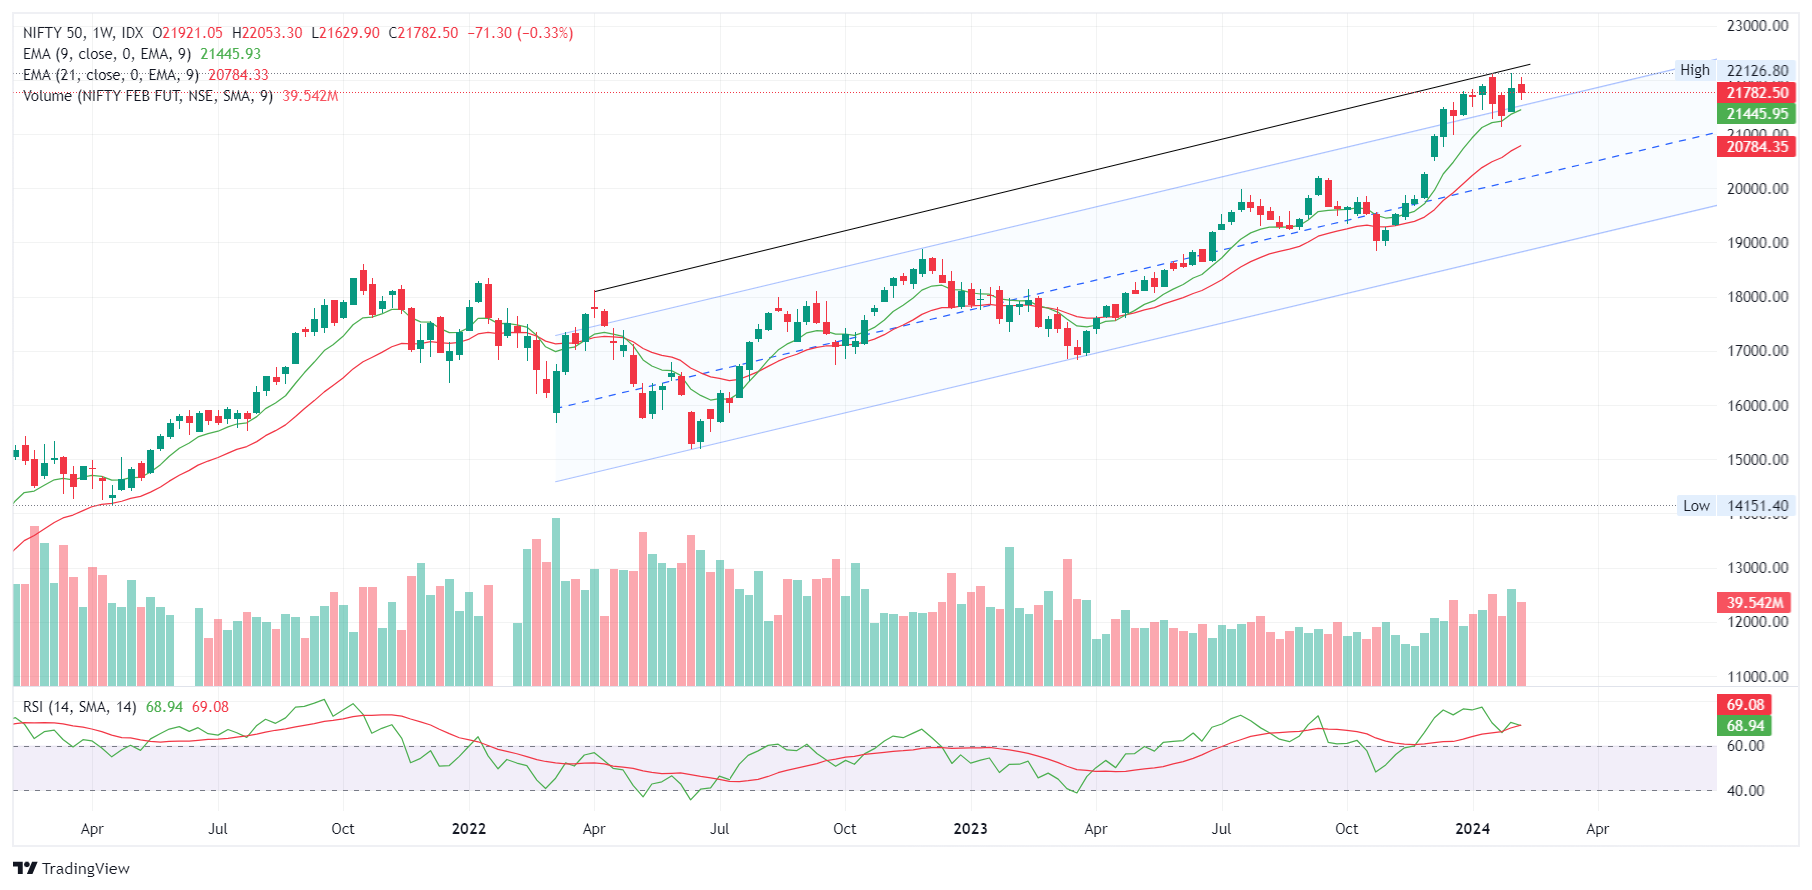
After a bullish candle- a pause on weekly chart is observed. Overall weekly price action is still bullish, despite a correction las week.
Not a clear bullish harami but looks like one, it looks market is unable to to sustain at the top.
Important Levels
- Resistance – 21,900 – 22,000
- Support – 21,650 – 21,750
- No trading Zone – 21,650 – 21,750
BANKNIFTY
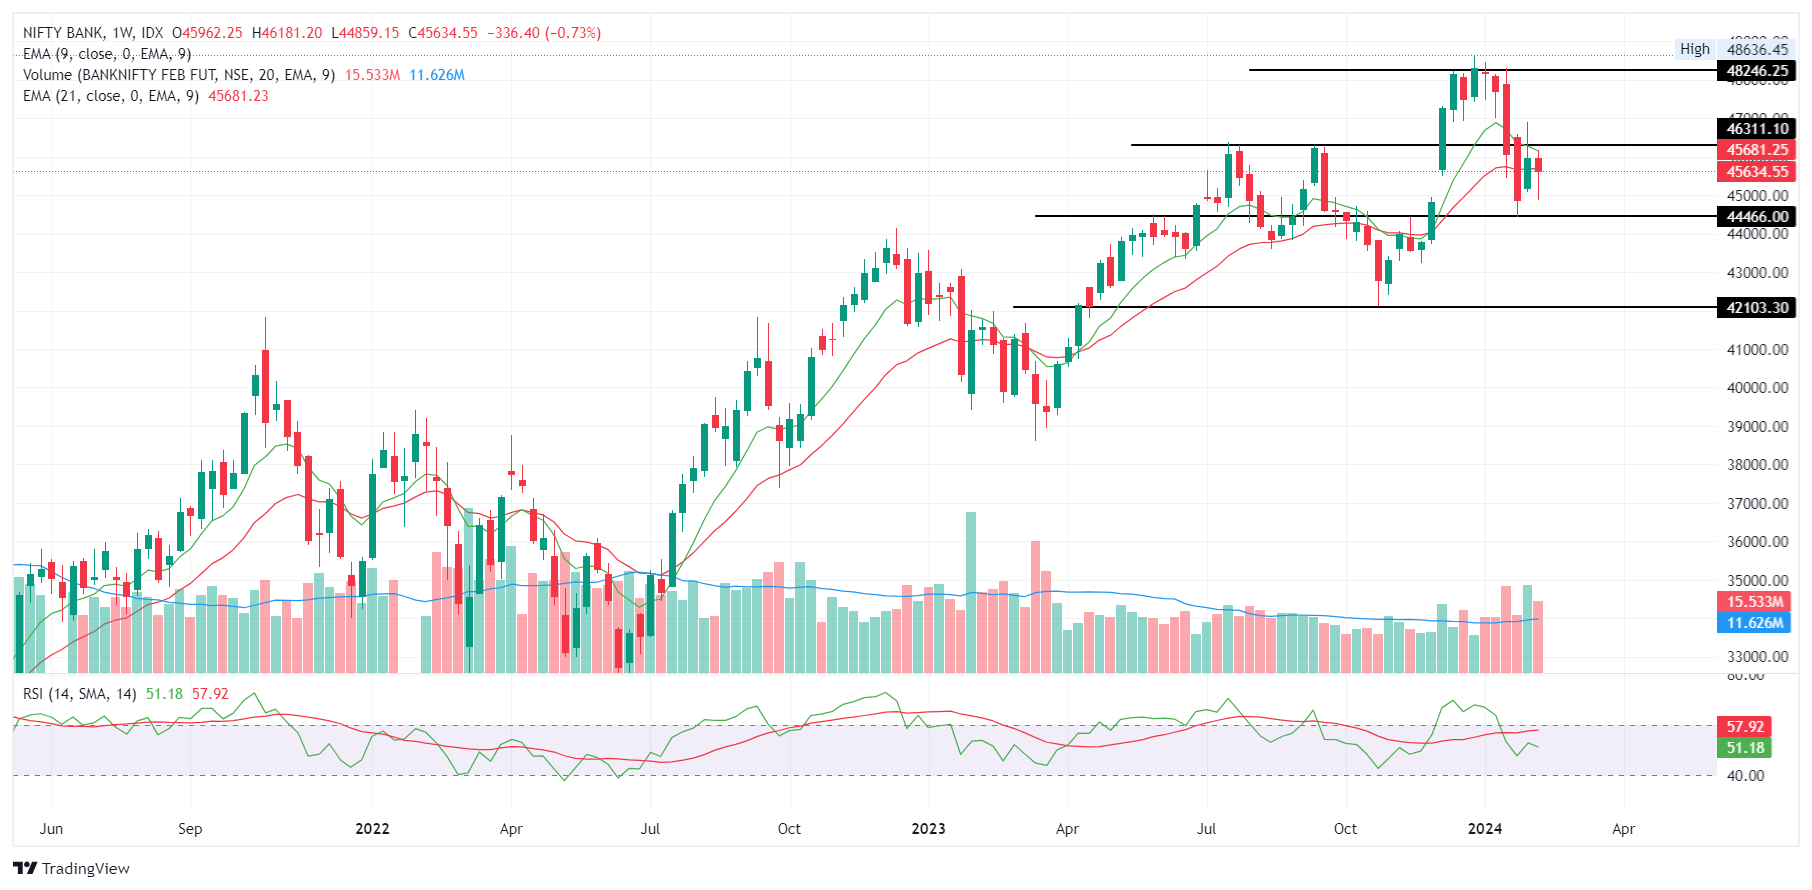
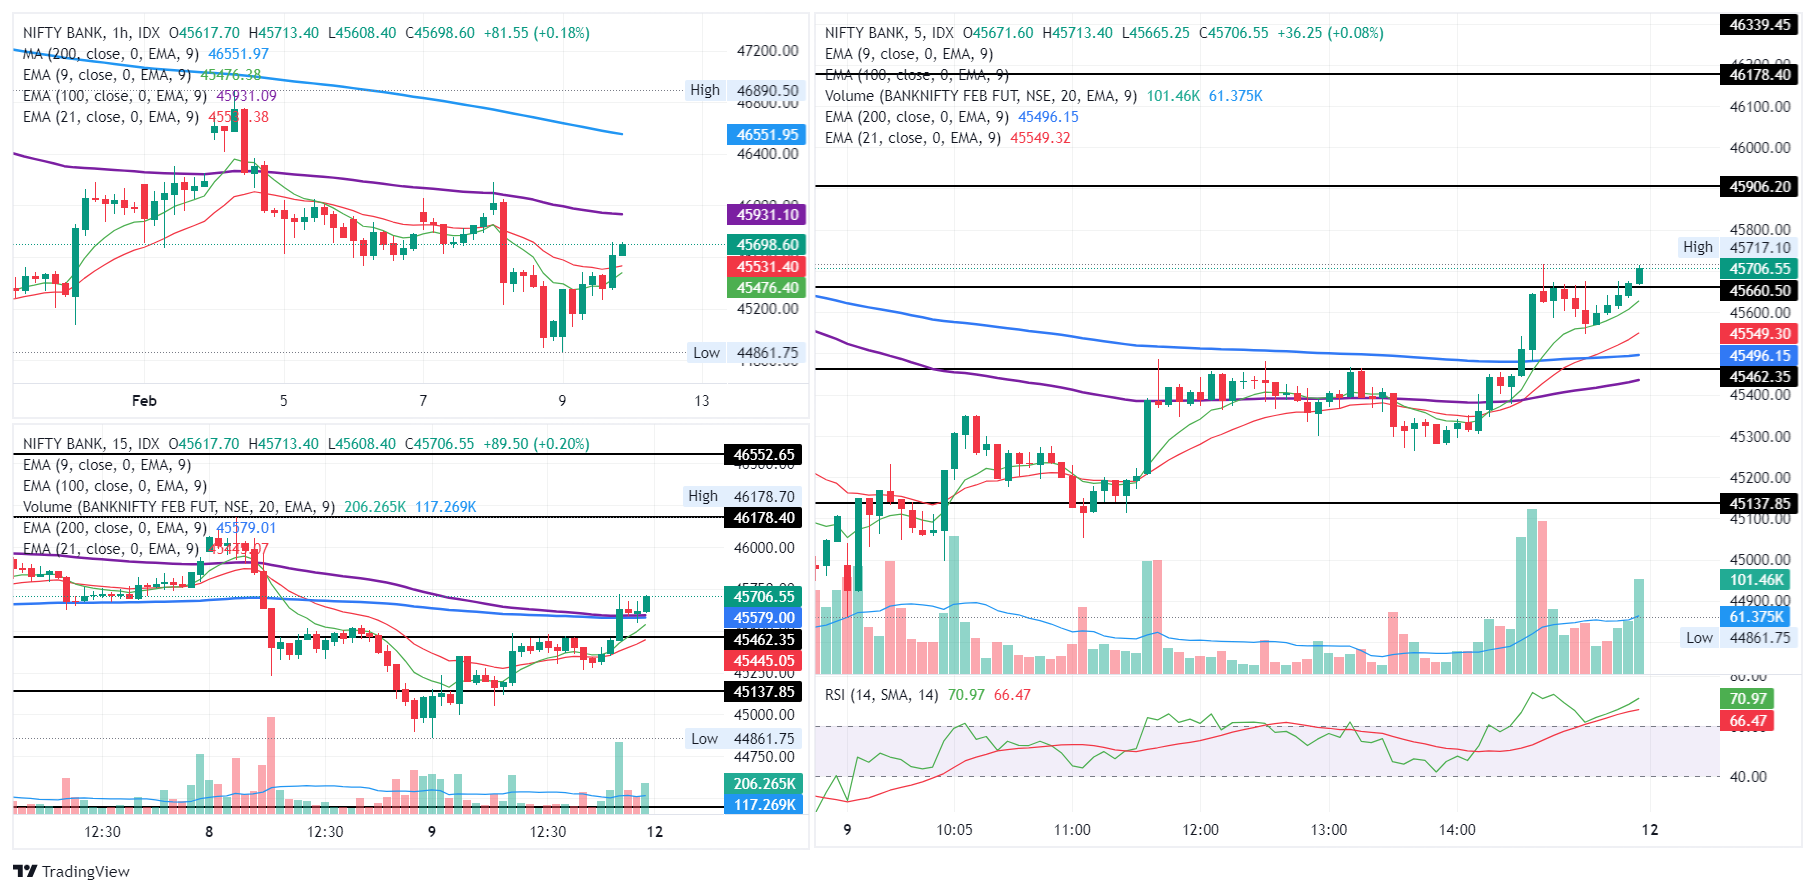
View :
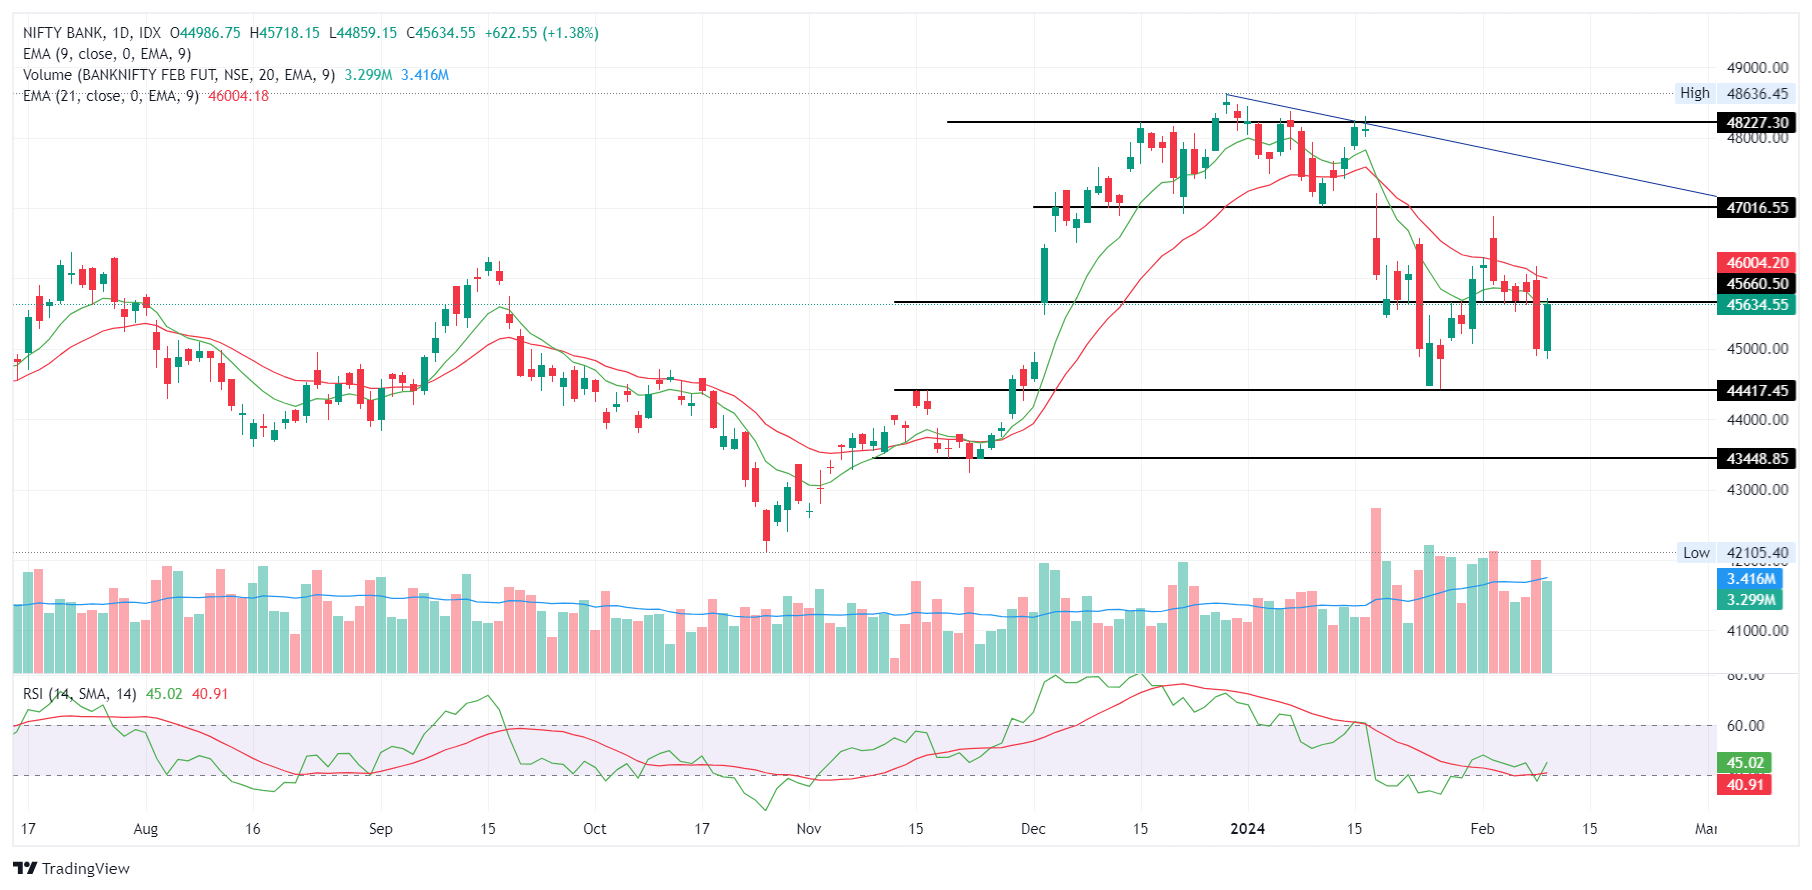
Post the formation of a bullish harami in the weekly chart, a bearish candle with a long wick at the bottom is formed, this suggests a buying at the lower levels.
On daily time frame, after a back to back negative candles in the last session a strong bullish marubuzo is formed with a good volume.
Important Levels
- Resistance – 45,900 – 46,000
- Support – 44,400 – 44,500
- No trading – 44,400 – 44,500