The Dow Theory
Blogs , Information , Learning
“Dow Theory was used in the western world even before candlesticks were formally introduced”….[..]
Published by: ZERODHA VARSITY , For more lessons like this please visit: https://zerodha.com/varsity/
:: The Dow Theory has always been a very integral part of technical analysis. The Dow Theory was used extensively even before the western world discovered candlesticks. In fact, even today, Dow Theory concepts are being used. In fact, traders blend the best practices from Candlesticks and Dow Theory.
The Dow Theory was introduced to the world by Charles H. Dow, who also founded the Dow-Jones financial news service (Wall Street Journal). During his time, he wrote a series of articles starting from the 1900s which in the later years was referred to as ‘The Dow Theory’. Much credit goes to William P Hamilton, who compiled these articles with relevant examples over a period of 27 years. Much has changed since the time of Charles Dow, and hence there are supporters and critics of the Dow Theory.
The Dow Theory Principles
The Dow Theory is built on a few beliefs. These are called the Dow Theory tenets. Charles H Dow developed these tenets over the years of his observation on the markets. 9 tenets are considered as the guiding force behind the Dow Theory. They are as follows:
| Sl No | Tenet | What does it mean? |
|---|---|---|
| 01 | Indices discounts everything | The stock market indices discount everything which is known & unknown in the public domain. If a sudden and unexpected event occurs, the stock market indices quickly recalibrate itself to reflect the accurate value |
| 02 | Overall there are 3 broad market trends. | Primary Trend, Secondary Trend, and Minor Trends |
| 03 | The Primary Trend | This is the major trend of the market that lasts from a year to several years. It indicates the broader multiyear direction of the market. While the long term investor is interested in the primary trend, an active trader is interested in all trends. The primary trend could be a primary uptrend or a primary downtrend |
| 04 | The Secondary Trend | These are corrections to the primary trend. Think of this as a minor counter-reaction to the larger movement in the market. Example – corrections in the bull market, rallies & recoveries in the bear market. The counter-trend can last anywhere between a few weeks to several months |
| 05 | Minor Trends/Daily fluctuations | These are daily fluctuations in the market; some traders prefer to call them market noise |
| 06 | All Indices must confirm with each other. | We cannot confirm a trend based on just one index. For example, the market is bullish only if CNX Nifty, CNX Nifty Midcap, CNX Nifty Smallcap etc. all move in the same upward direction. It would not be possible to classify markets as bullish, just by the action of CNX Nifty alone |
| 07 | Volumes must confirm | The volumes must confirm along with the price. The trend should be supported by volume. The volume must increase as the price rises and should reduce as the price falls in an uptrend. In a downtrend, the volume must increase when the price falls and decrease when the price rises. You could refer chapter 12 for more details on volume |
| 08 | Sideway markets can substitute secondary markets. | Markets may remain sideways (trading between a range) for an extended period. Example:- Reliance Industries between 2010 and 2013 was trading between 860 and 990. The sideways markets can be a substitute for a secondary trend |
| 09 | The closing price is the most sacred. | Between the open, high, low and close prices, the close is the most important price level as it represents the final evaluation of the stock during the day. |
The different phases of Market
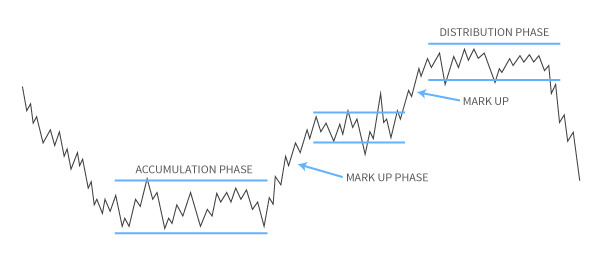
Dow Theory suggests the markets are made up of three distinct phases, which are self-repeating. These are called the Accumulation phase, the Markup phase, and the Distribution phase.
The Accumulation phase usually occurs right after a steep sell-off in the market. The steep sell-off in the markets would have frustrated many market participants, losing hope of any uptrend in prices. The stock prices would have plummeted to rock bottom valuations, but the buyers would still be hesitant to buy fearing another sell-off. Hence the stock price languishes at low levels. This is when the ‘Smart Money’ enters the market.
Smart money is usually the institutional investors who invest in a long term perspective. They invariably seek value investments which are available after a steep sell-off. Institutional investors start to acquire shares regularly, in large quantities over an extended period of time. This is what makes up an accumulation phase. This also means that the sellers trying to sell during the accumulation phase will easily find buyers, and therefore the prices do not decline further. Hence invariably, the accumulation phase marks the bottom of the markets. More often than not, this is how the support levels are created. Accumulation phase can last up to several months.
Once the institutional investors (smart money) absorb all the available stocks, short term traders since the support. This usually coincides with the improved business sentiment. These factors tend to take the stock price higher. This is called the markup phase. During the Markup phase, the stock price rallies quickly and sharply. The most important feature of the markup phase is speed. Because the rally is quick, the public at large is left out of the rally. New investors are mesmerized by the return, and everyone from the analysts to the public sees higher levels ahead.
Finally, when the stock price reaches new highs (52 weeks high, all-time high), everyone around would be talking about the stock market. The news reports turn optimistic, business environment suddenly appears vibrant, and everyone (public) wants to invest in the markets. By and large, the public wants to get involved in the markets as there is a positive sentiment. This is when the distribution phase occurs.
The judicious investors (smart investors) who got in early (during the accumulation phase) will start offloading their shares slowly. The public will absorb all the volumes offloaded by the institutional investors (smart money) there by giving them the well-needed price support. The distribution phase has similar price properties as that of the accumulation phase. Whenever the prices attempt to go higher in the distribution phase, the smart money offloads their holdings. Over a period of time, this action repeats several times, and thus the resistance level is created.
Finally, when the institutional investors (smart money) completely sell off their holdings, there would no further support for prices. Hence, what follows after the distribution phase is a complete sell-off in the markets, also known as the mark down of prices. The selloff in the market leaves the public in an utter state of frustration.
Completing the circle, what follows the selloff phase is a fresh round of accumulation phase, and the whole cycle repeats. It is believed that that entire cycle from the accumulation phase to the selloff spans over a few years.
It is important to note that no two market cycles are the same. For example, in the Indian context, the bull market of 2006 – 07 is way different from the bull market of 2013-14. Sometimes the market moves from the accumulation to the distribution phase over a prolonged multi-year period. On the other hand, the same move from the accumulation to the distribution can happen over a few months. The market participant needs to tune himself to evaluating markets in the context of different phases, as this sets a stage for developing a view on the market.
The Dow Patterns
Like in candlesticks, there are few important patterns in Dow Theory as well. The trader can use these patterns to identify trading opportunities. Some of the patterns that we will study are:
- The Double bottom & Double top formation
- The Triple Bottom & Triple Top
- Range formation, and
- Flag formation
The support and resistance is also a core concept for the Dow Theory, but we have discussed it much earlier a chapter dedicated to it because of its importance (in terms of placing targets and stop-loss).
The Double bottom and top formation
A double top & double bottom is considered a reversal pattern. A double bottom occurs when a stock’s price hits a shallow price level and rebounds back with a quick recovery. Following the price recovery, the stock trades at a higher level (relative to the low price) for at least 2 weeks (well spaced in time). After which the stock attempts to hit back to the low price previously made. If the stock holds up once again and rebounds, then a double bottom is formed.
A double bottom formation is considered bullish, and hence one should look at buying opportunities. Here is a chart that shows a double bottom formation in Cipla Limited:
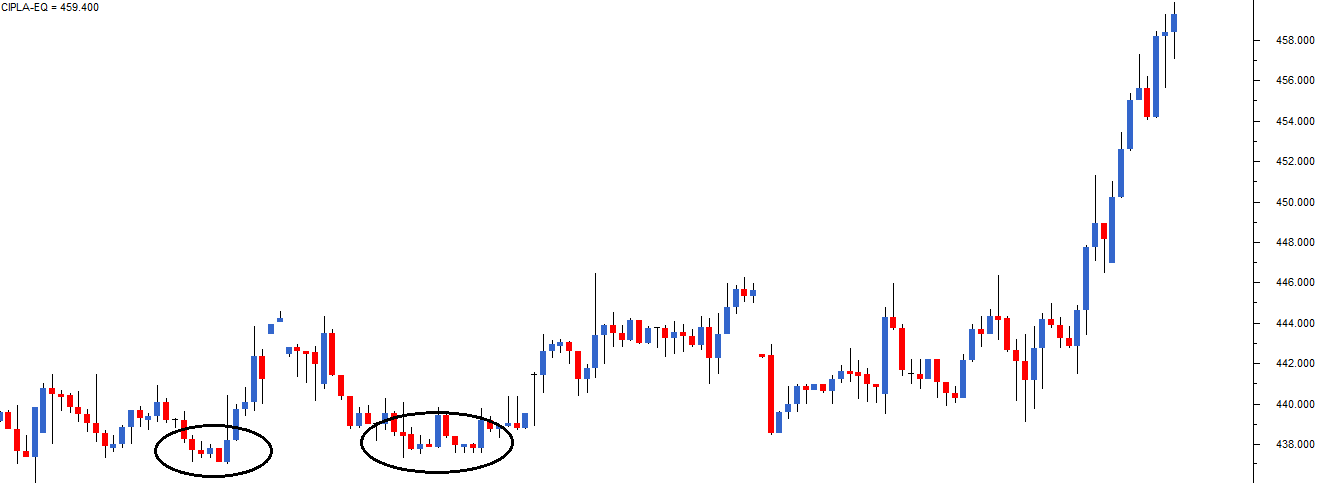
Notice the time interval between the two bottom formations. The price level was well spaced in time.
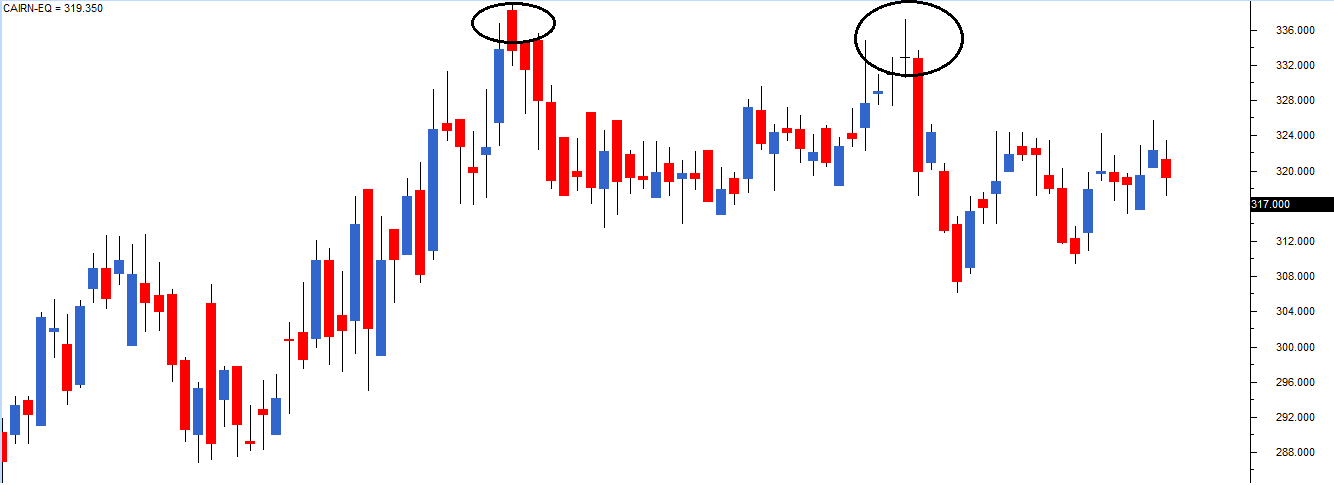
Likewise, in a double top formation, the stock attempts to hit the same high price twice but eventually sells off. Of course, the time gap between the two attempts of crossing the high should at least be 2 weeks. In the chart below (Cairn India Ltd), we can notice the double top at 336 levels. On close observation, you will notice the first top was around Rs.336, and the second top was around Rs.332. With some amount of flexibility, a small difference such as this should be considered alright.
From my own trading experience, I find both double tops and double bottoms handy while trading. I always look for opportunities where the double formation coincides with a recognizable candlesticks formation.
For instance, imagine a situation wherein the double top formation, the 2nd top forms a bearish pattern such as a shooting star. This means, both from the Dow Theory and candlestick perspective there is consensus to sell; hence the conviction to take the trade is higher.
The triple top and bottom
As you may have guessed, a triple formation is similar to a double formation, except that the price level is tested thrice as opposed twice in a double bottom. The interpretation of the triple formation is similar to the double formation.
As a rule of thumb, the more number of times the price tests, and reacts to a certain price level, the more sacred the price level is considered. Therefore by this, the triple formation is considered more powerful than the double formation.
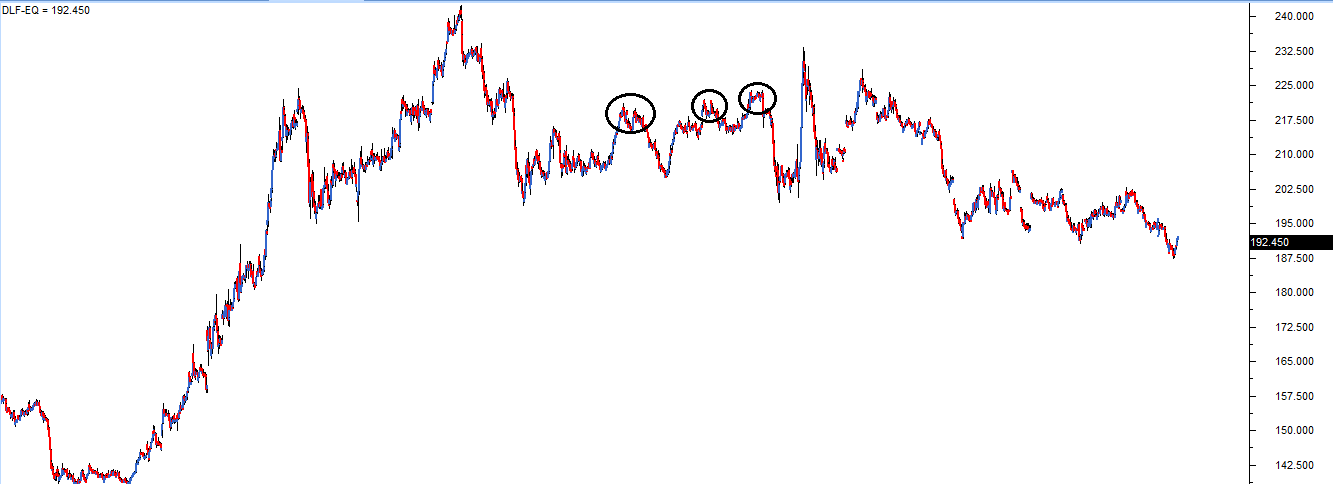
The following chart shows a triple top formation for DLF Limited. Notice the sharp sell-off after testing the price level for the 3rd time, thus completing the triple top.
Key takeaways from this chapter
- Dow Theory was used in the western world even before candlesticks were formally introduced.
- Dow Theory works on 9 basic tenets.
- The market can be viewed in 3 basic phases – accumulation, mark up, and distribution phase.
- The accumulation phase is when the institutional investor (smart money) enters the market, mark up phase is when traders make an entry. The final distribution phase is when the larger public enter the market.
- What follows the distribution phase is the markdown phase, following which the accumulation phase will complete the circle.
- The Dow theory has a few basic patterns, which are best used in conjunction with candlesticks.
- The double and triple formations are reversal patterns, which are quite effective.
- The interpretation of double and triple formations are the same