Charts for 7th December, 2023 Expiry
#safebull , Information , Market
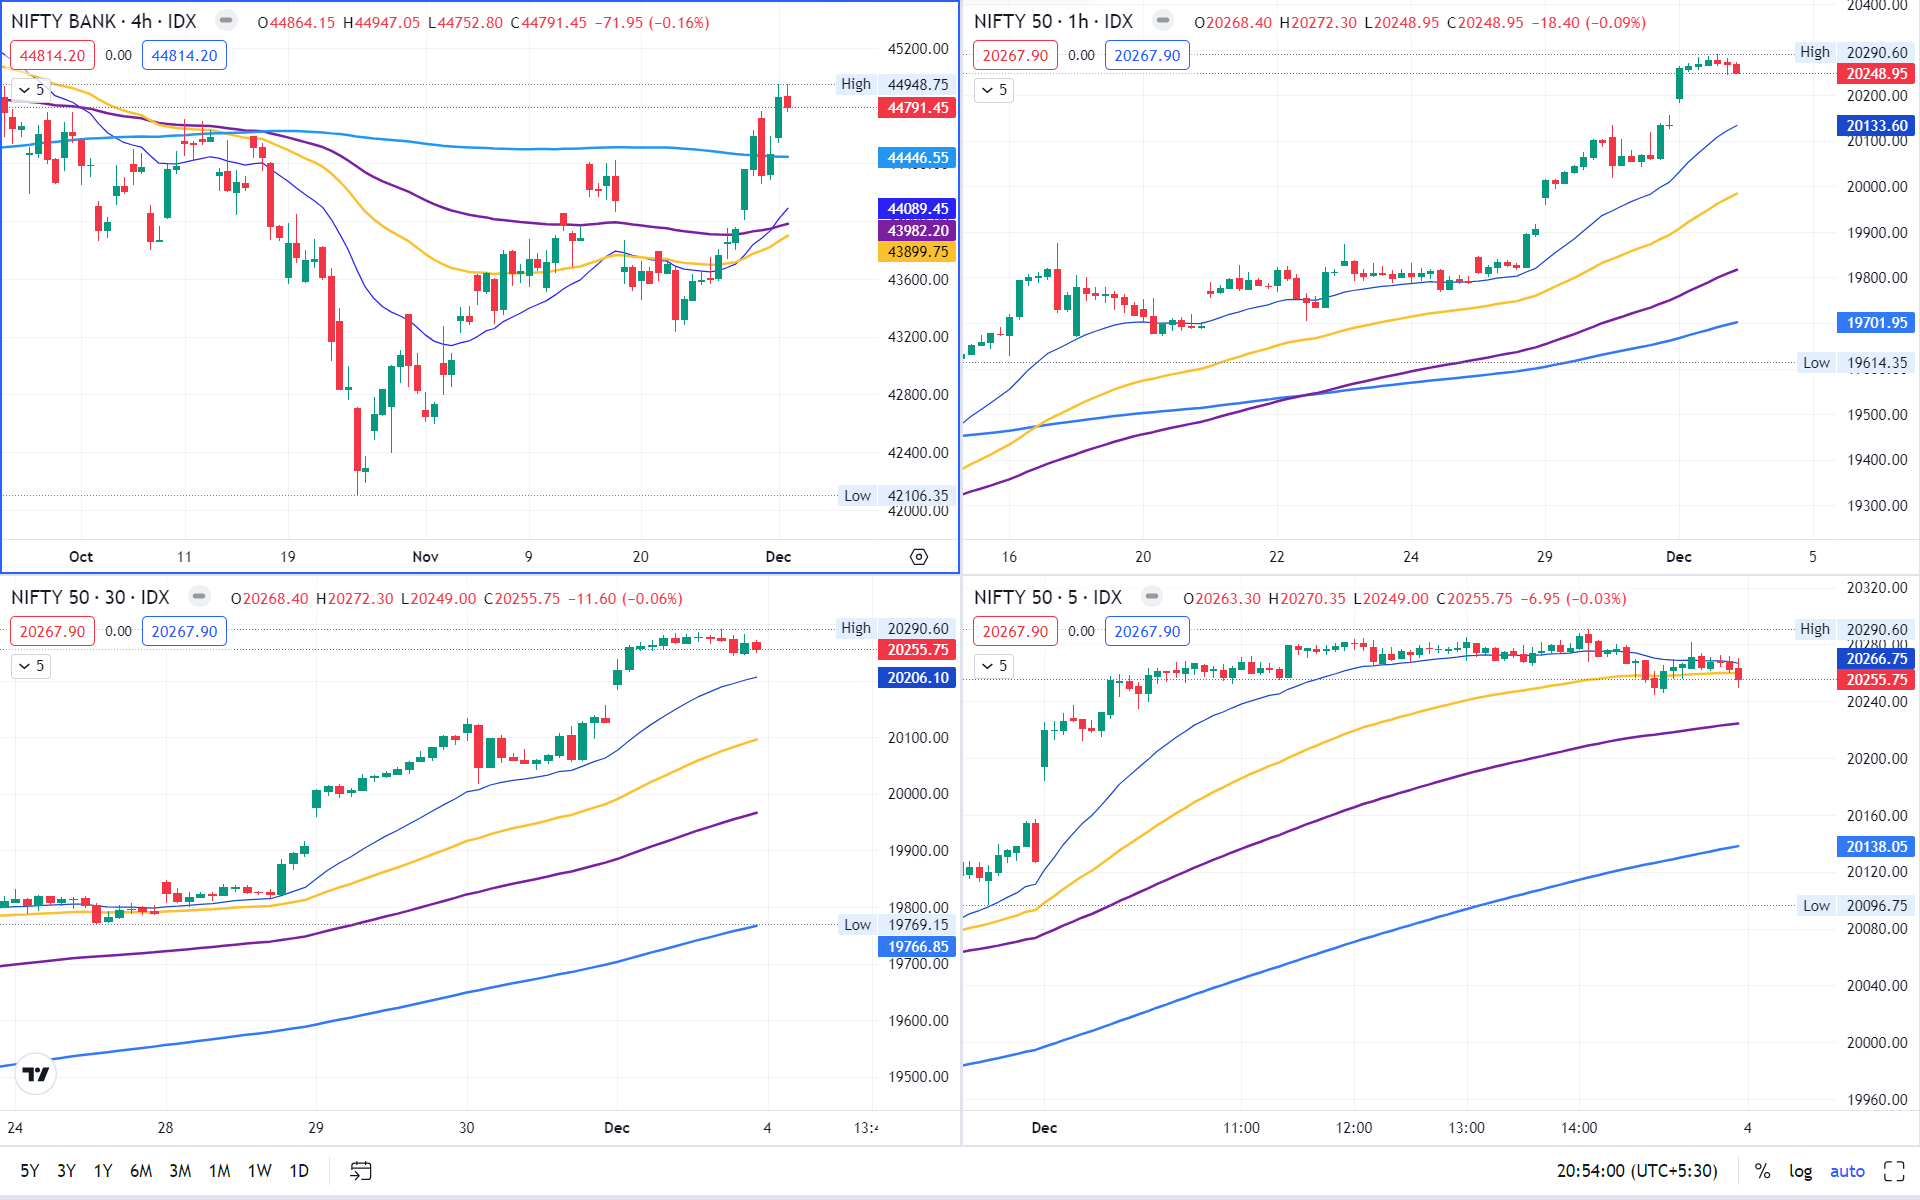
NIFTY 50
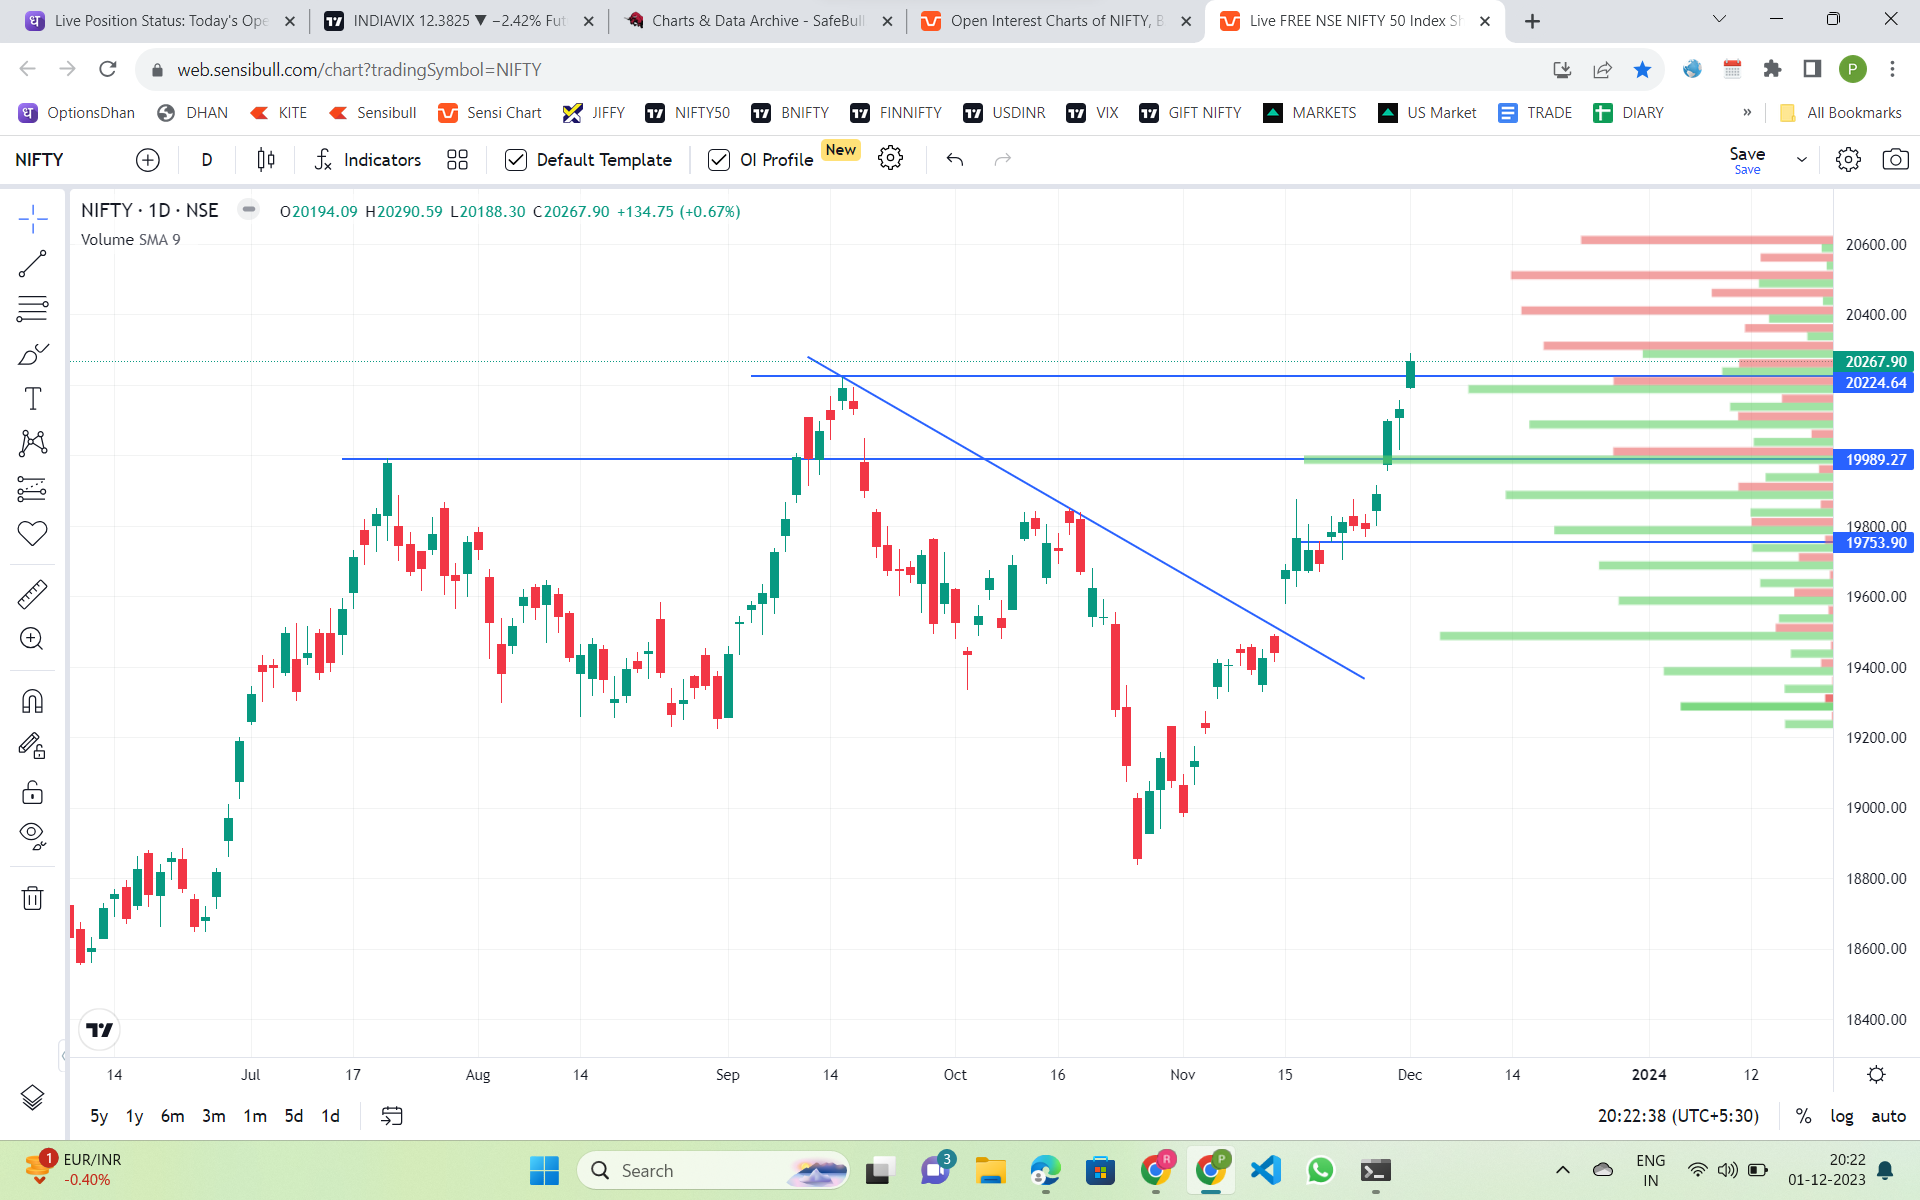
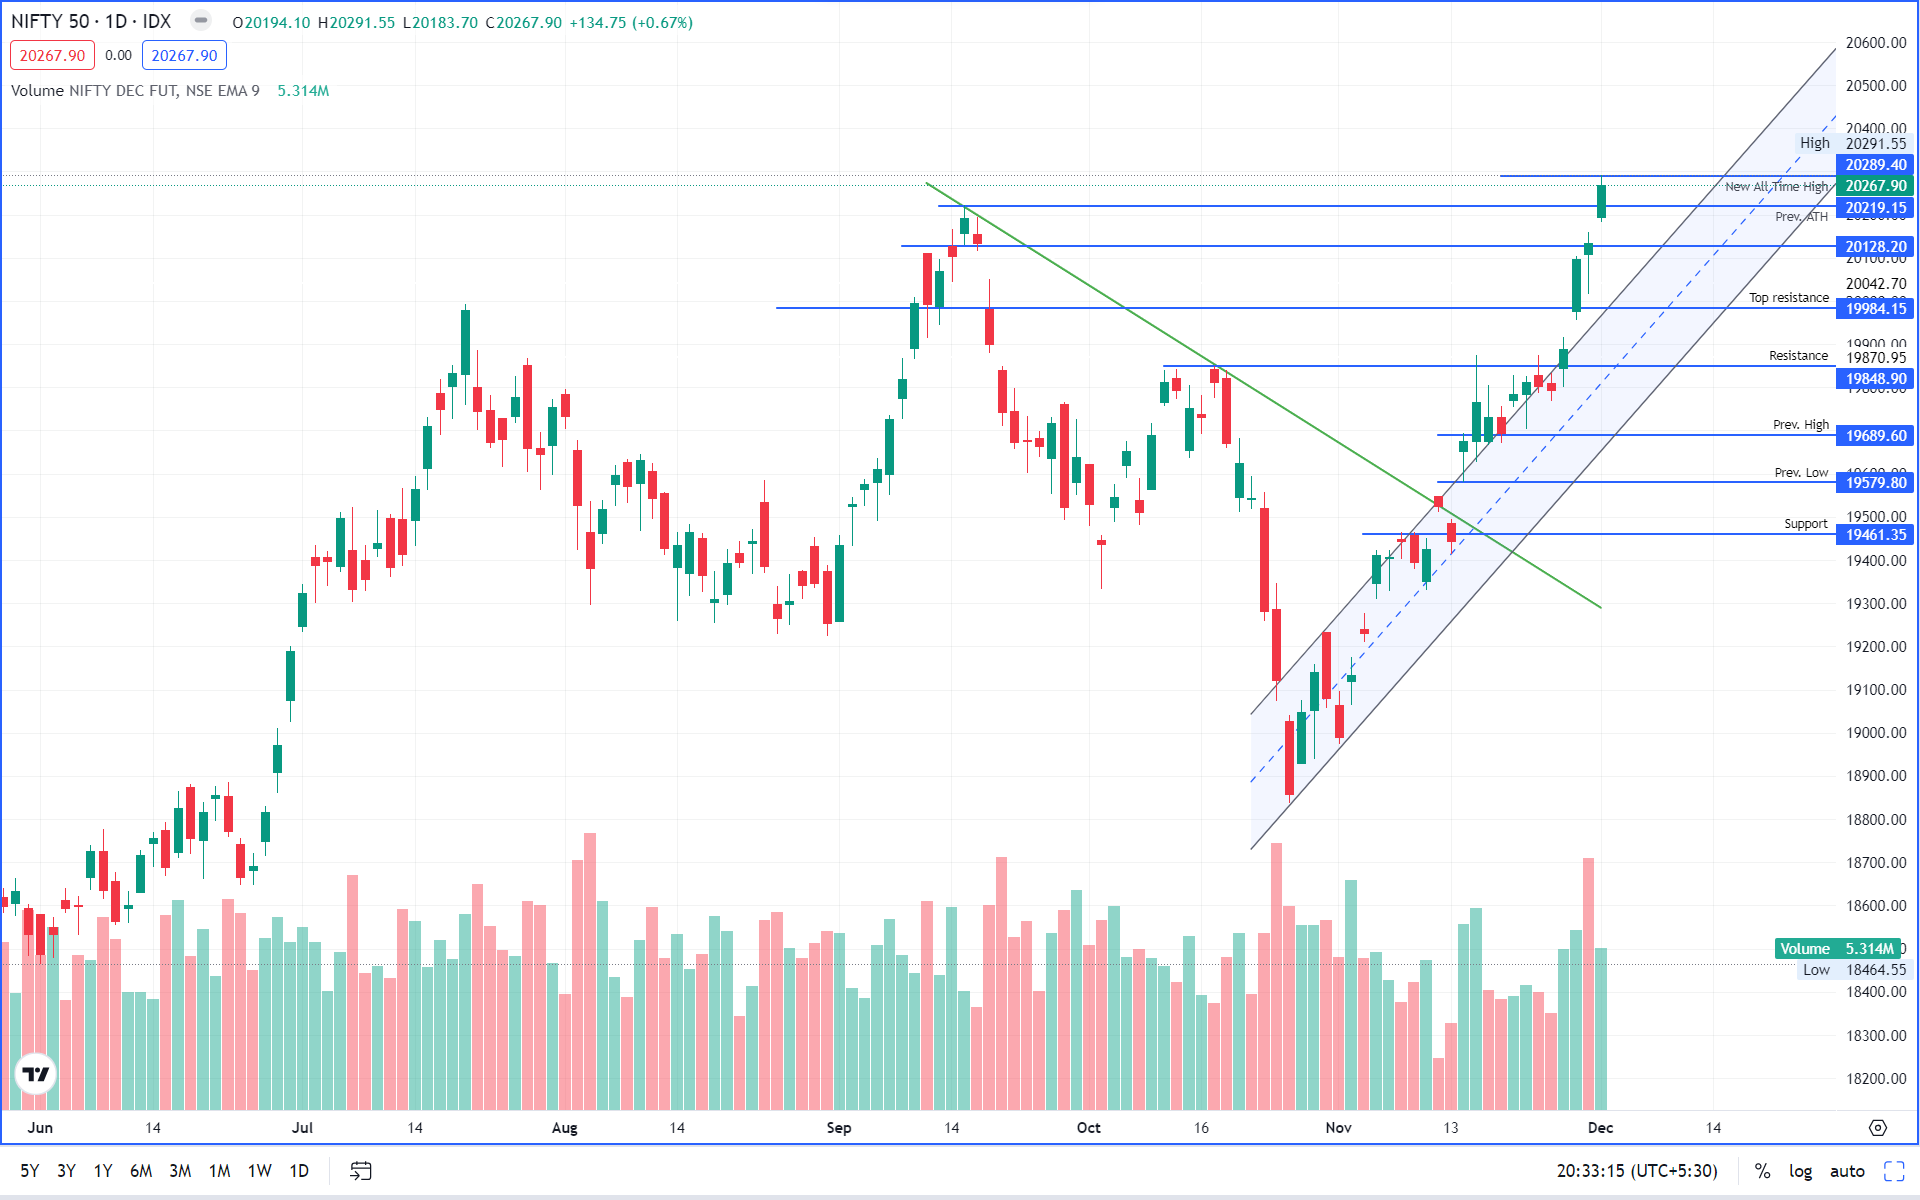
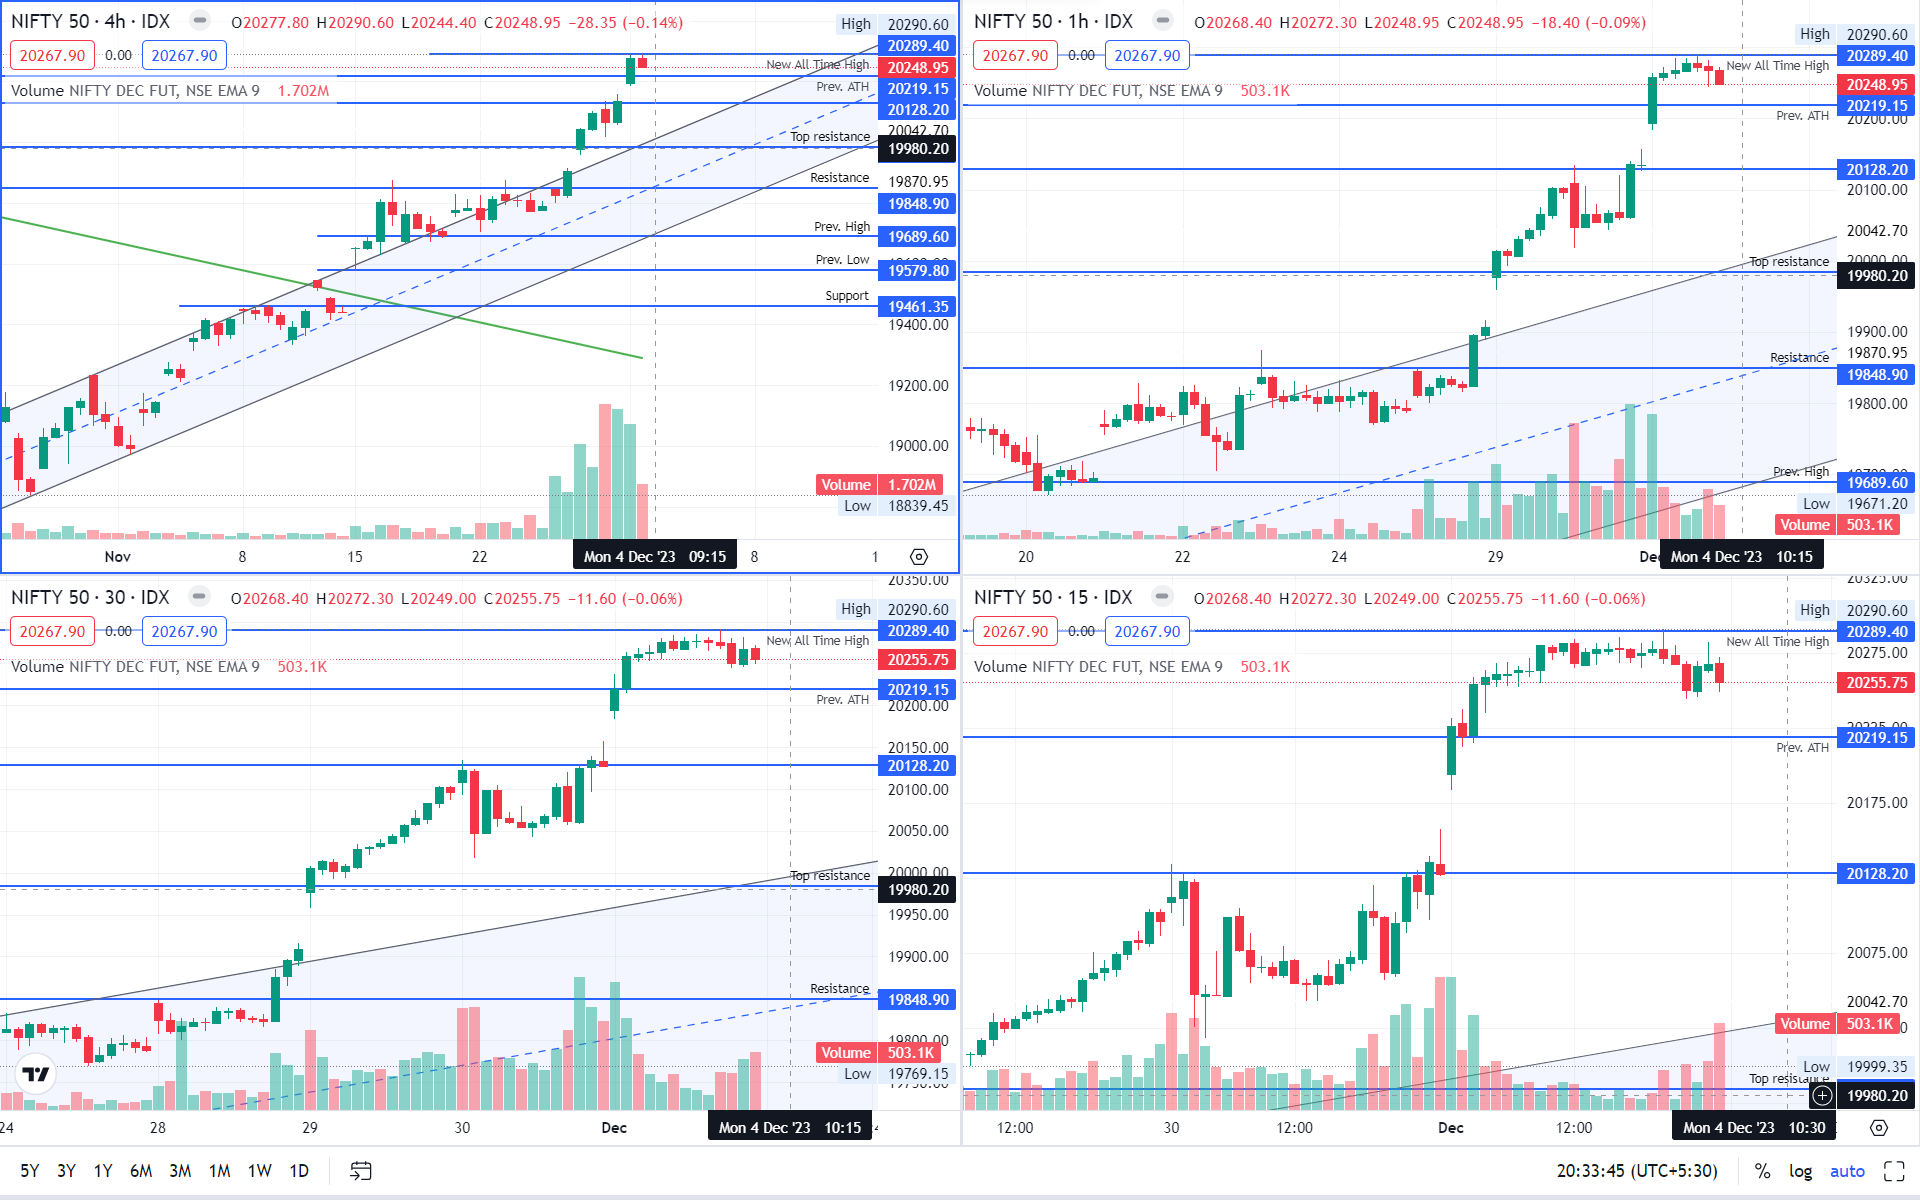
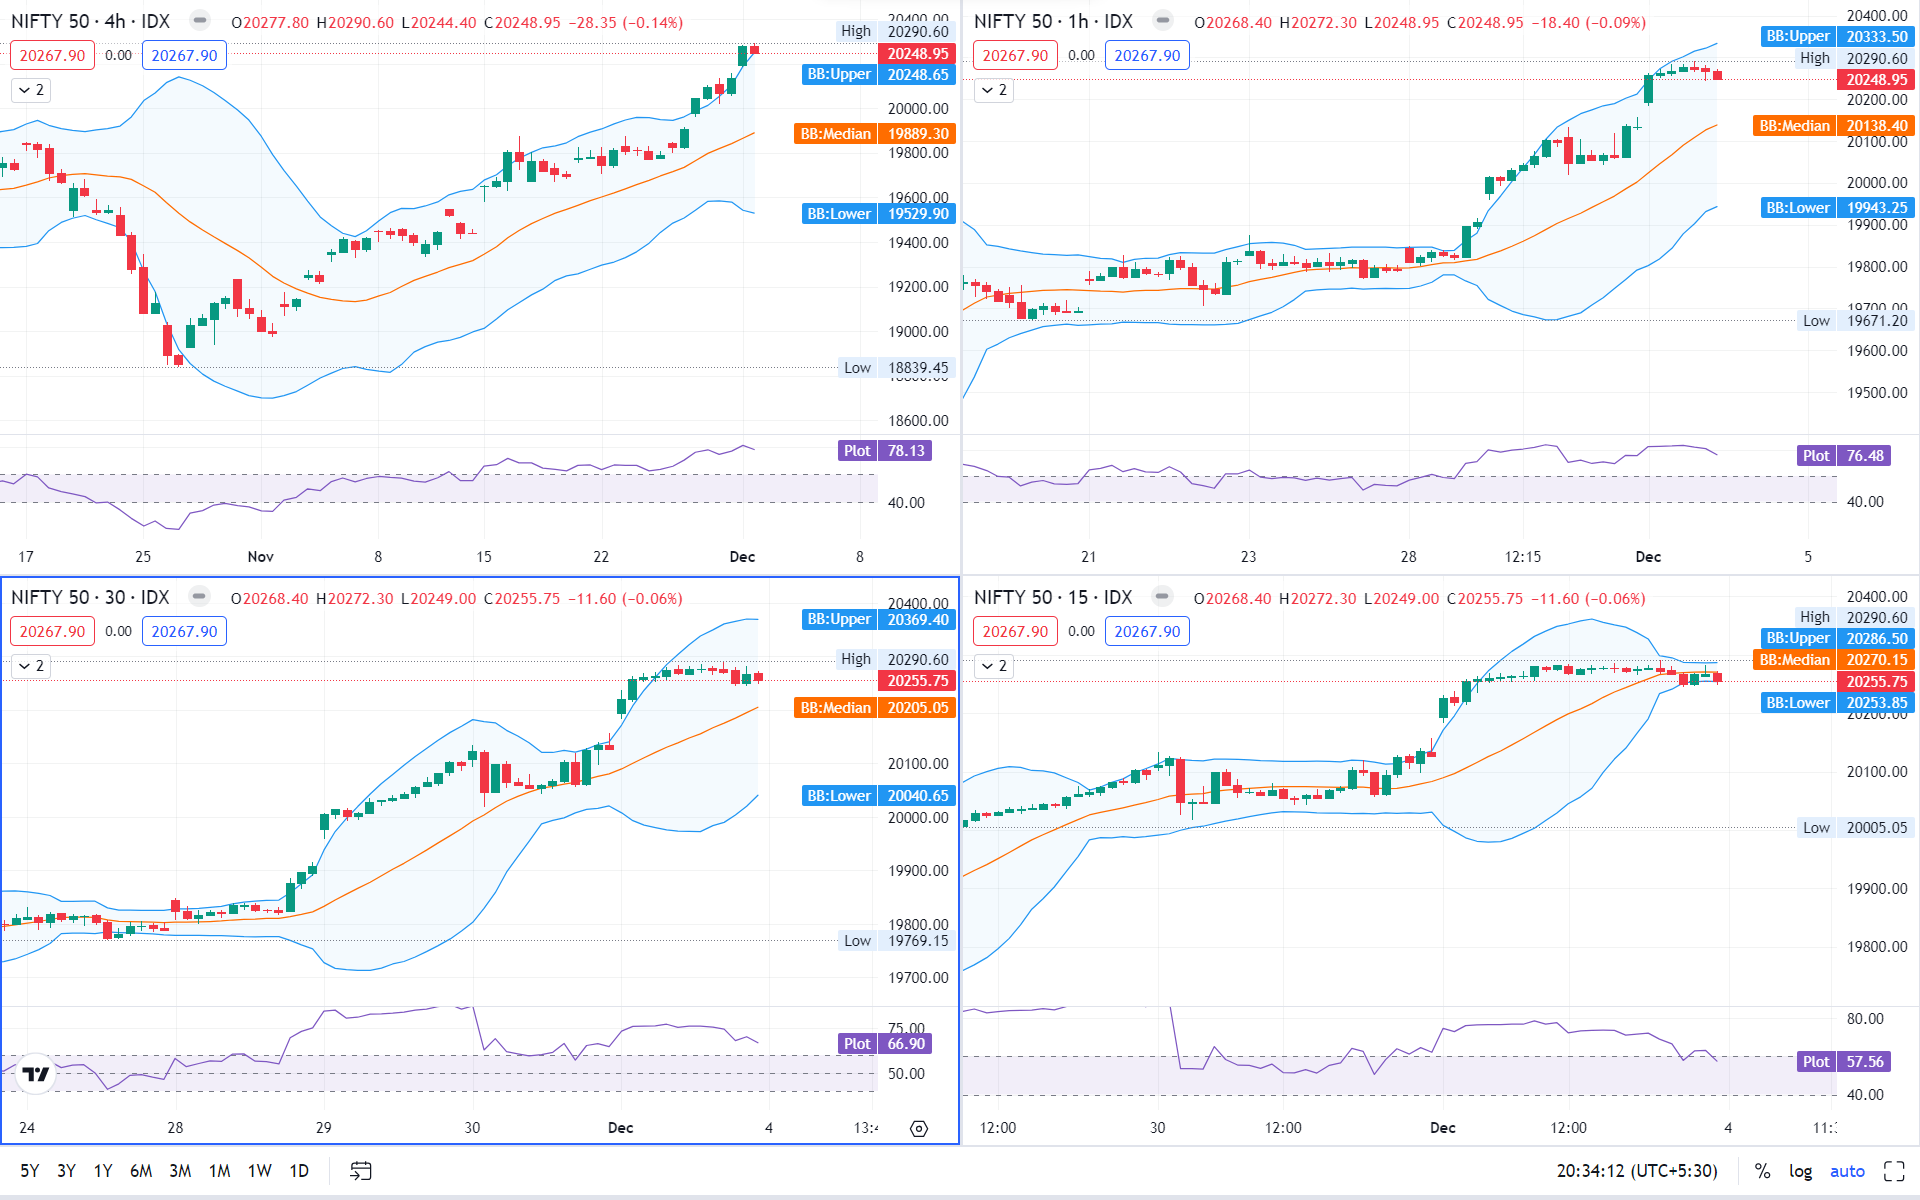
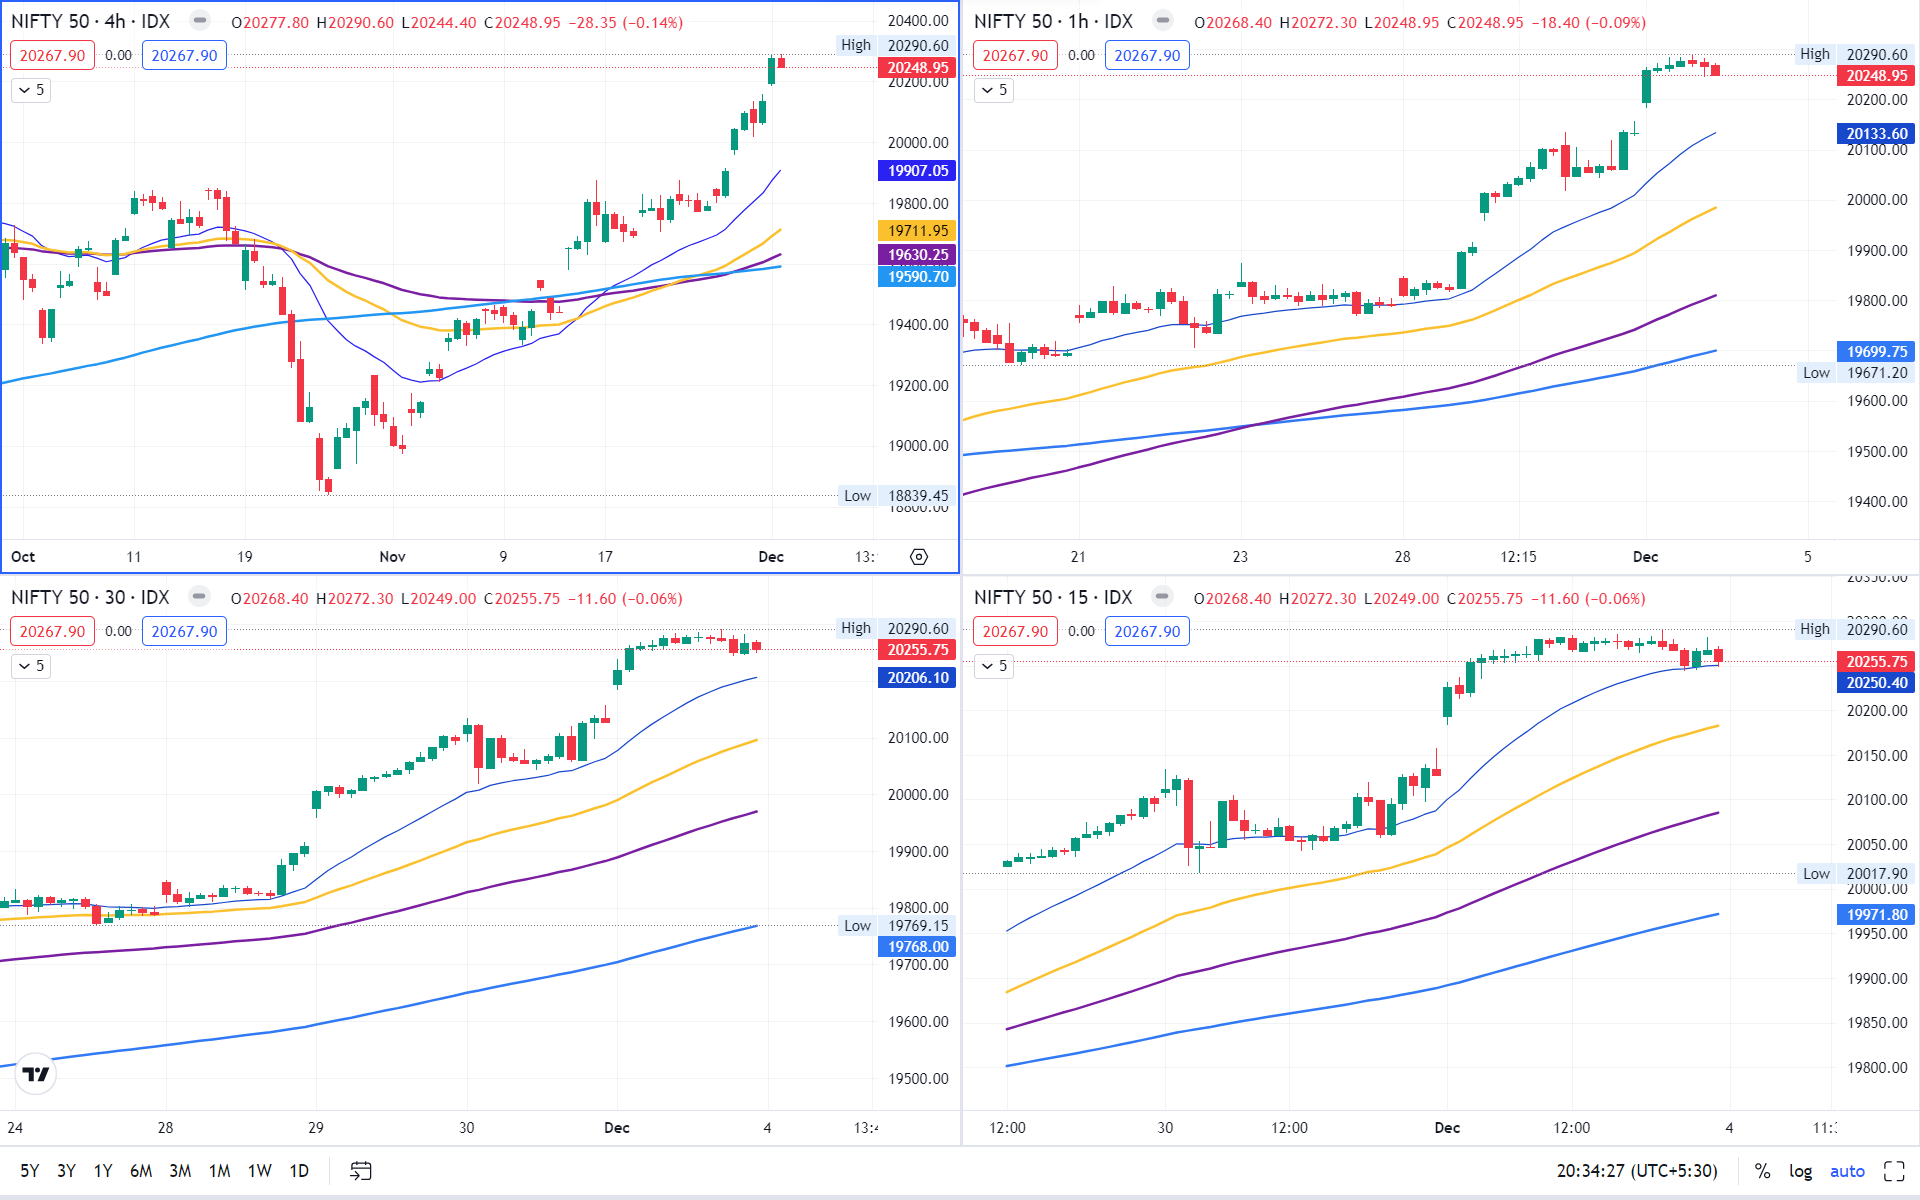
View :
At a new all time high, and highest ever close. Reclaimed 20,000 level once again. Very positive.
Price action on daily time frame looks positive avoid shorting at all cost.
At an unknown horizon, volatility is expected to remain.
Important Levels
- Resistance – 20,400 -20,500
- Support – 20,000 – 20,200
- No trading Zone – 20,000 – 20,200
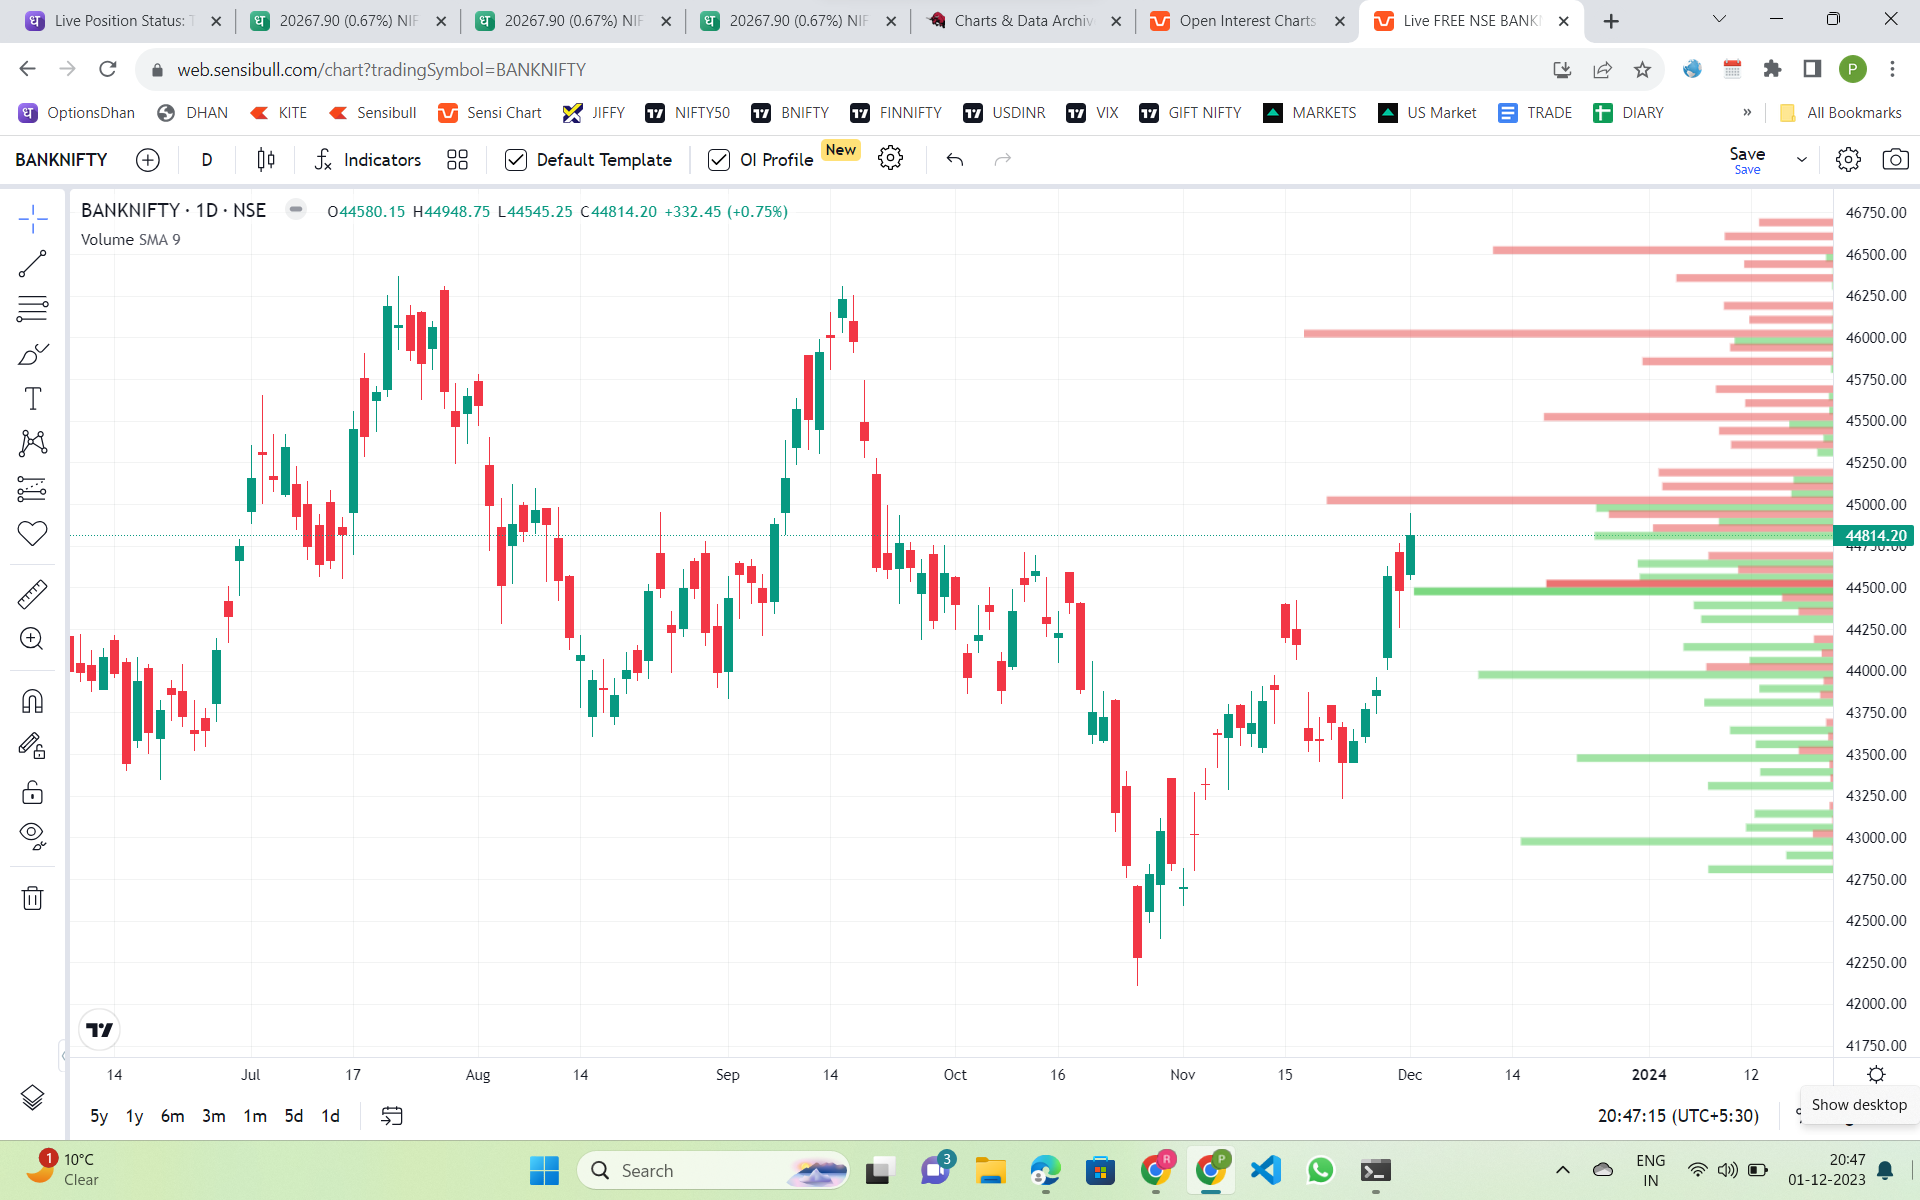
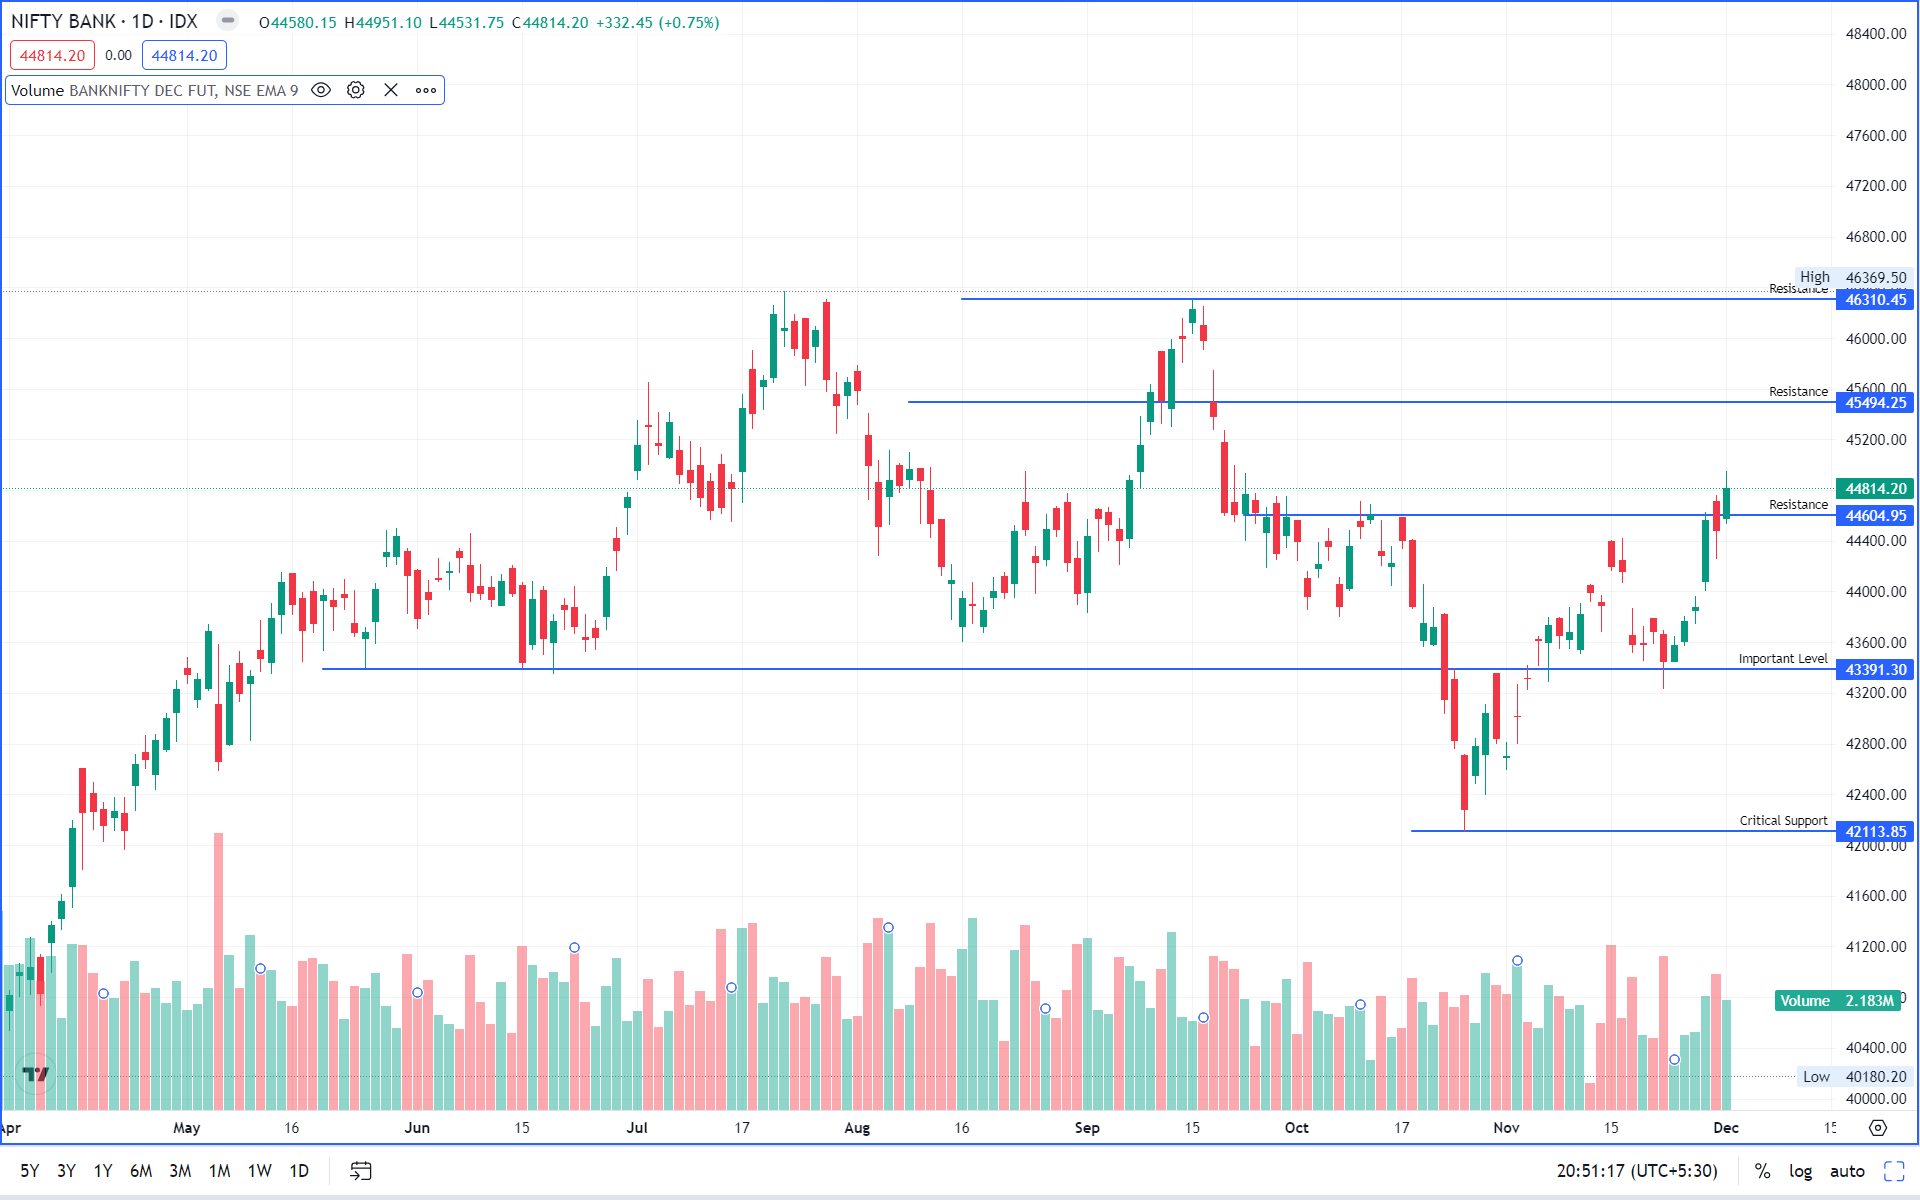
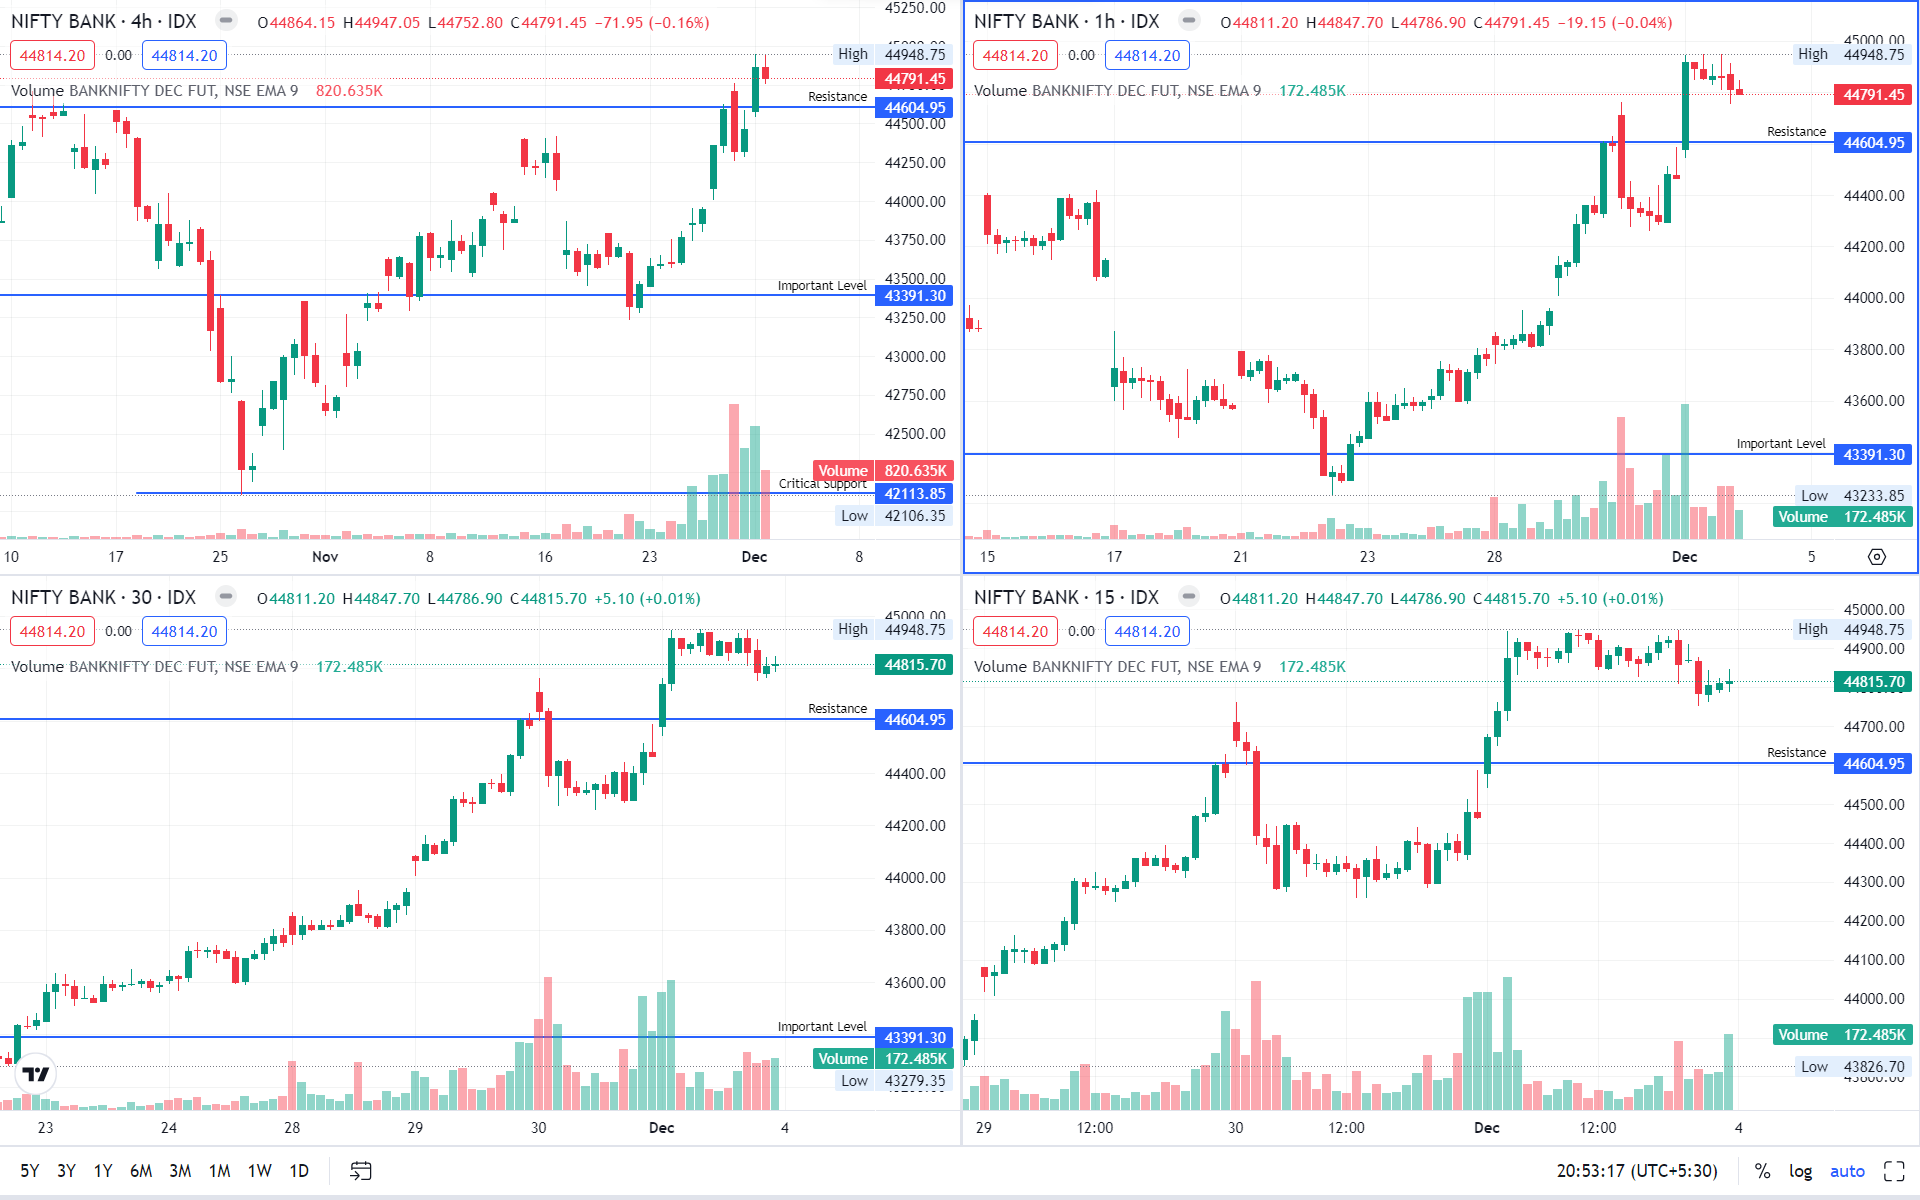
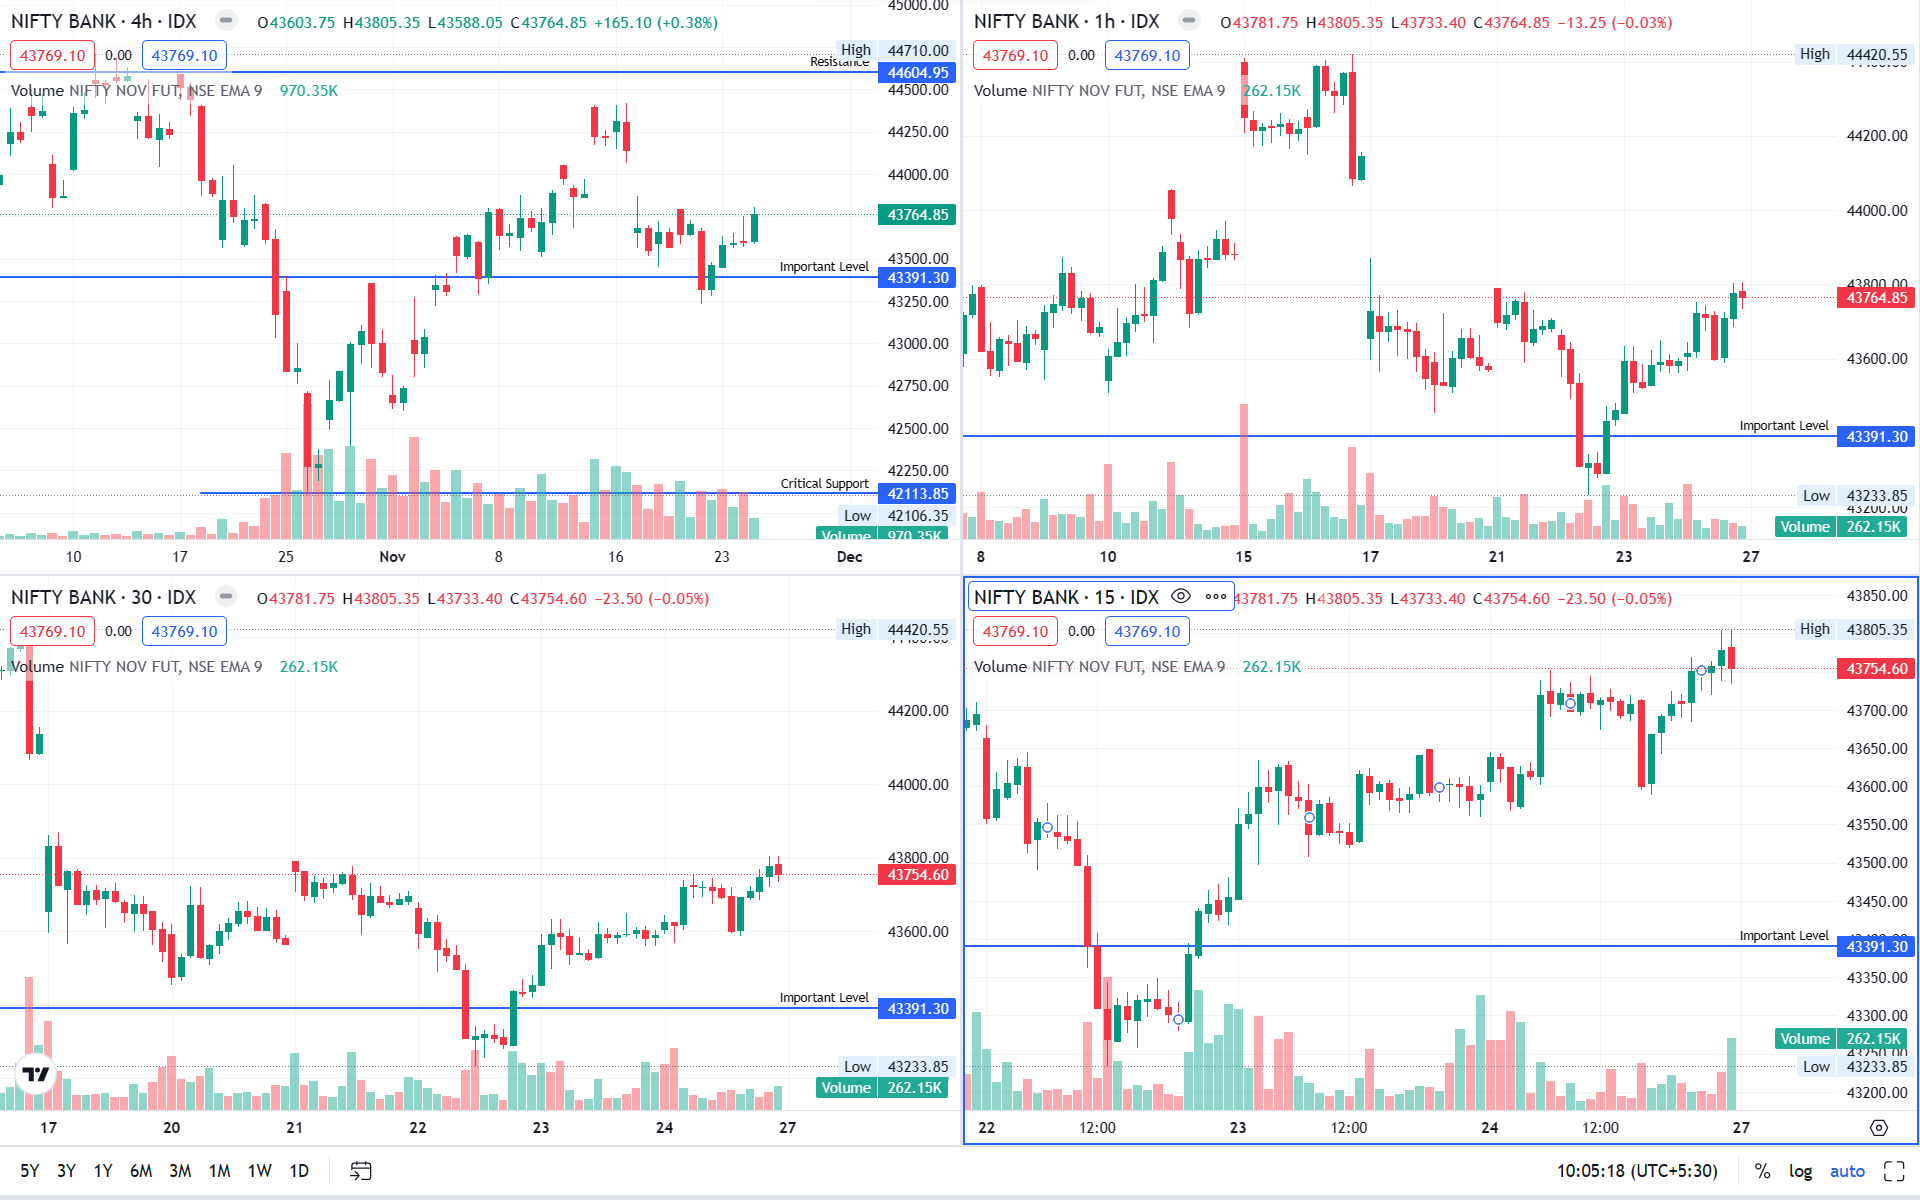
BANKNIFTY
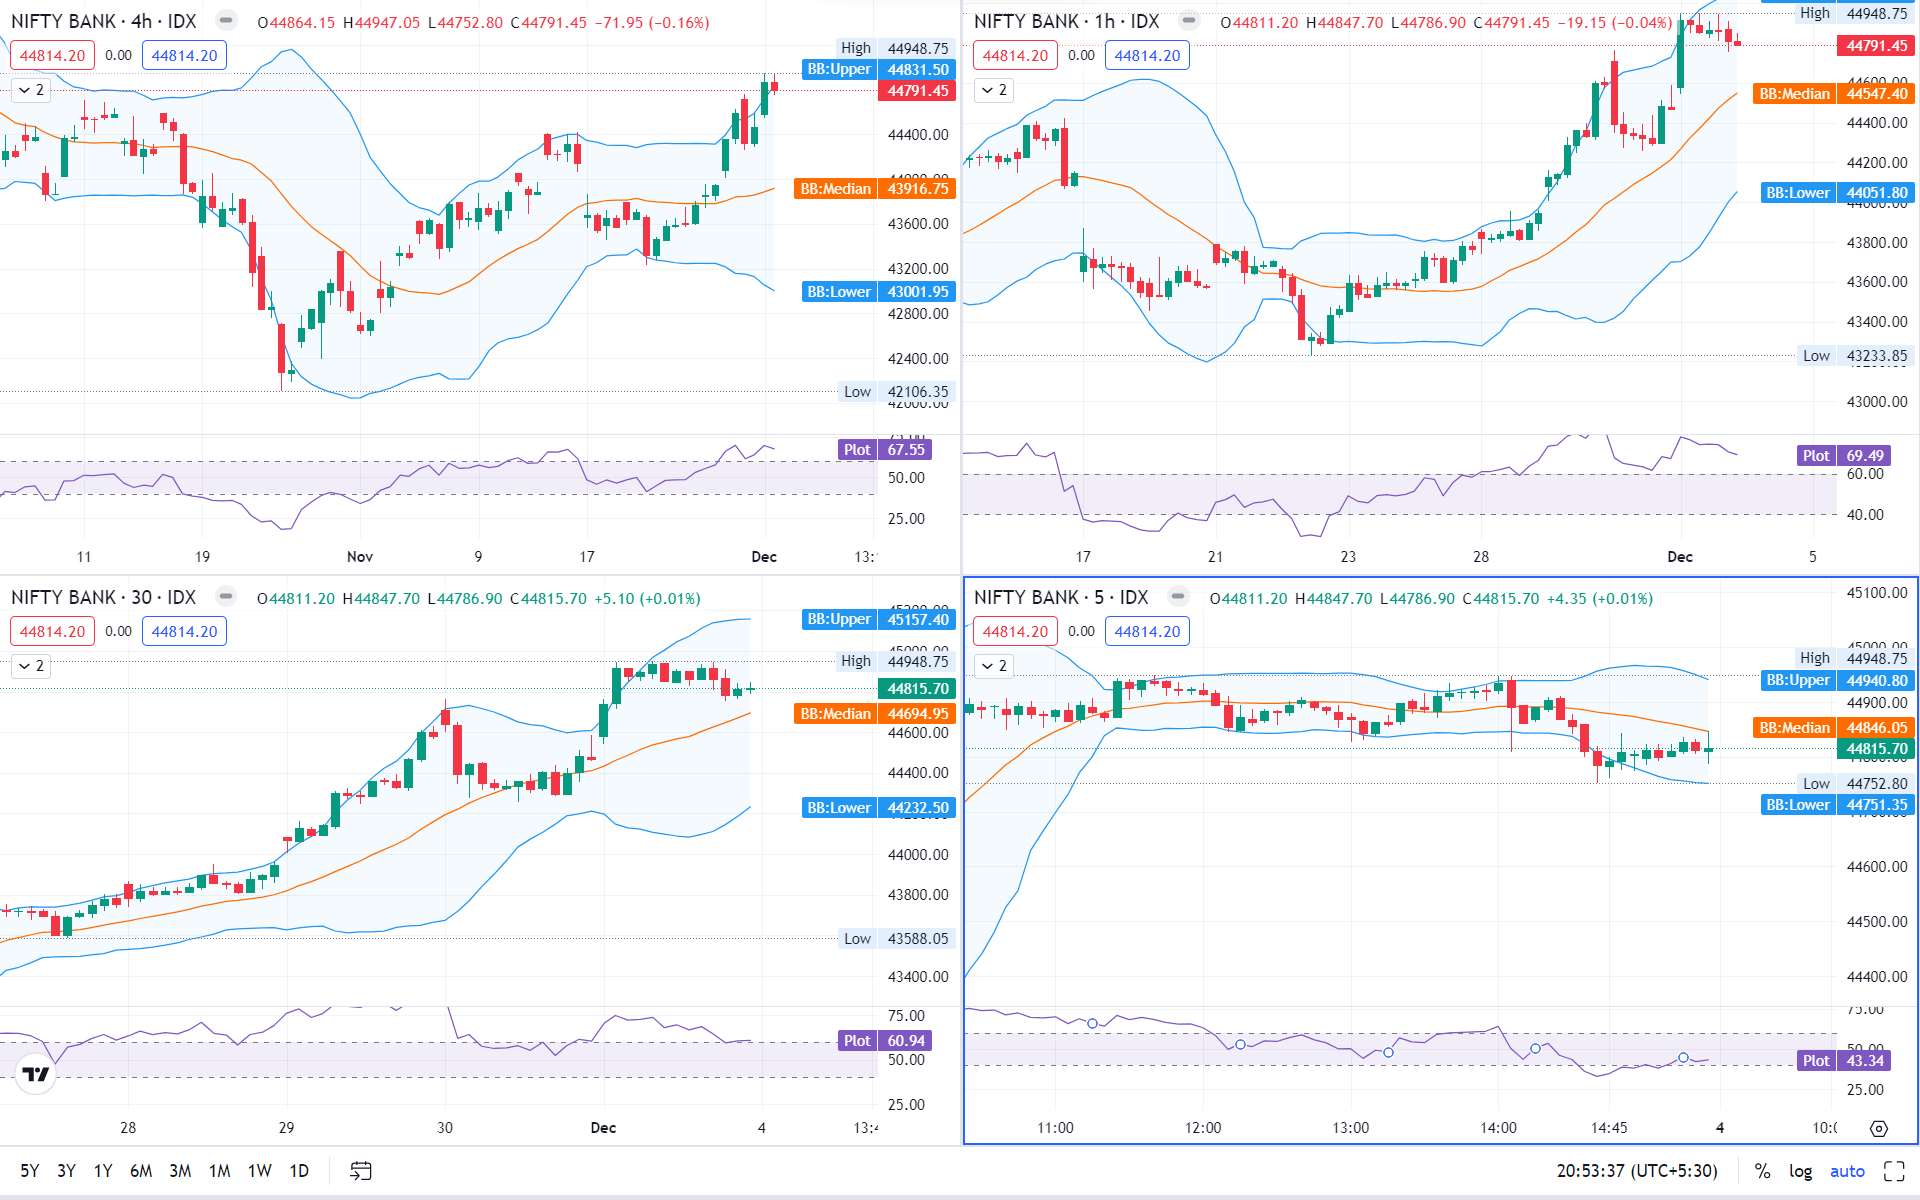
View :
Price action is settling strongly at a very bullish zone. Closed above 44,600 and it is expected for further up move.
On daily time frame, there has been a strong buying after a dip.
On a shorter time BANKNIFTY is a buy on dip.
Important Levels
- Resistance – 45,000 – 45,200
- Support – 44,400 – 44,500
- No trading – 44,400 – 44,500
Nice observation 👍
Thank you