Charts for 14th December, 2023 Expiry
Charts , Data
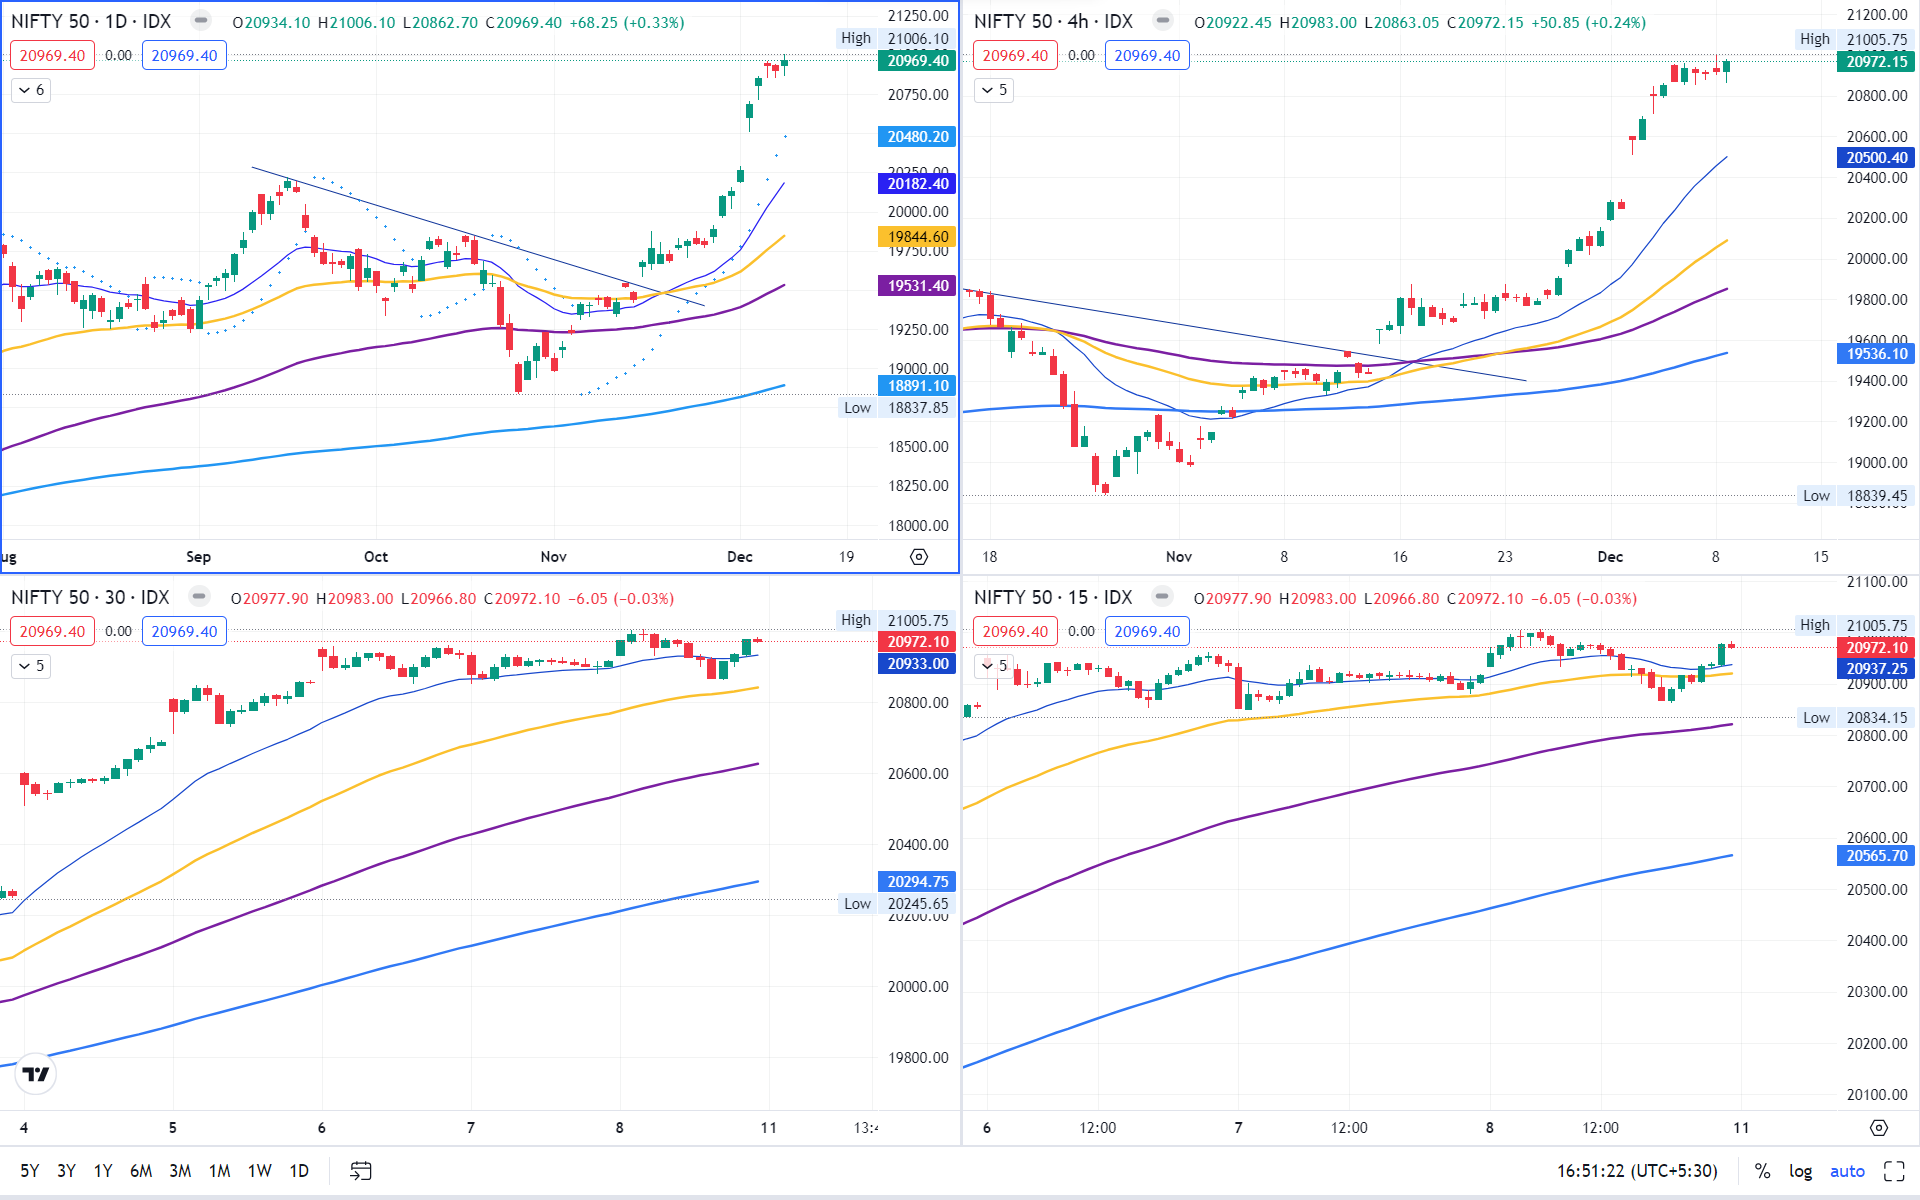
NIFTY 50
View :
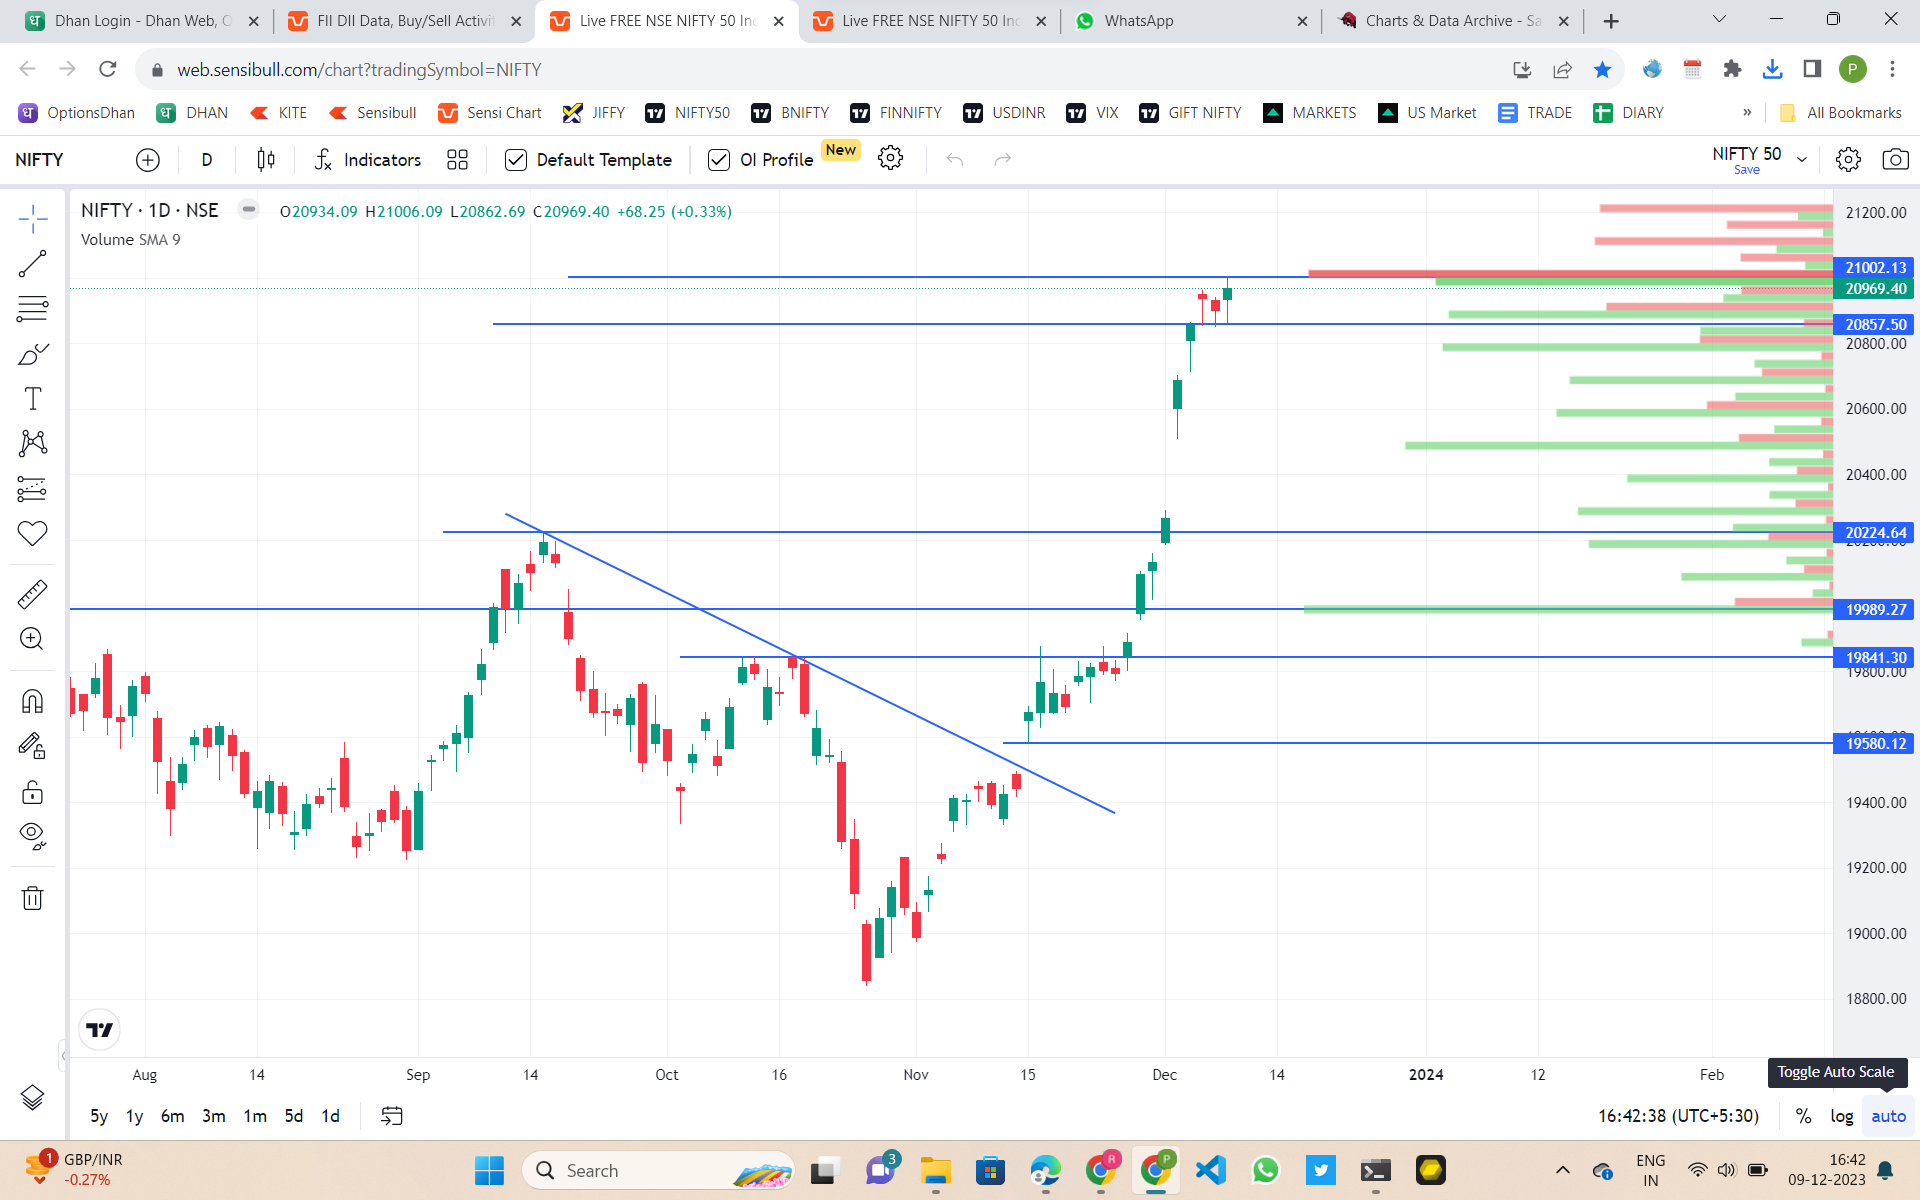
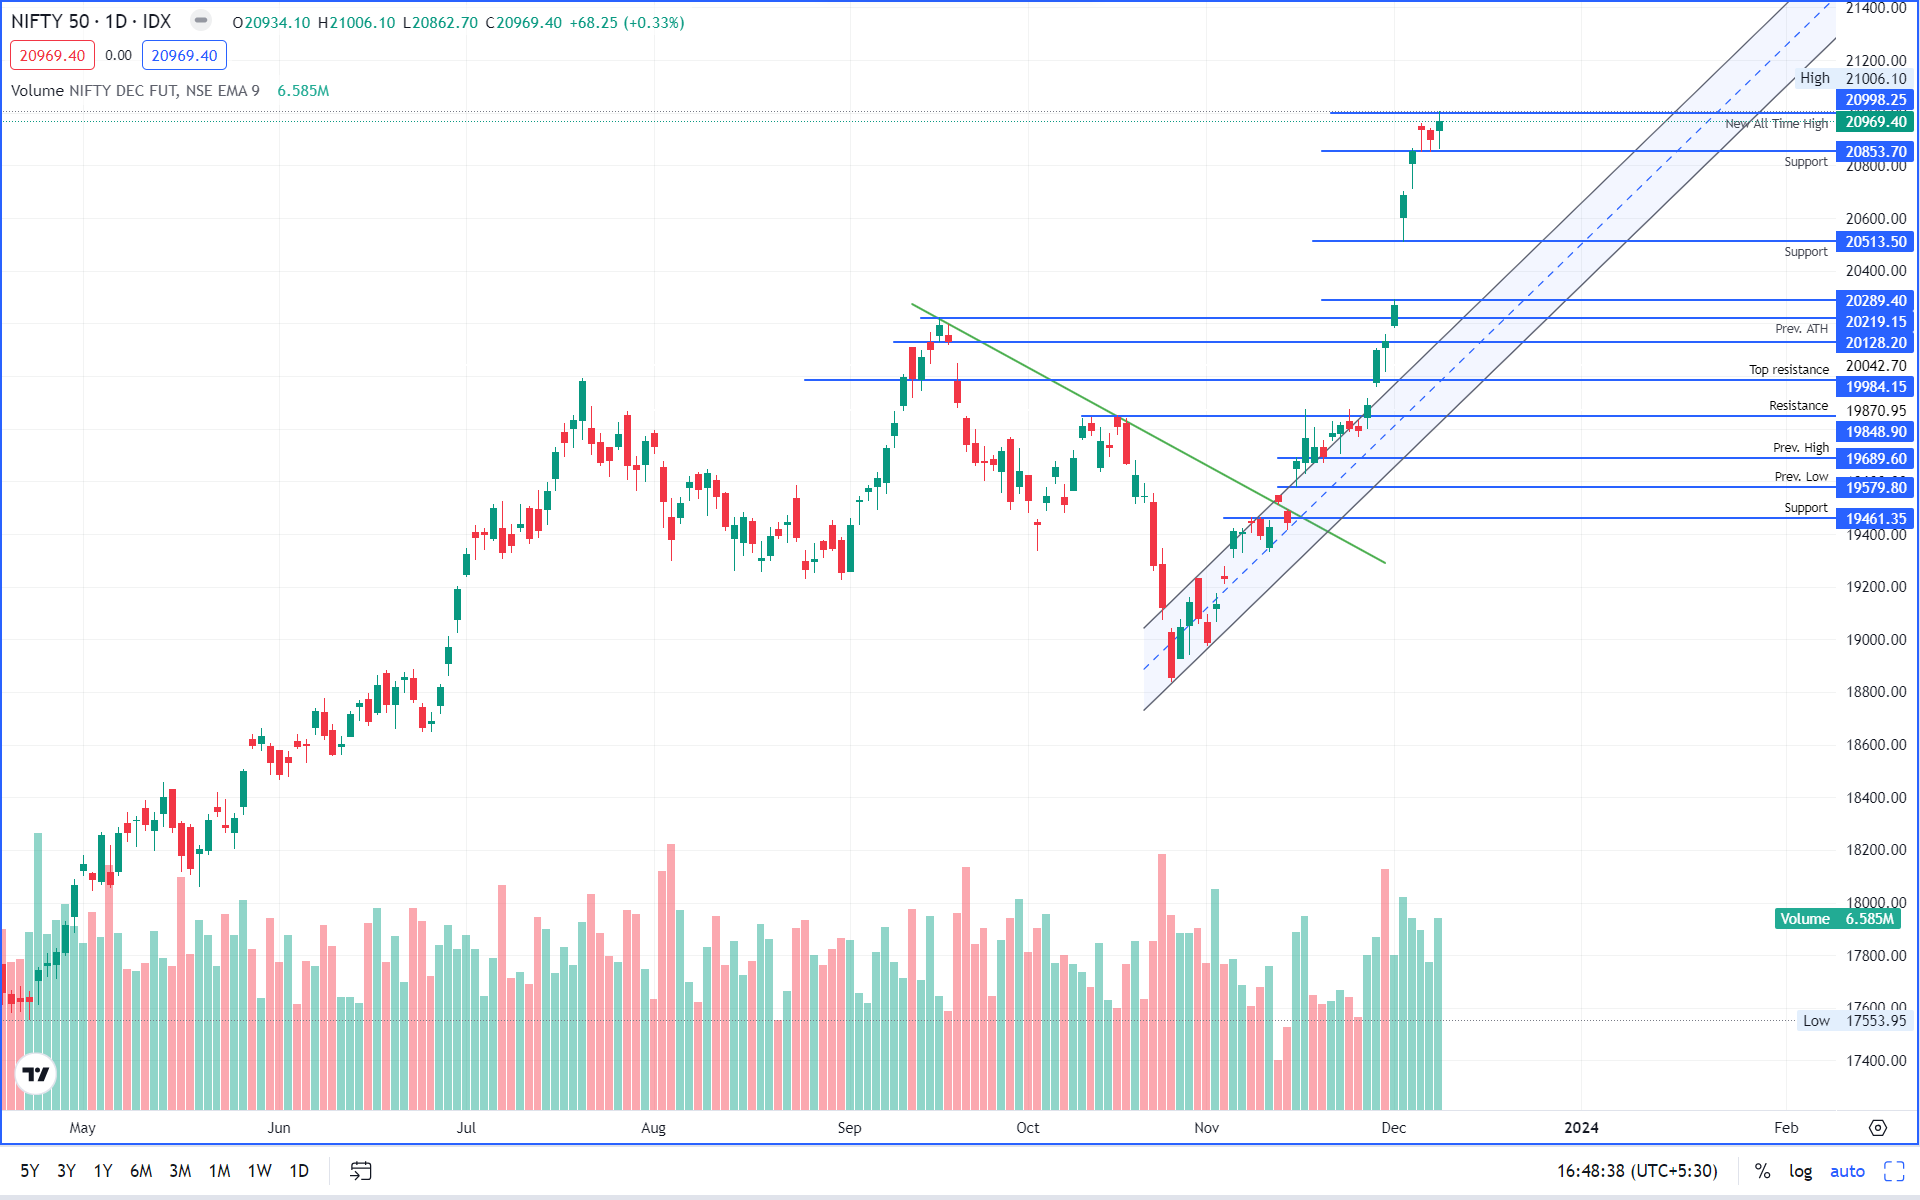
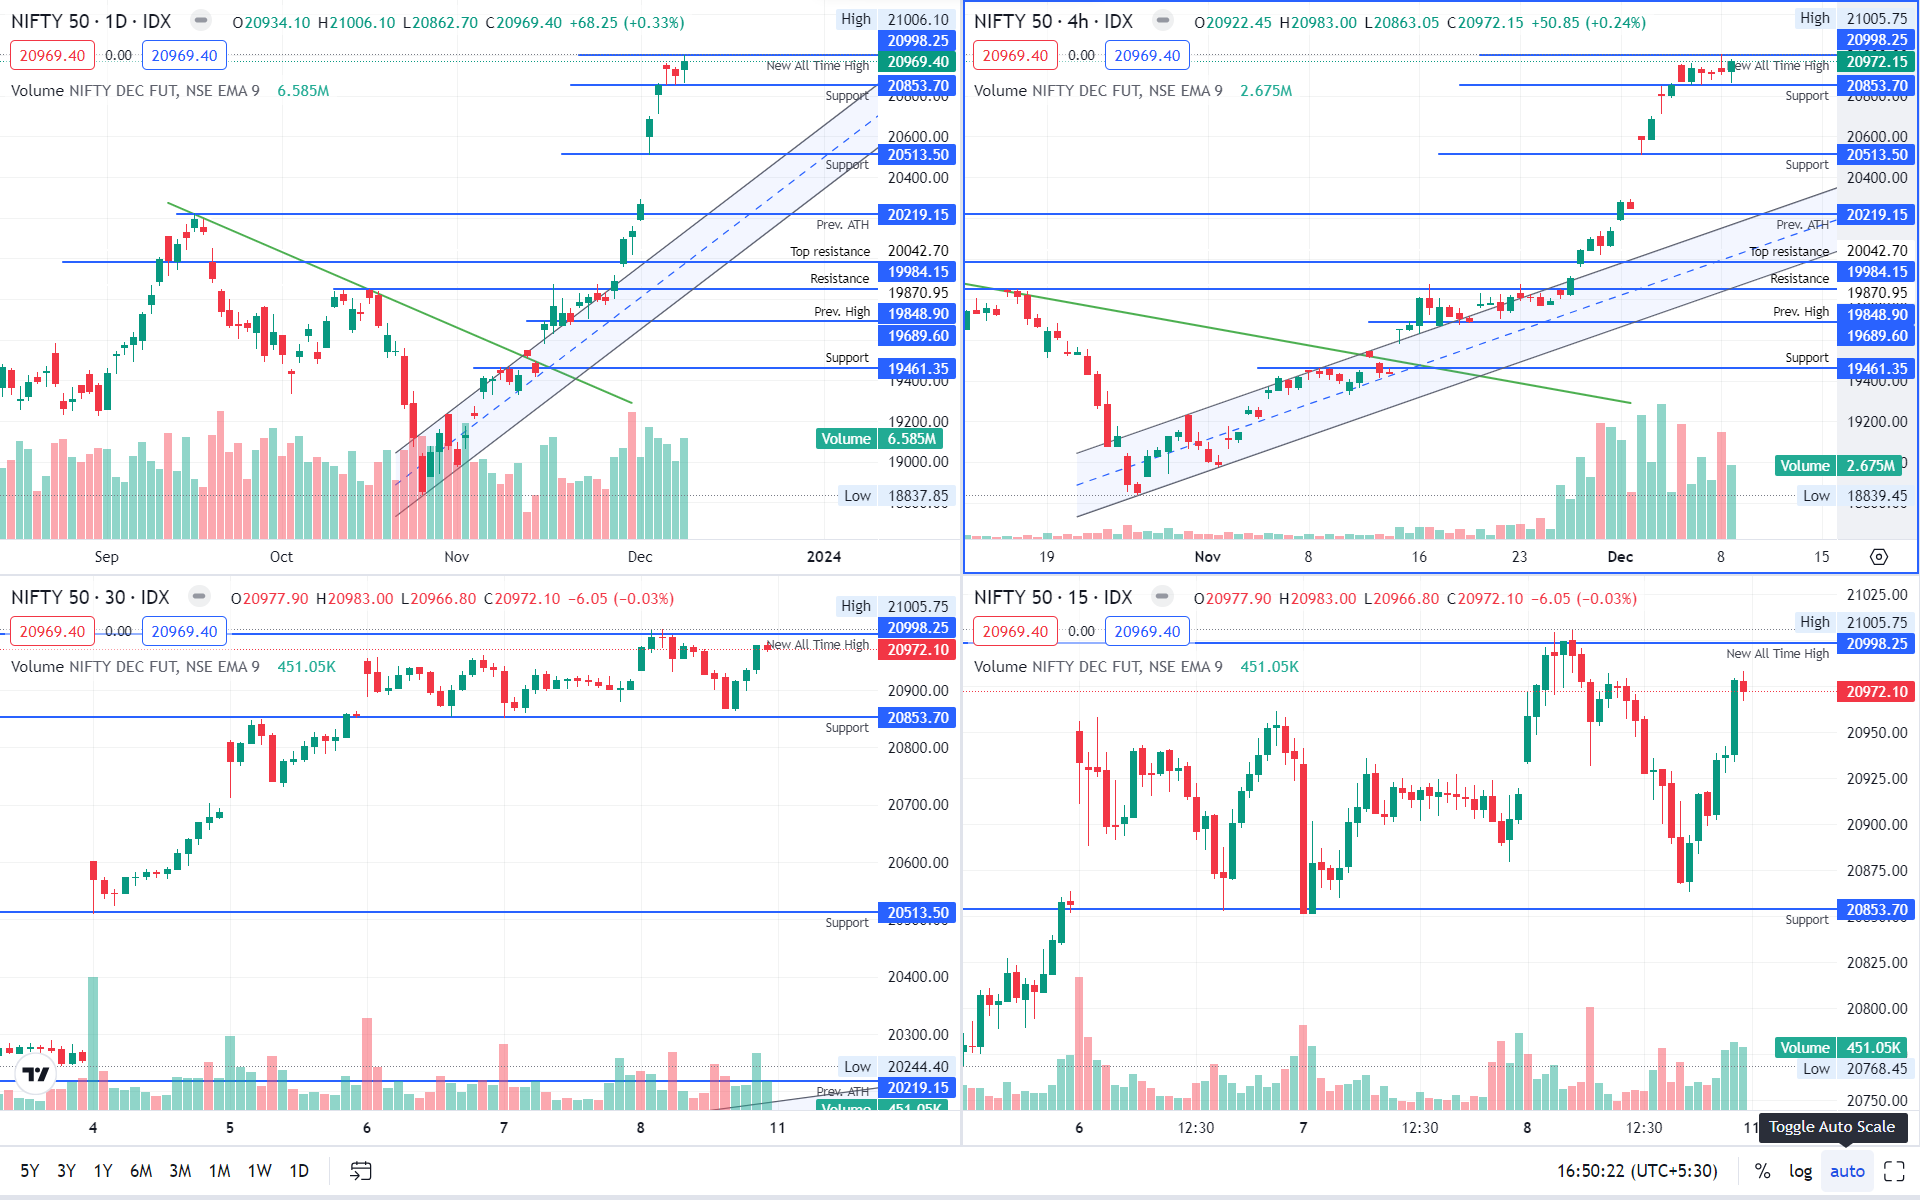
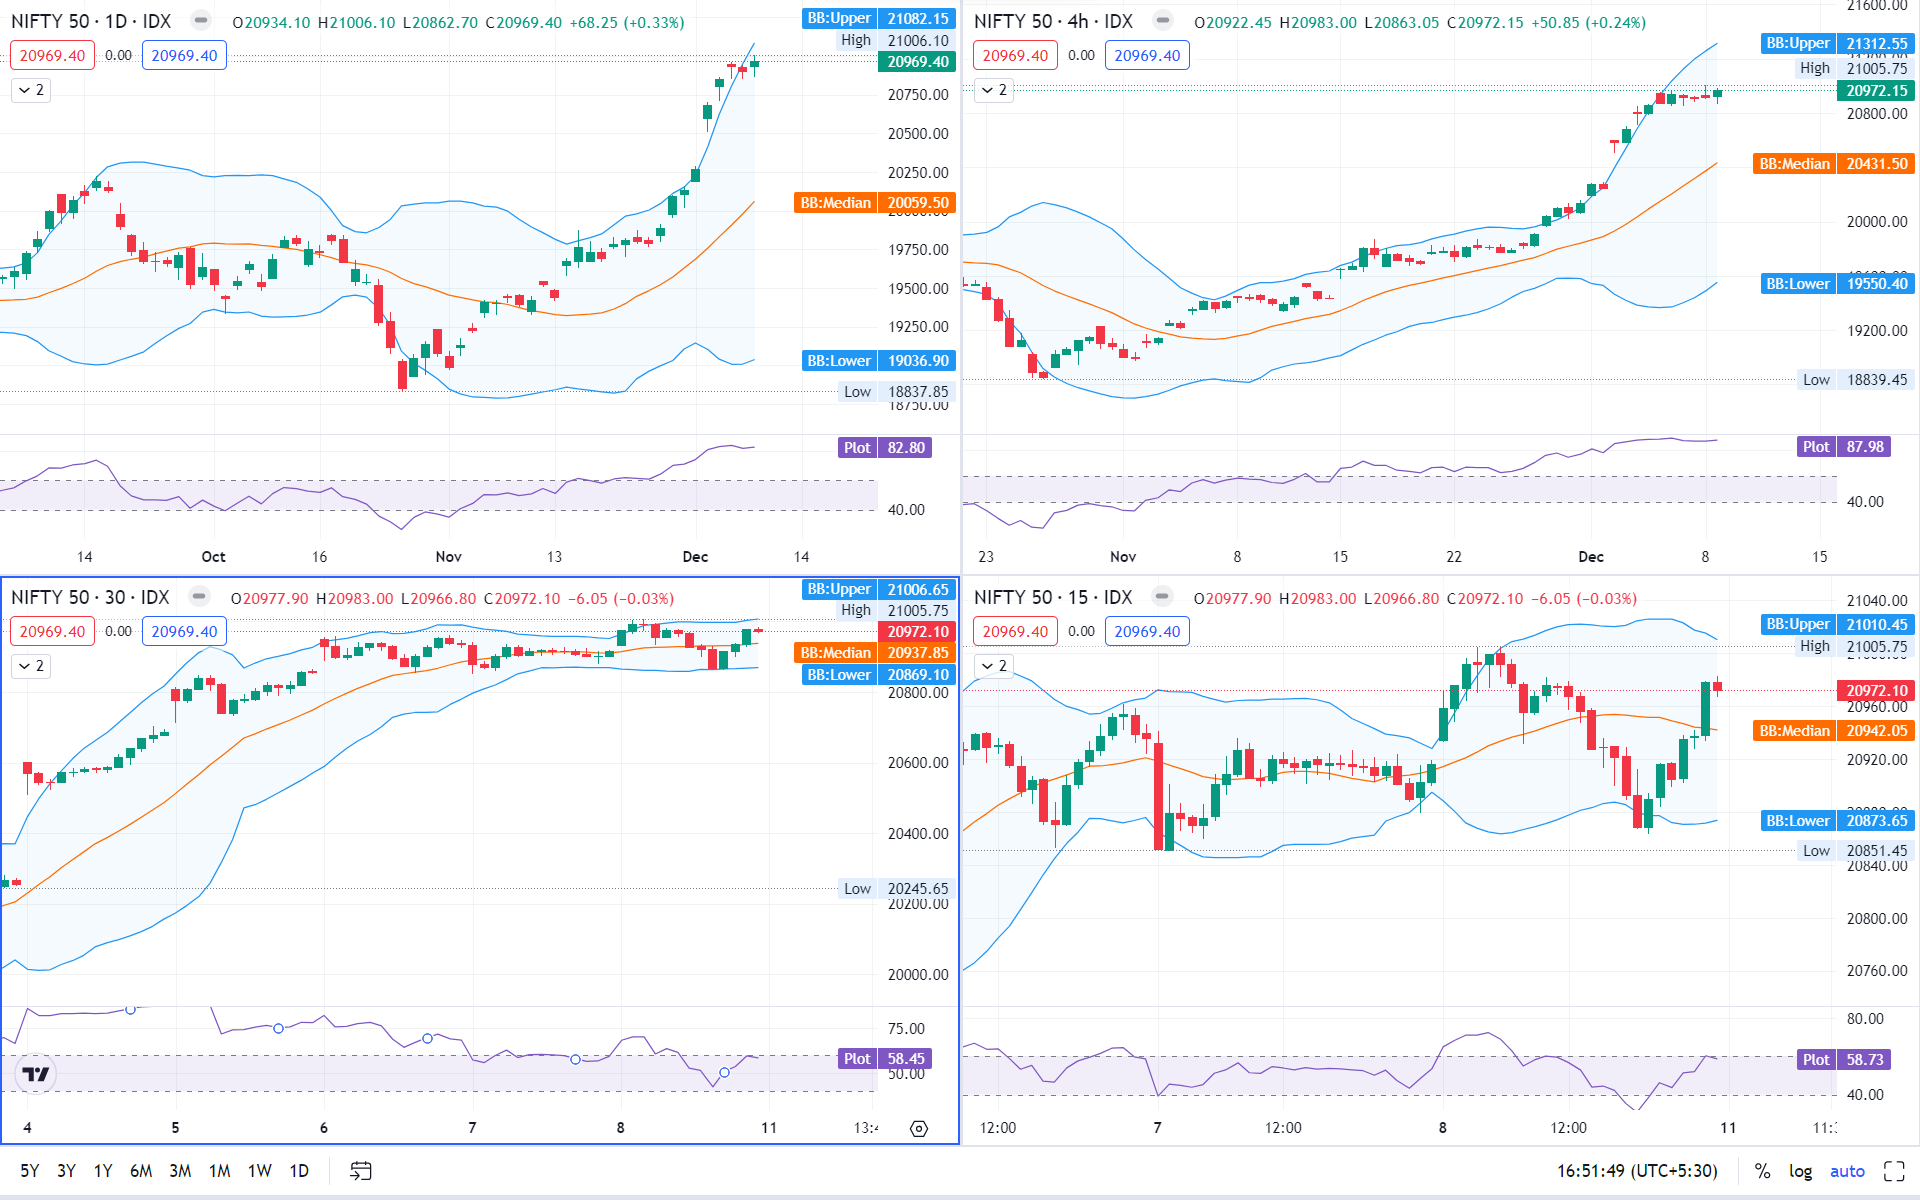
At a new all time high, yet another landmark tested, 21,000 level. Volatility is anticipated.
Price action on daily time frame looks positive avoid shorting at all cost, market remained rangebound at the top. Very Bullish.
At an unknown horizon, volatility is expected to remain.
Important Levels
- Resistance – 20,950 -21,000
- Support – 20,800 – 20,850
- No trading Zone – 20,850- 20,950
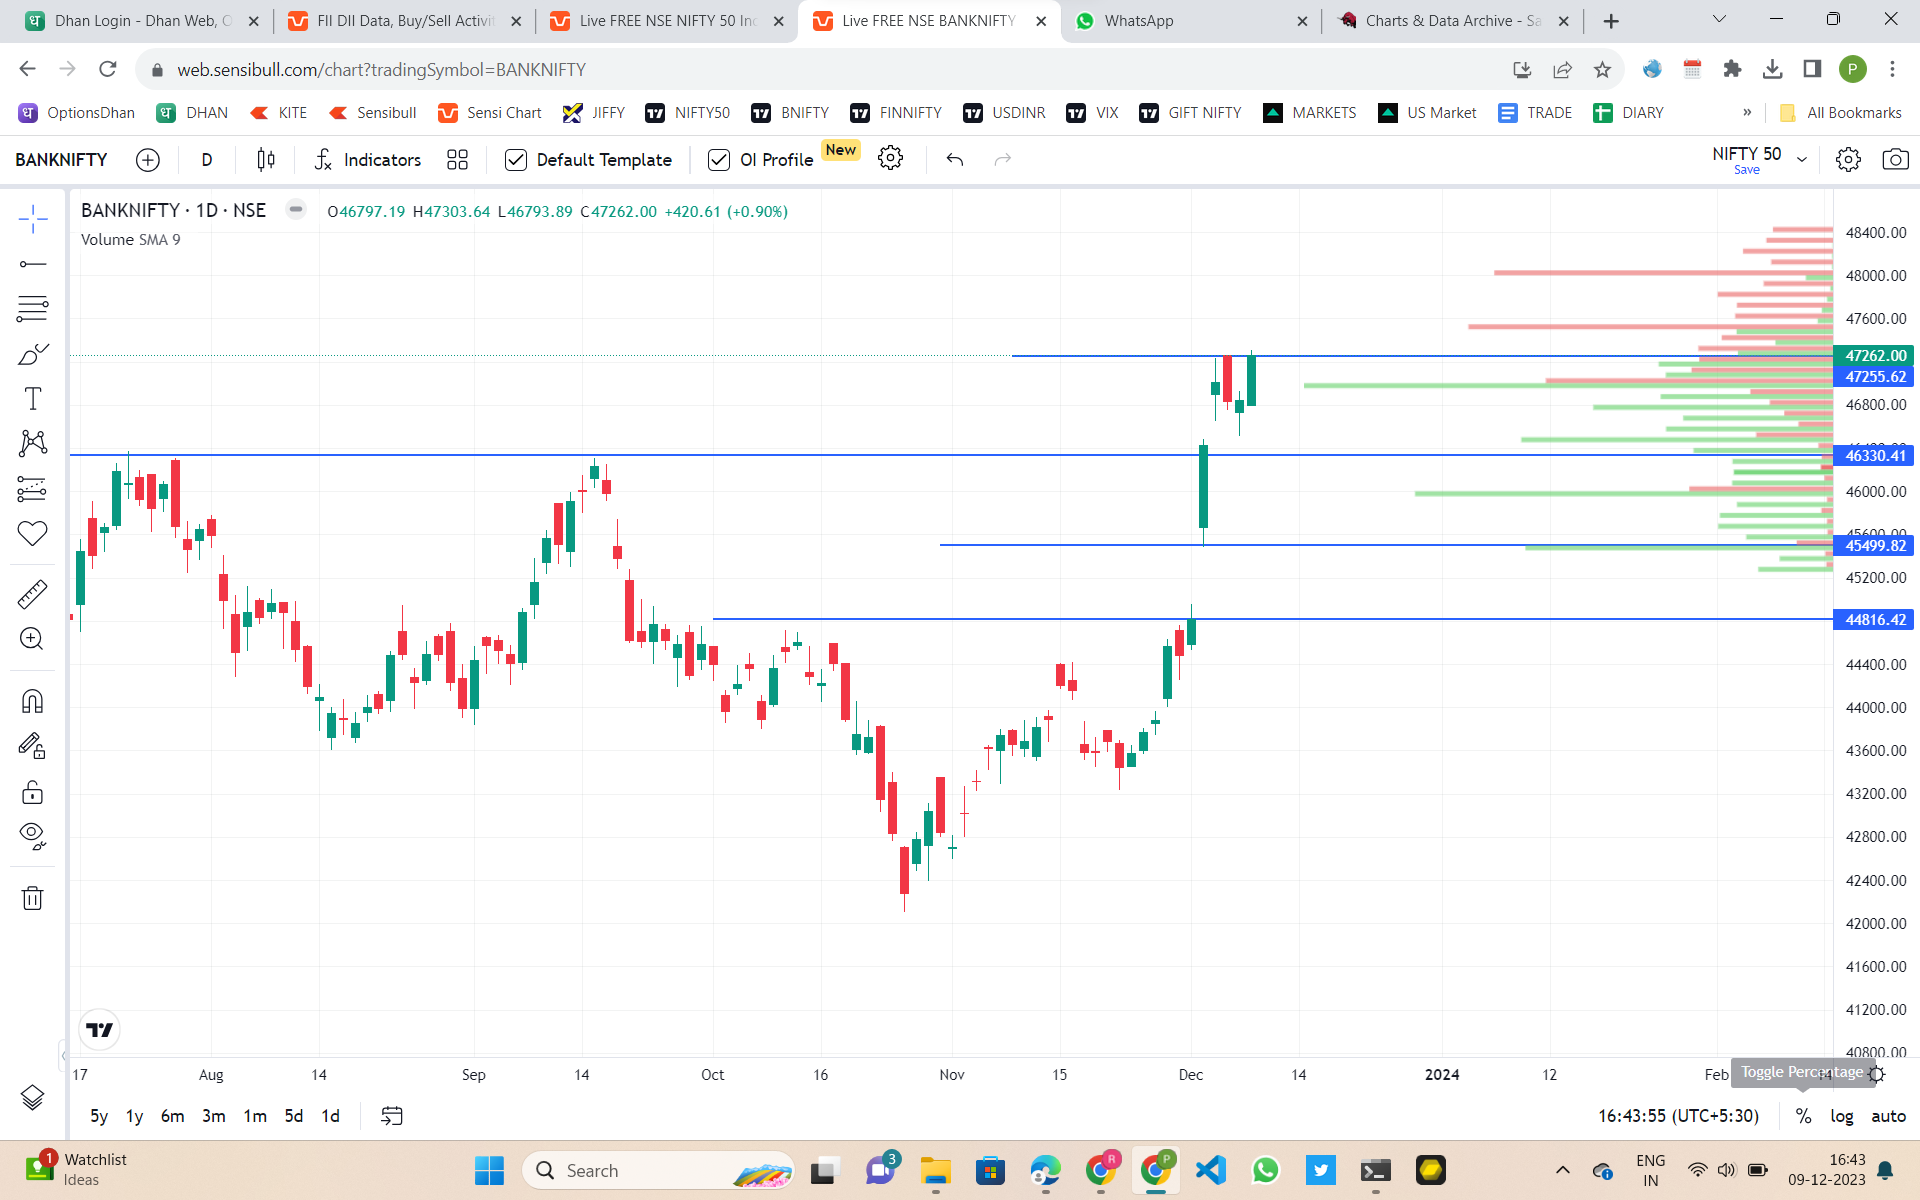
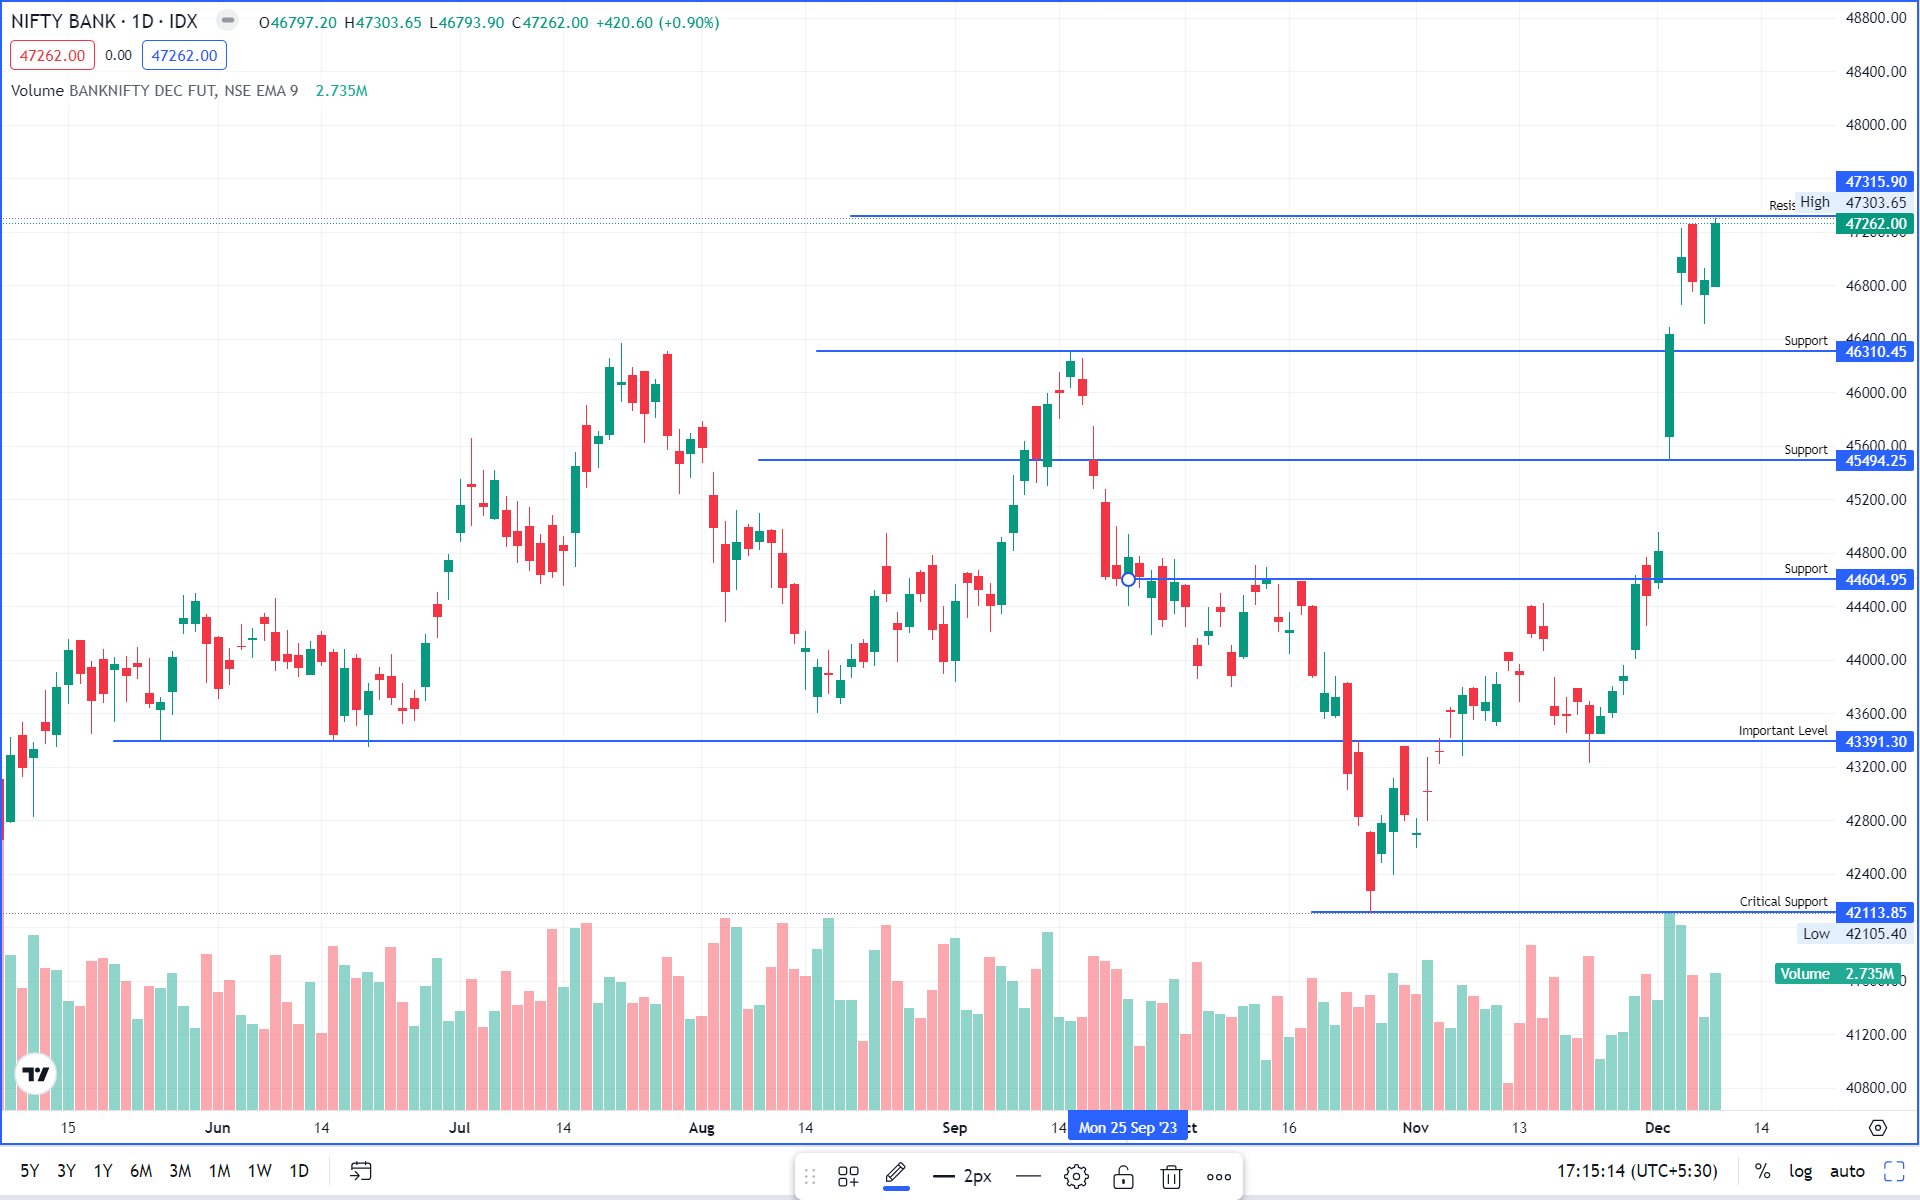
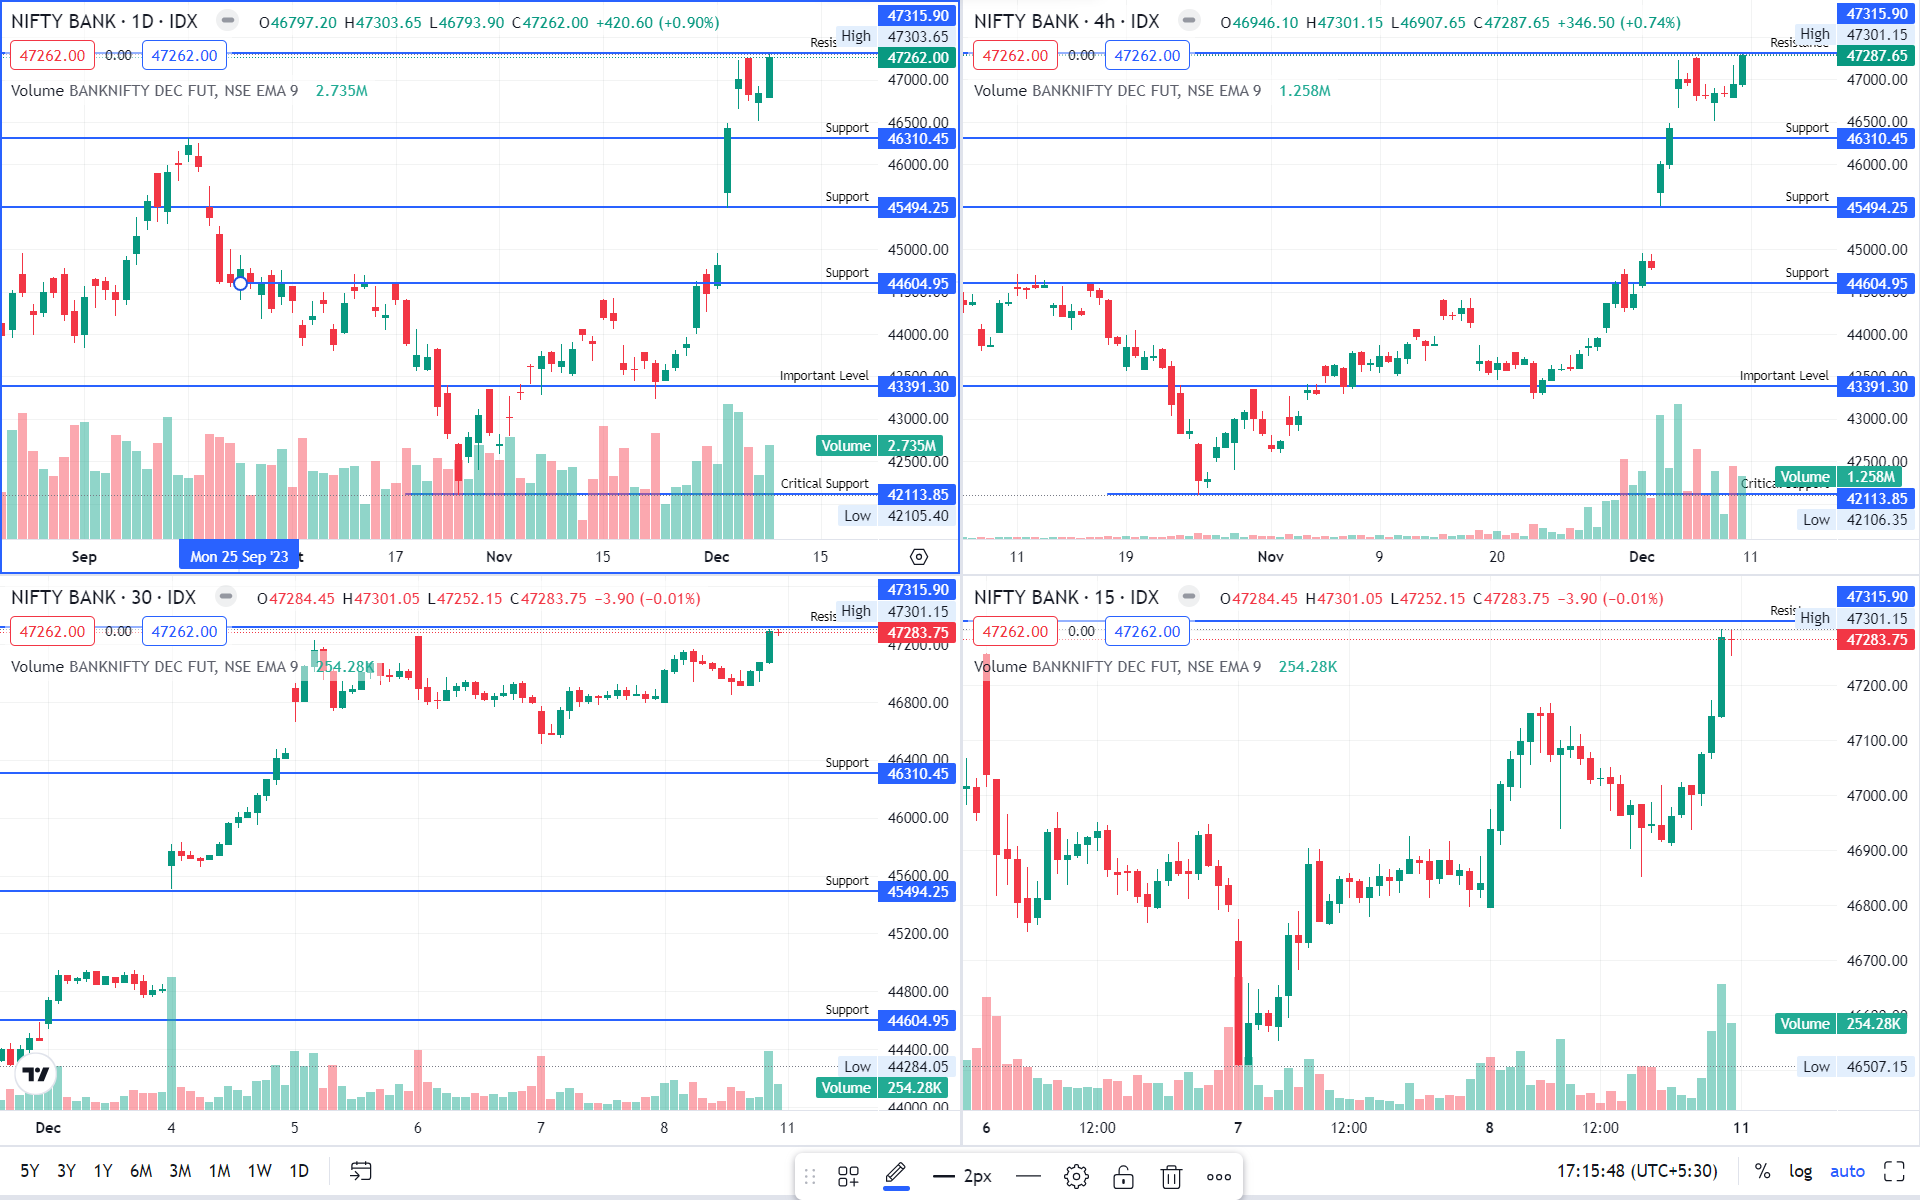
BANKNIFTY
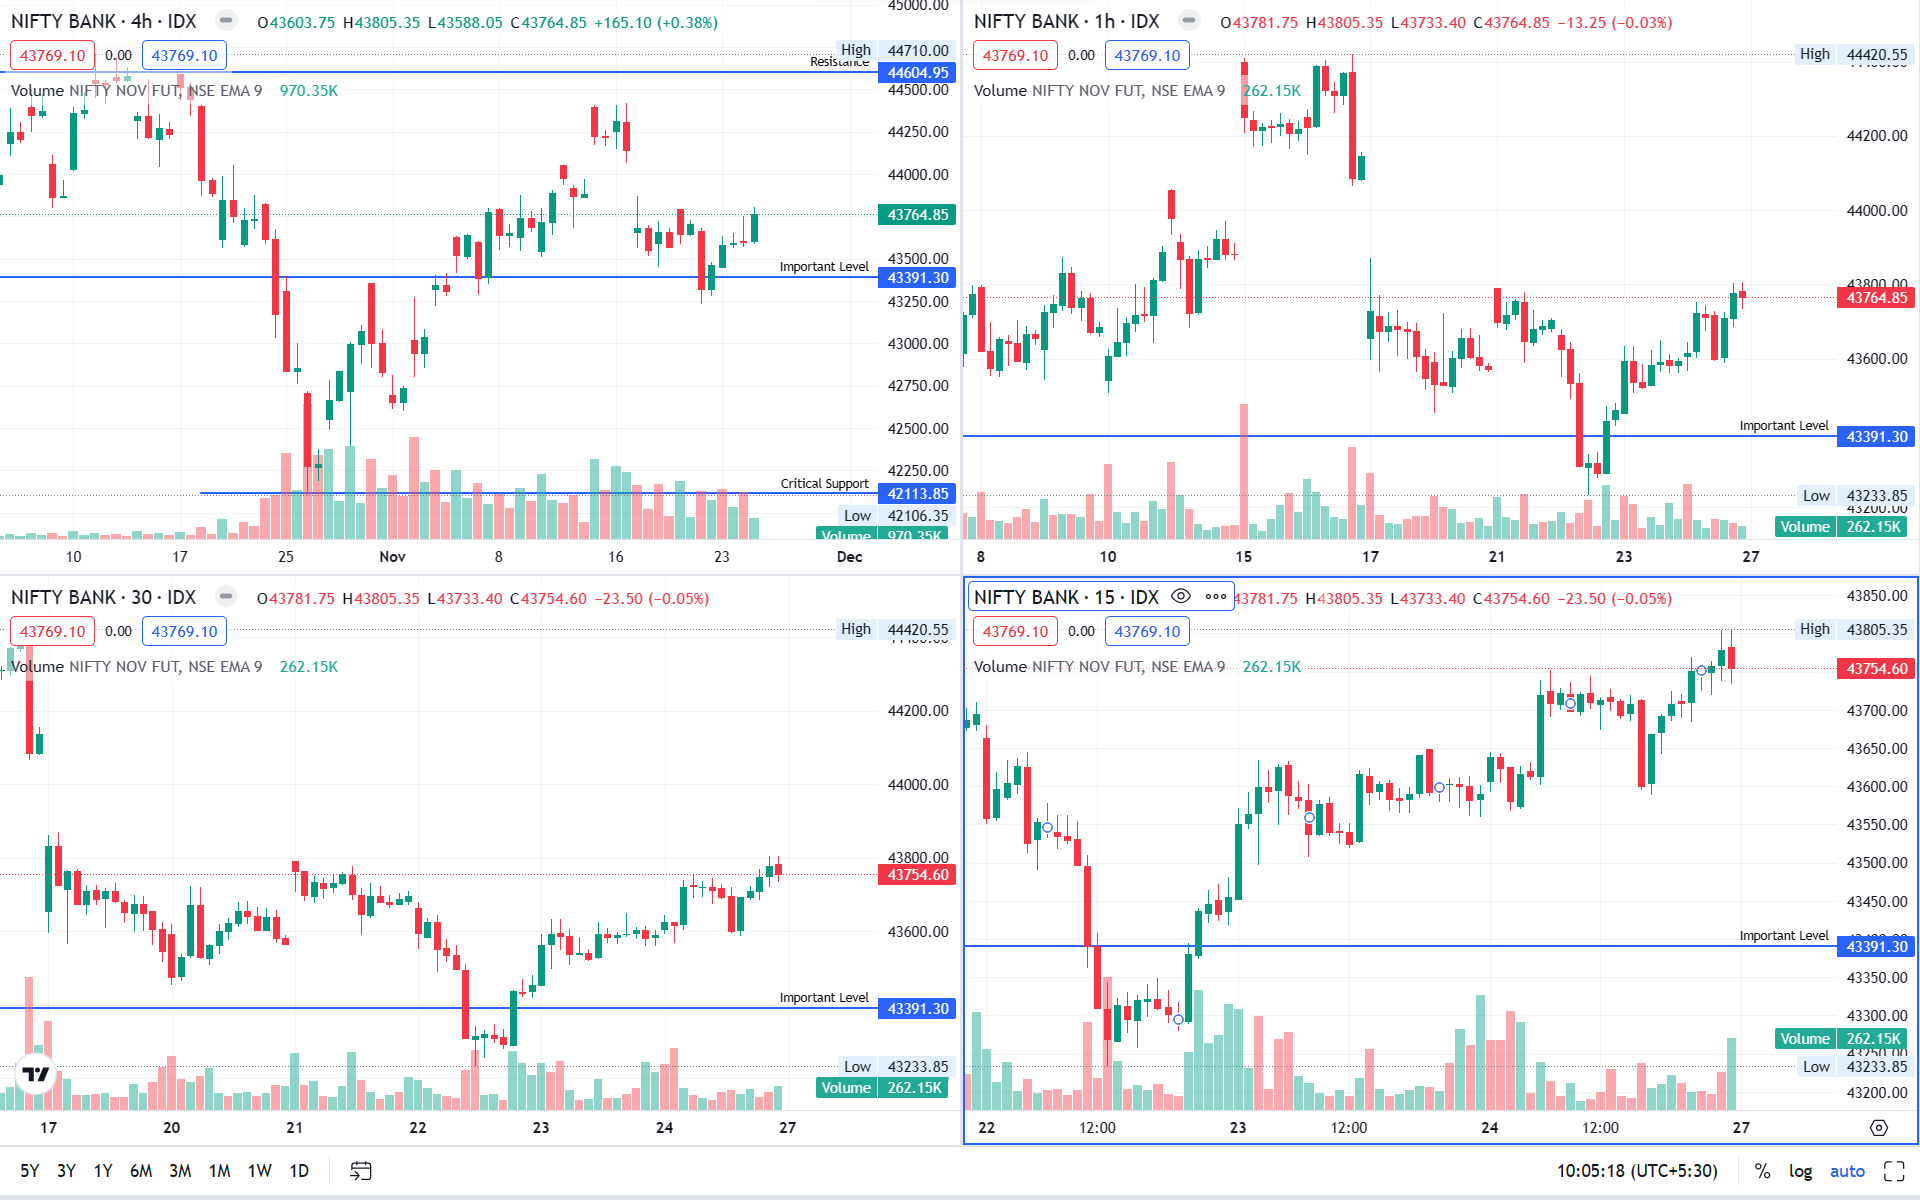
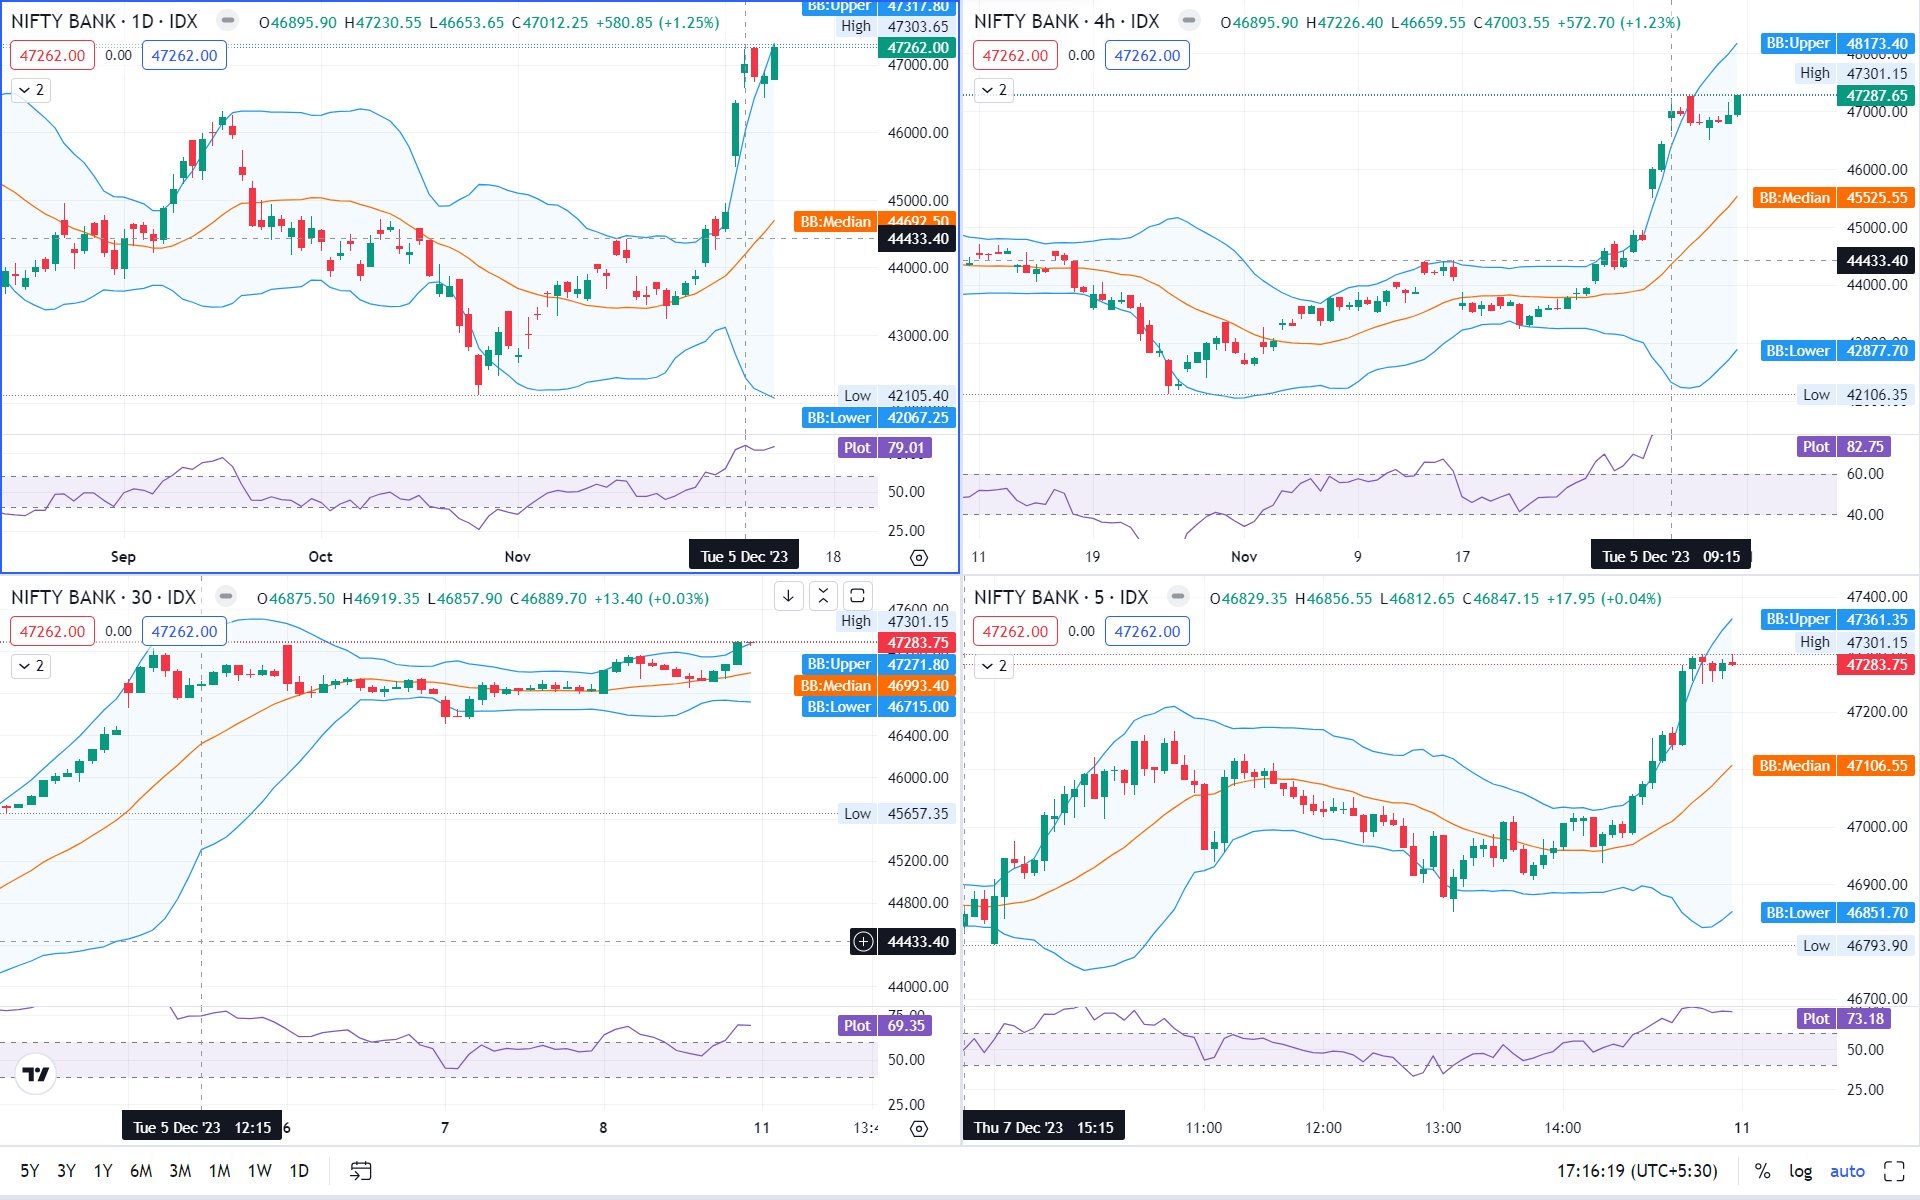
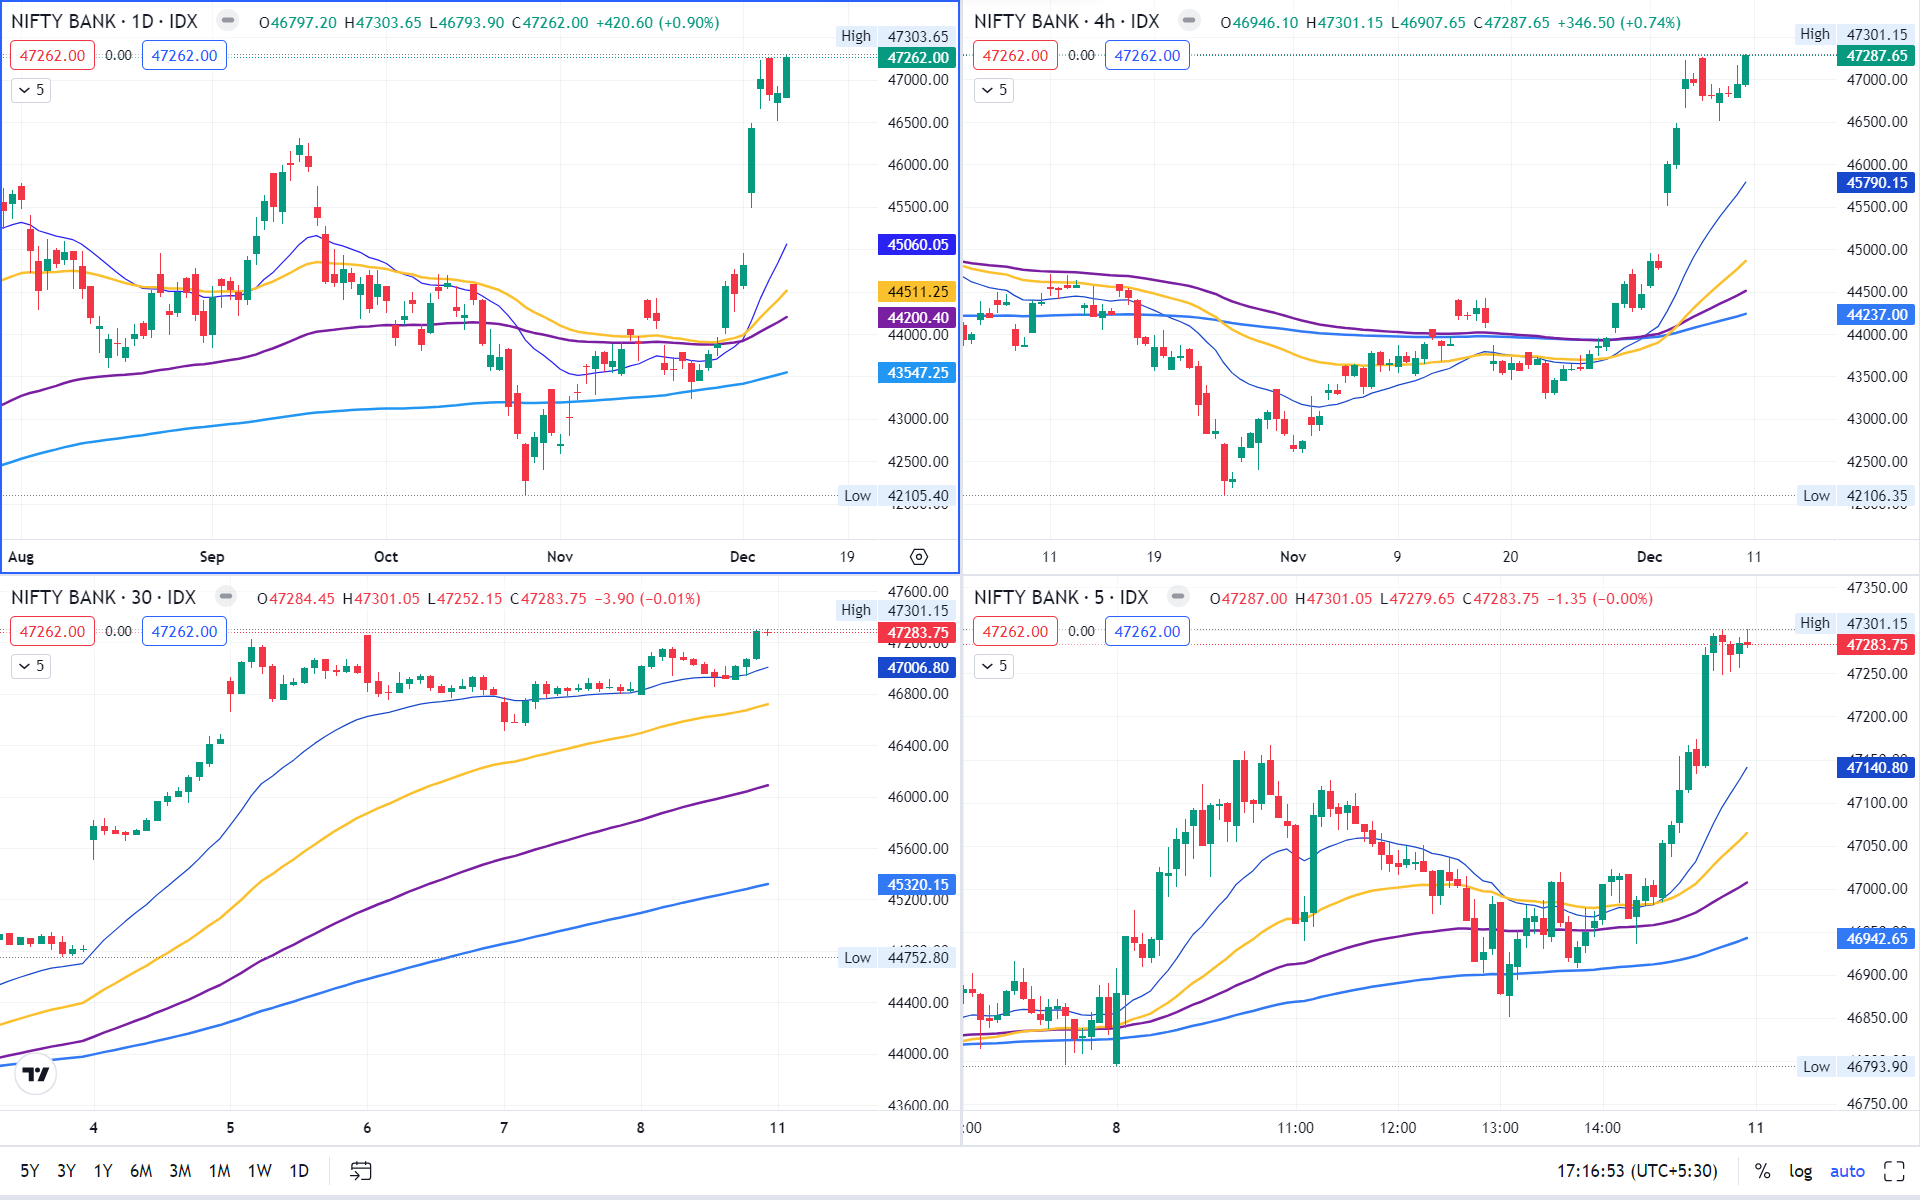
View :
Price action is very bullish.
On daily time frame, there has been a strong buying after a dip. A bullish marubuzzo formed.
And even on a shorter time BANKNIFTY is a buy on dip.
Important Levels
- Resistance – 47,400 – 47,500
- Support – 46,500 – 46,600
- No trading – 46,500 – 46,600