Will The Market Contract Further??
#pixarts.trade , #safebull , Analysis , Educational , Information , Learning
On weekly chart looks bearish, candle without wick, showing weakness. Has it bottomed out? Or its a wait and watch?…[ Read More ]…
Our view about last expiry:
NIFTY 50
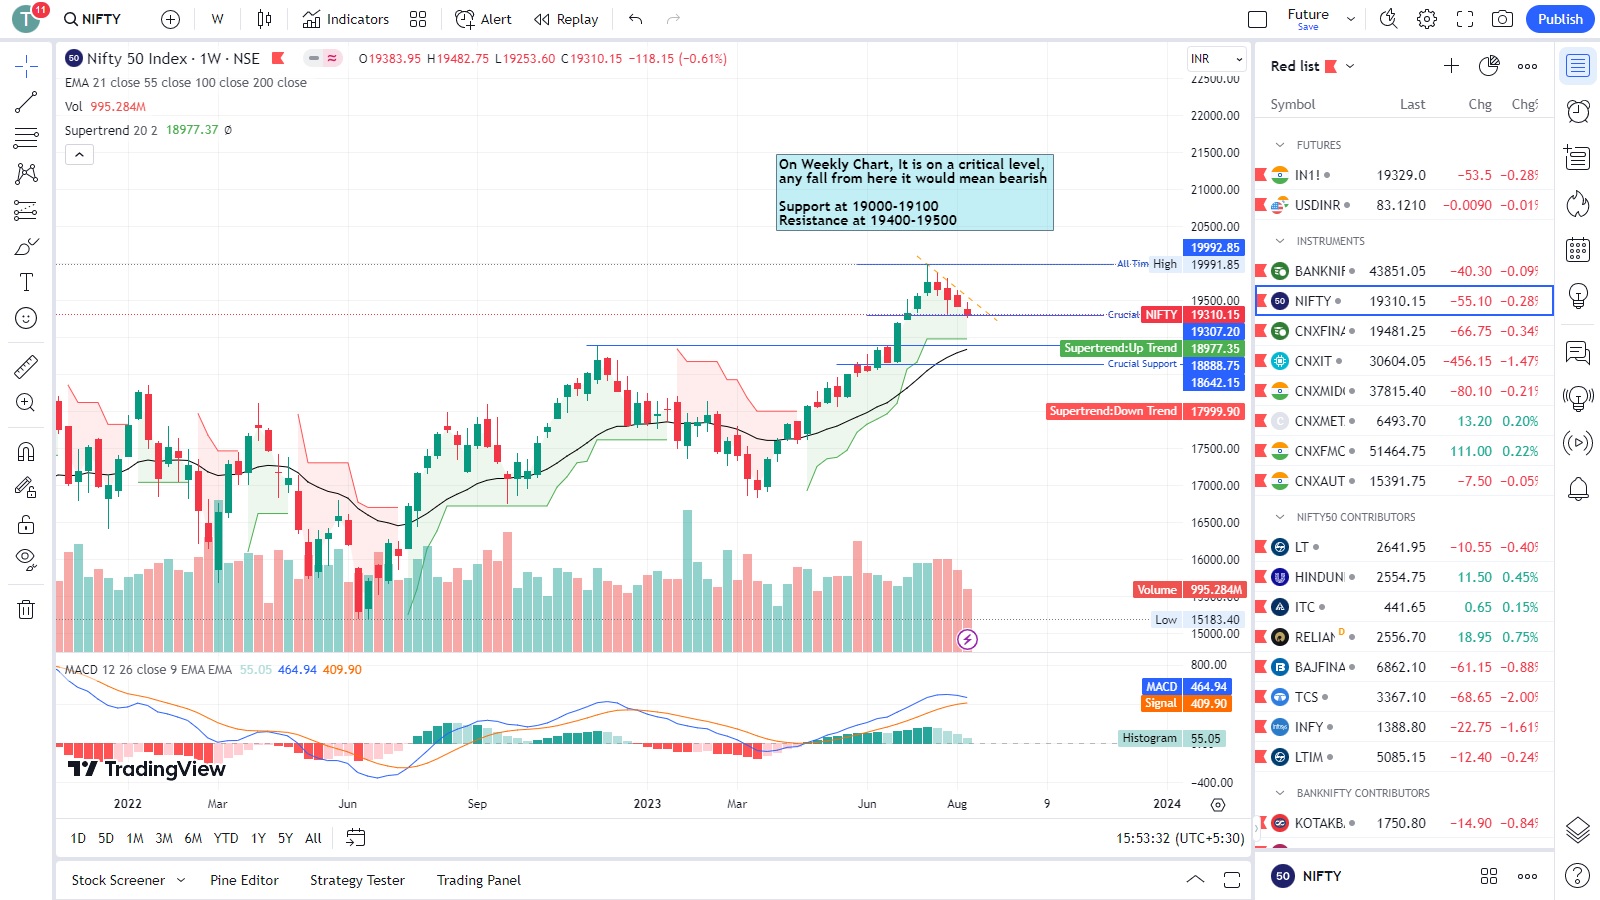
On weekly chart looks bearish, candle without wick, showing weakness. Has it bottomed out? Or its a wait and watch?
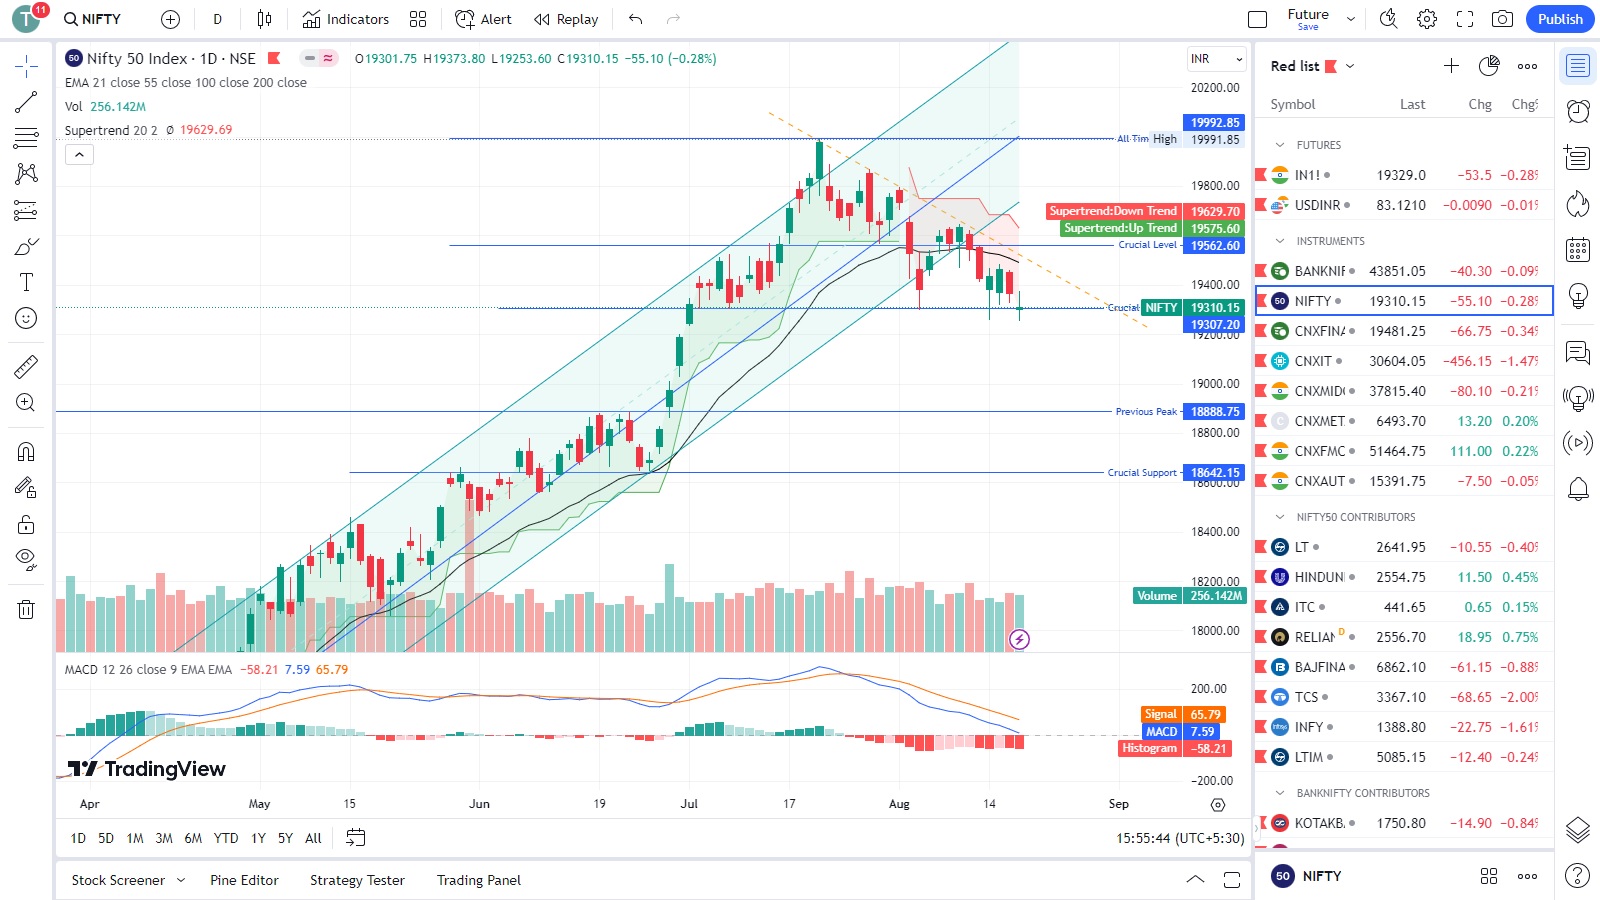
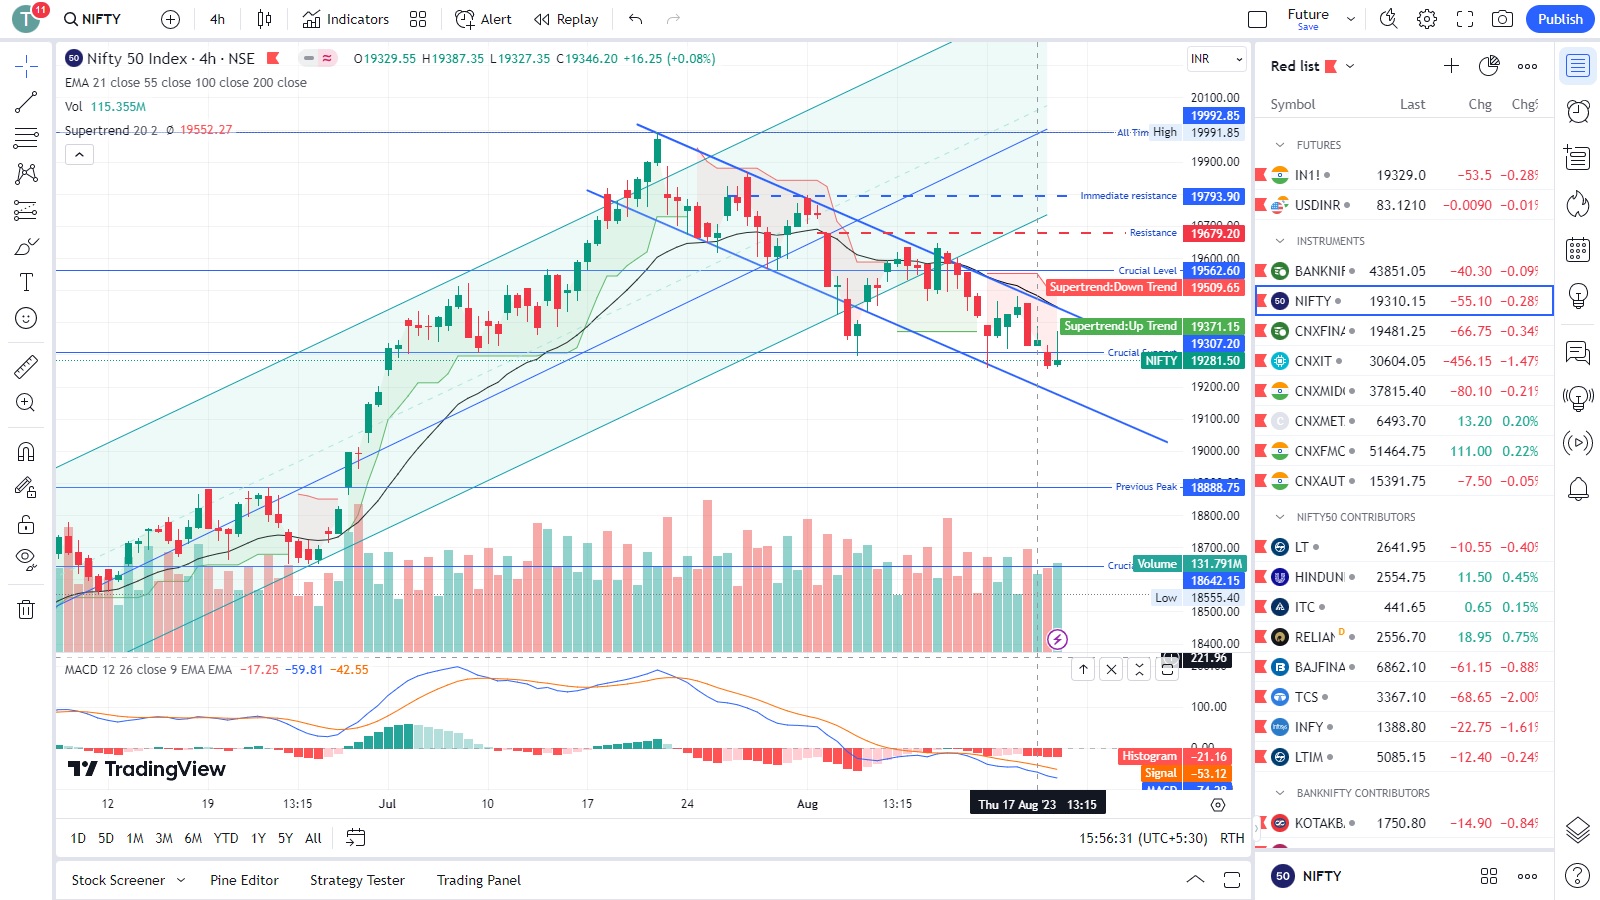
Daily chart continued forming new lower lows, and taking rejections from a trend line. Bearish outlook.
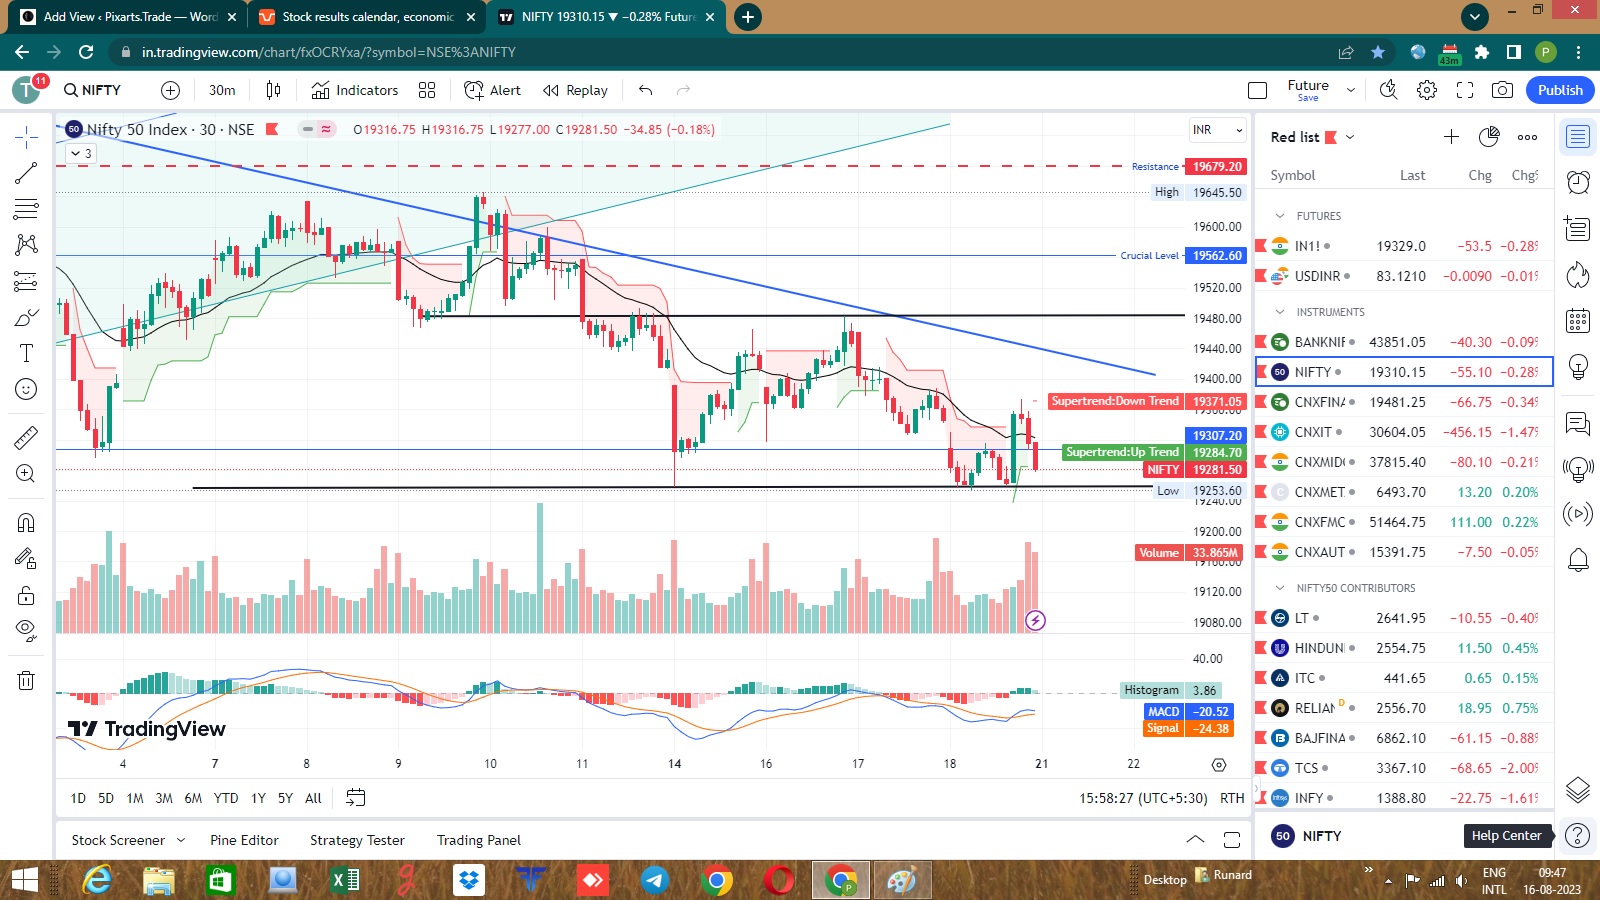
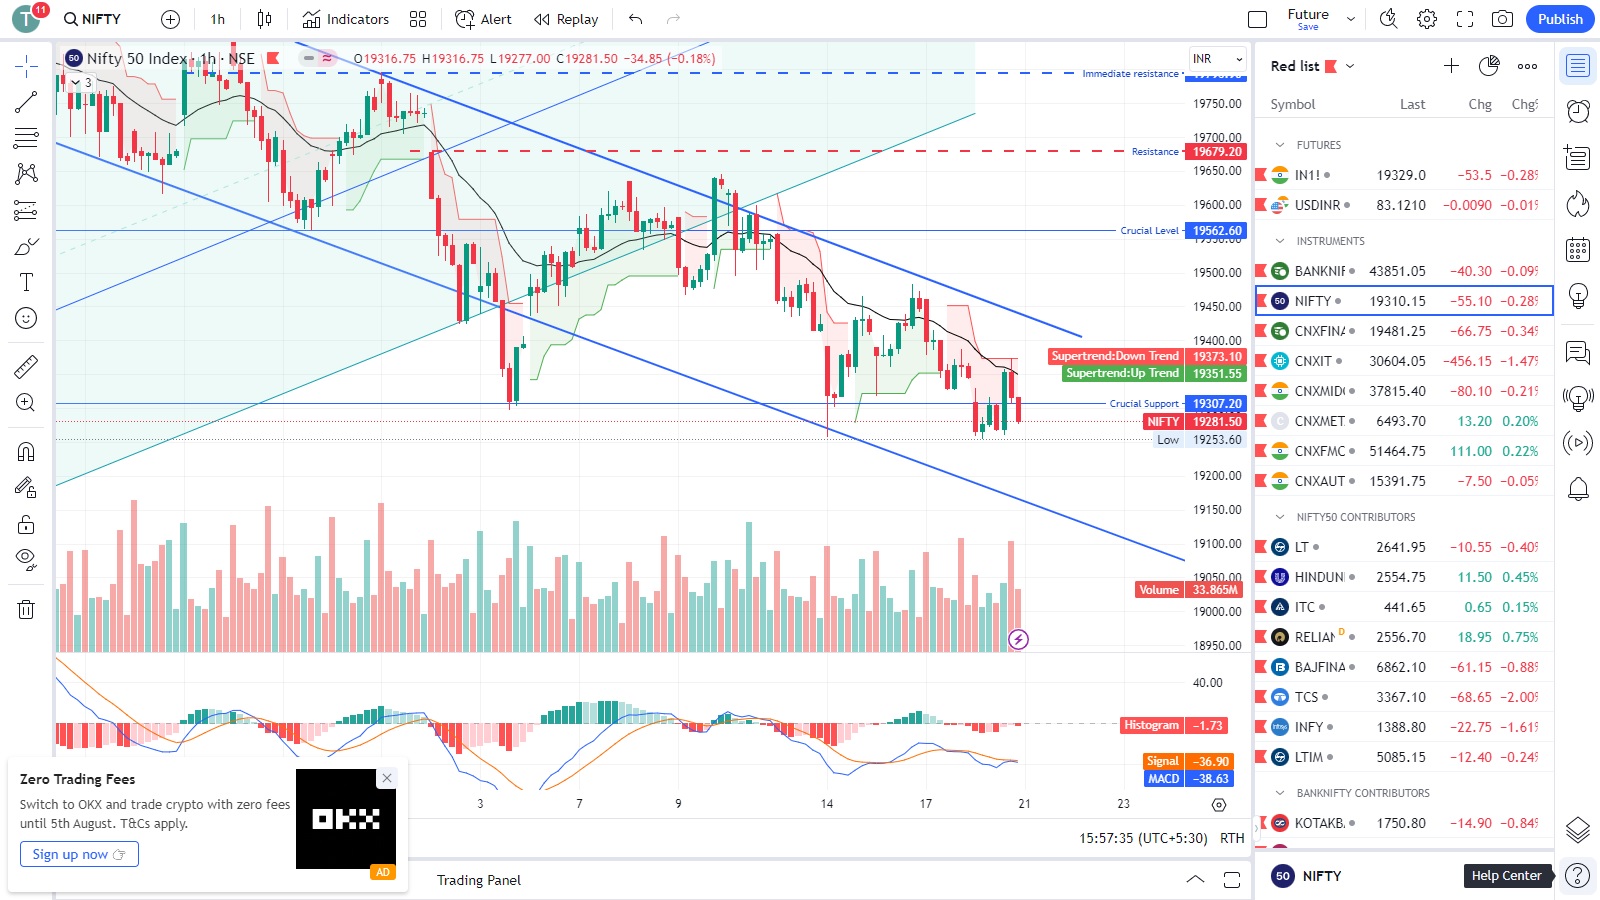
On the hourly chart of NIFTY 50, no signs of support or recovery, if 19300 is breached further fall is expected.
RISK DISCLOSURE!!!
- 9 out of 10 individual traders in equity Futures and Options Segment, incurred net losses.
- On an average, loss makers registered net trading loss close to ₹ 50,000.
- Over and above the net trading losses incurred, loss makers expended an additional 28% of net trading losses as transaction costs.
- Those making net trading profits, incurred between 15% to 50% of such profits as transaction cost.
BANKNIFTY
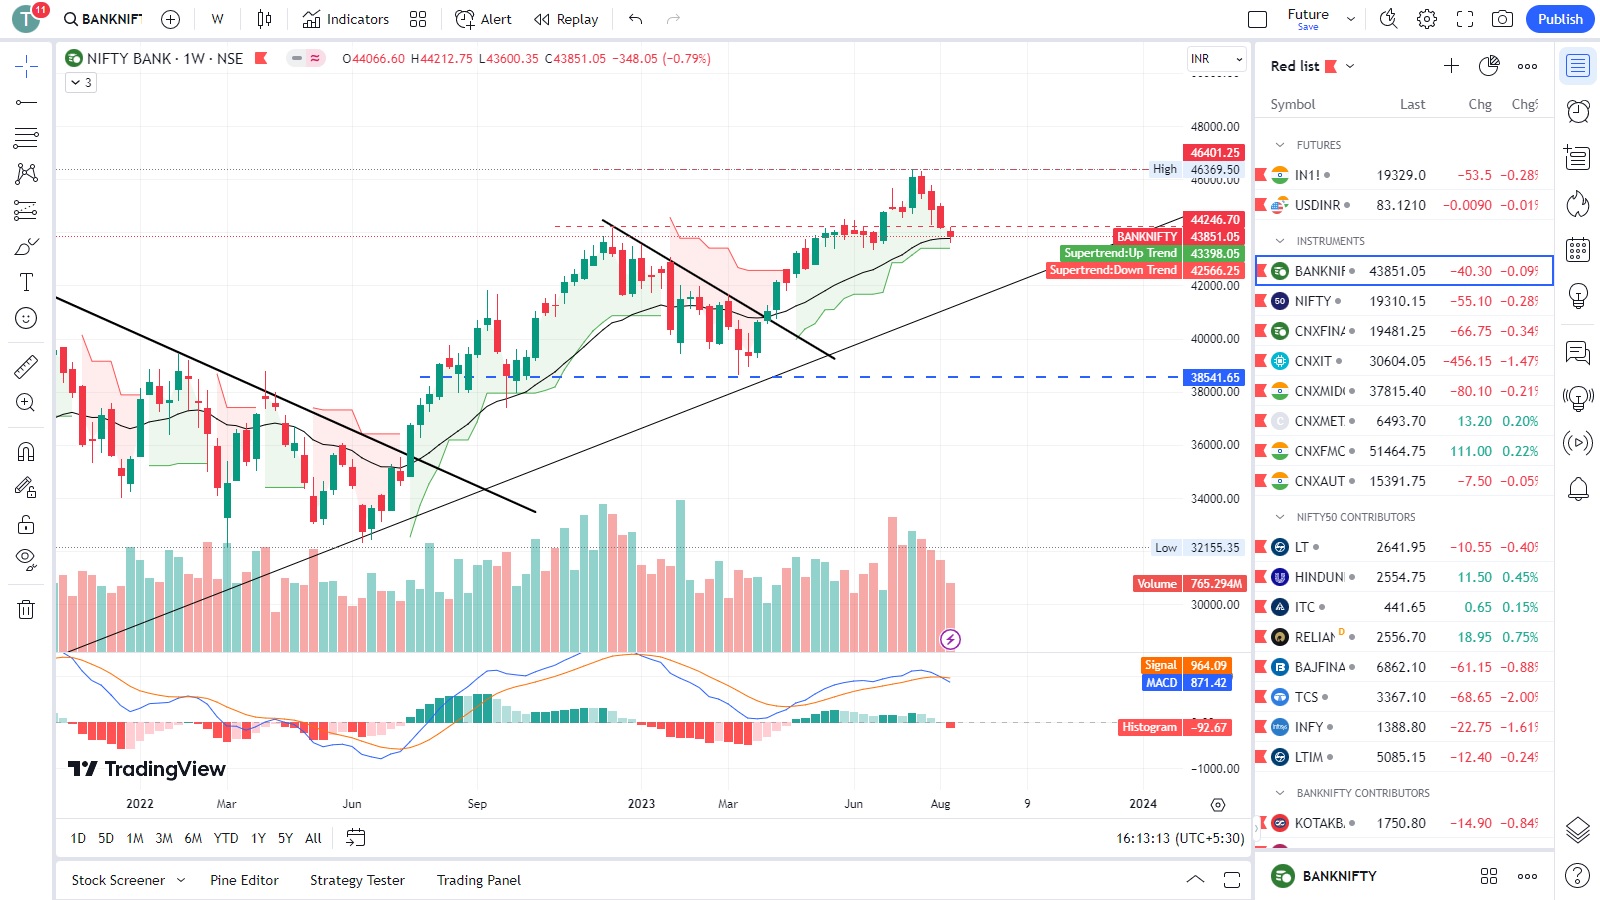
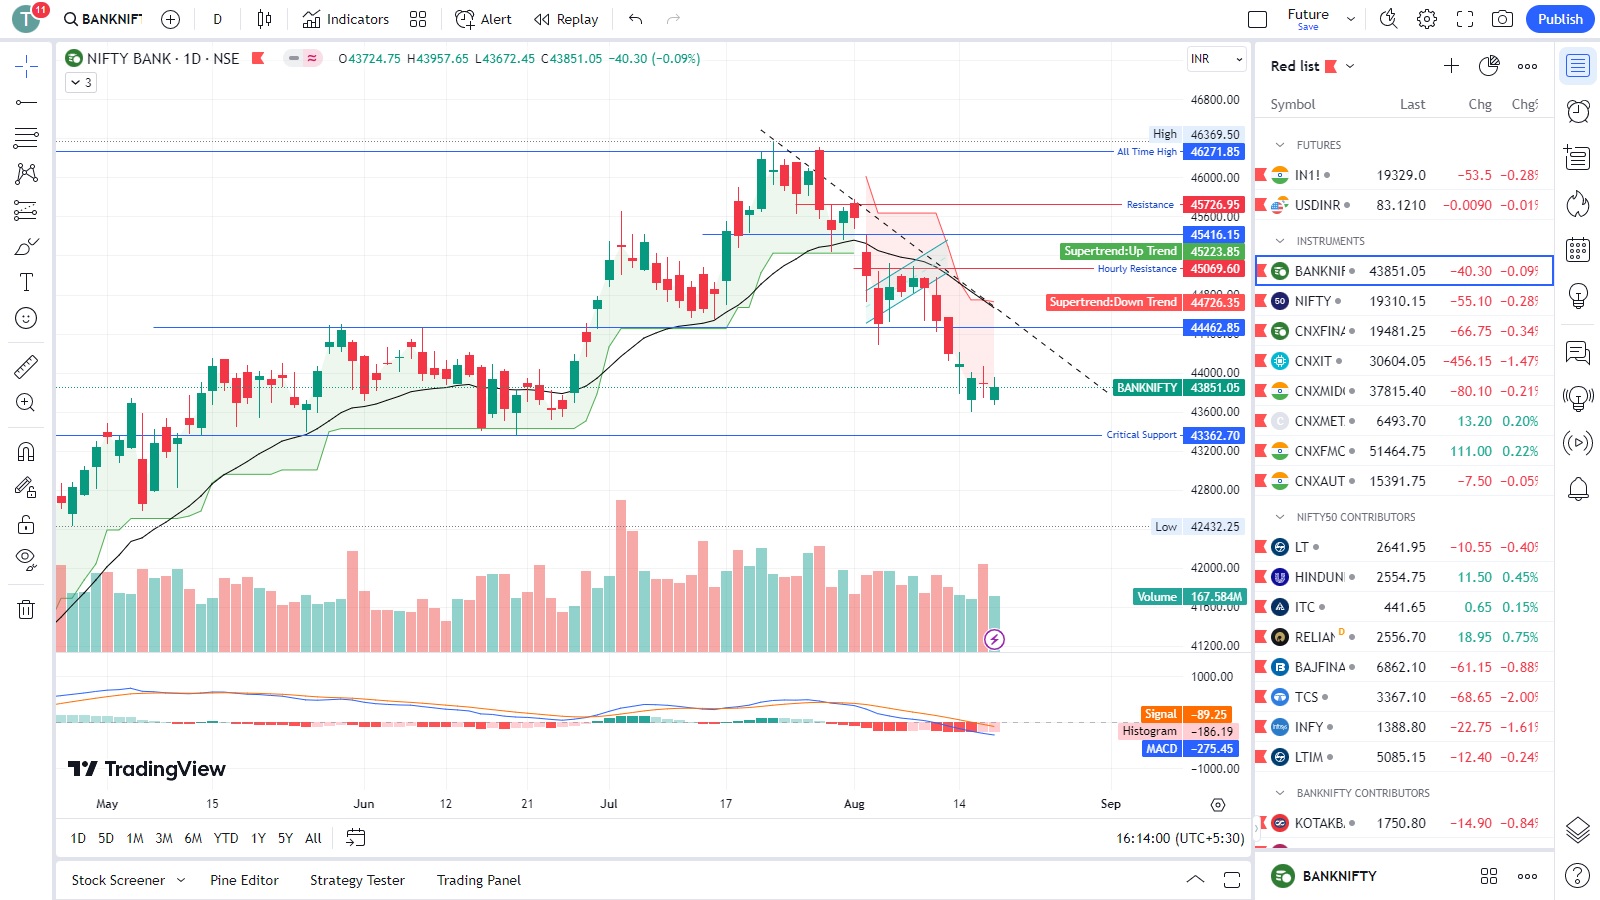
On weekly chart, BANKNIFTY exhibits bearishness, showing no signs of strength. More fall is expected? let’s wait and watch.
Daily chart shows weakness, and fall till 43400 range has opened up.
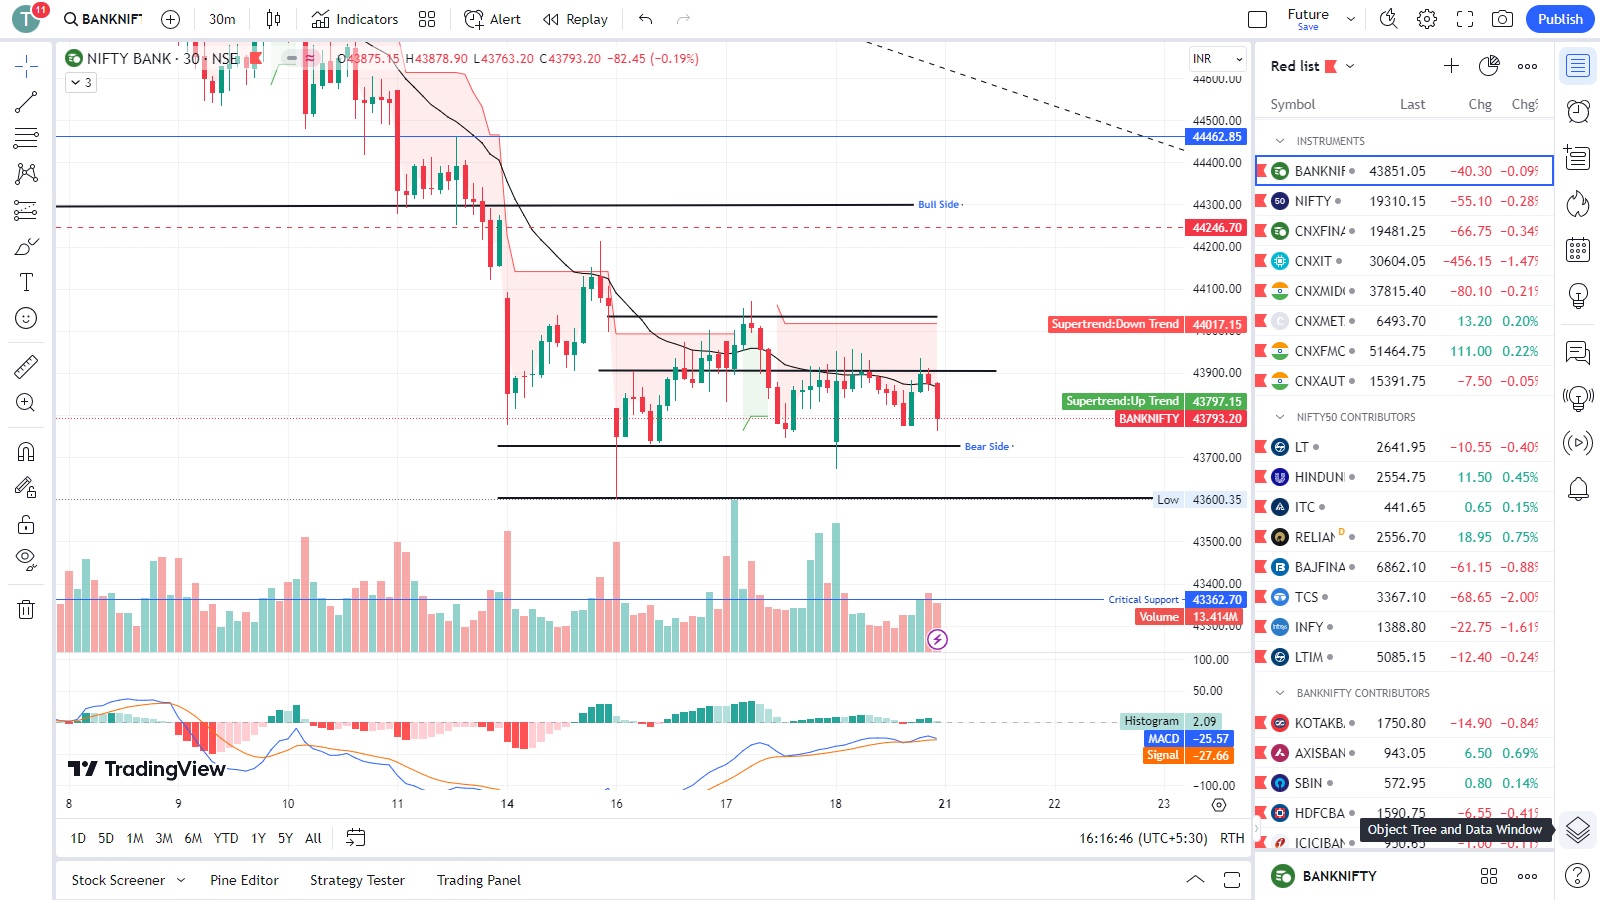
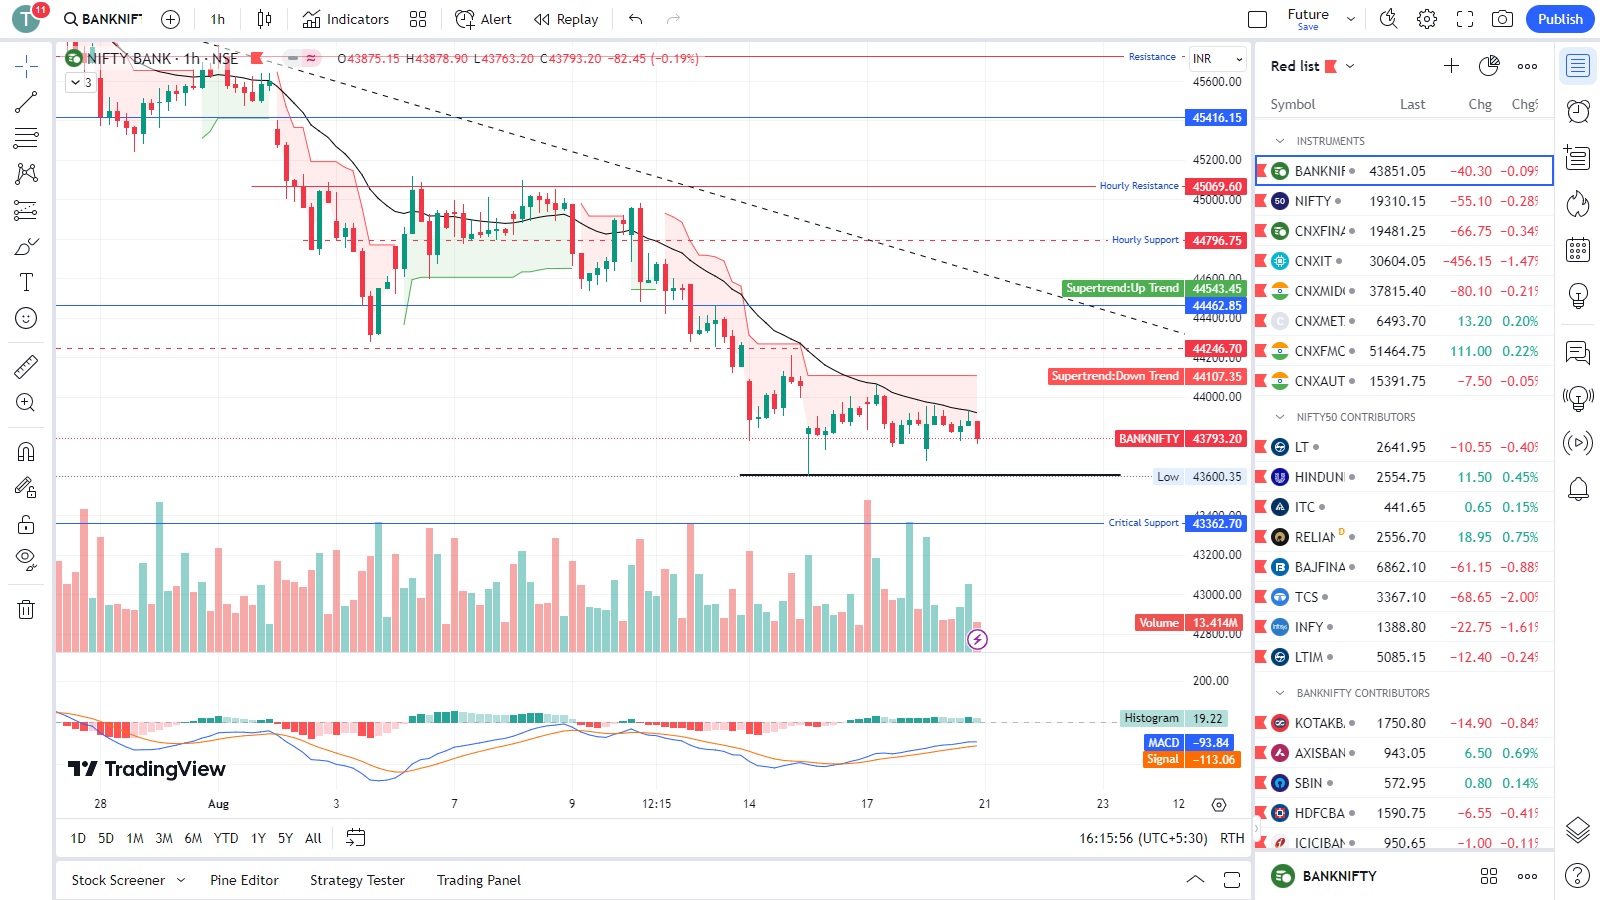
On hourly chart of BANKNIFTY too no signs of strength, wait for price action and every rise could be a sell right now.
How the Market traded – The market contracts
NIFTY continued its selling trend, and however for the last 3 sessions, it has some how held onto 19300 level.
BANKNIFTY too continued its bearish trend but somehow held onto 43800 level.
……
What does the technical say about next week, Will the market contract some more?
NIFTY 50
Another bearish week, now 4 consecutive weeks closed in red. And clearly a trend line resistance was respected. Now it will be interesting to see if the trend continues.
On daily chart, a DOJI is formed at the critical support 19300. Let’s see if it can sustain above it in upcoming days. Beyond these there could be strong selling if it fails.
On the hourly chart of NIFTY 50, no signs of strength in NIFTY. Market is expected to remain volatile in coming days.
Important Levels:
- Resistance – 19400 – 19500
- Support – 19200 -19300
- No trading Zone – 19300 – 19400
BANKNIFTY
On weekly chart, no signs of strength in BANKNIFTY. And 4 consecutive weeks closed in red. If level 43500 is not protected we might see further down fall.
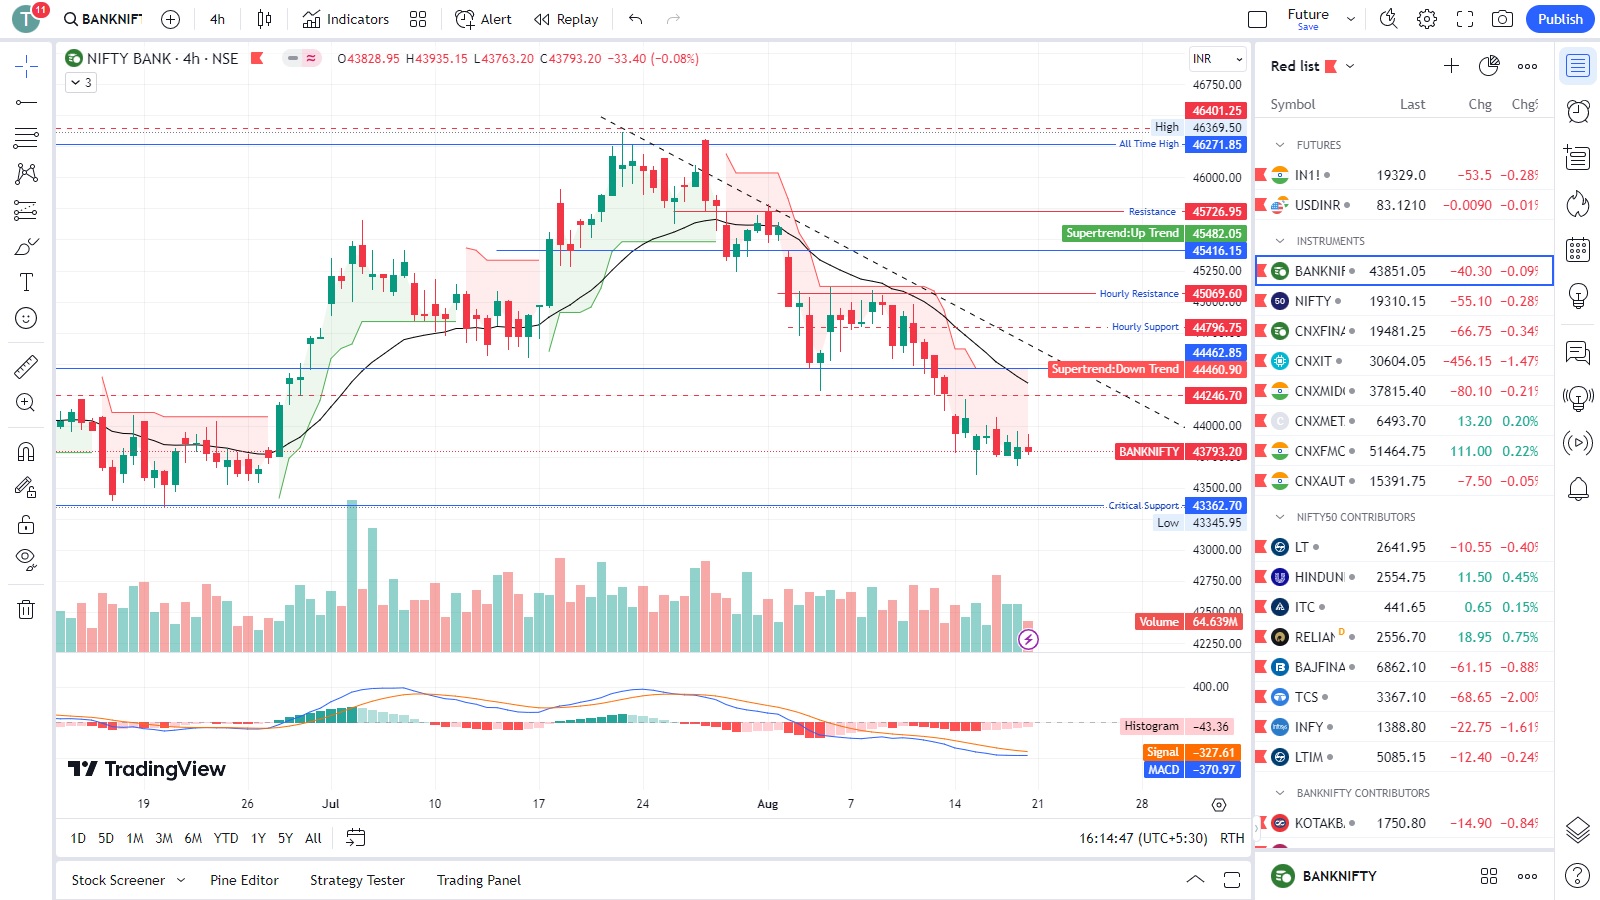
Daily chart shows some strength near 43700 level, and formed an inside candle. Now its a wait and watch game.
BANKNIFTY Looks strong on hourly chart and it is forming a base. Is It the bottom?
Important Levels:
- Resistance – 44000 – 44100
- Support – 43600 – 43700
- No trading Zone – 43800 – 44000.
……
What does Data say, Will the market Contract?
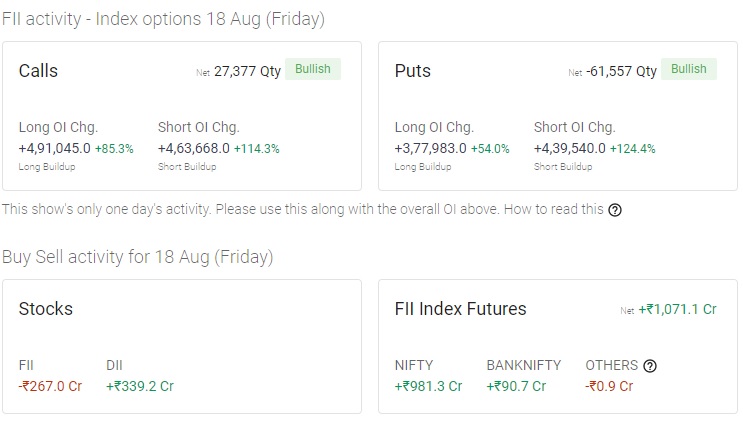
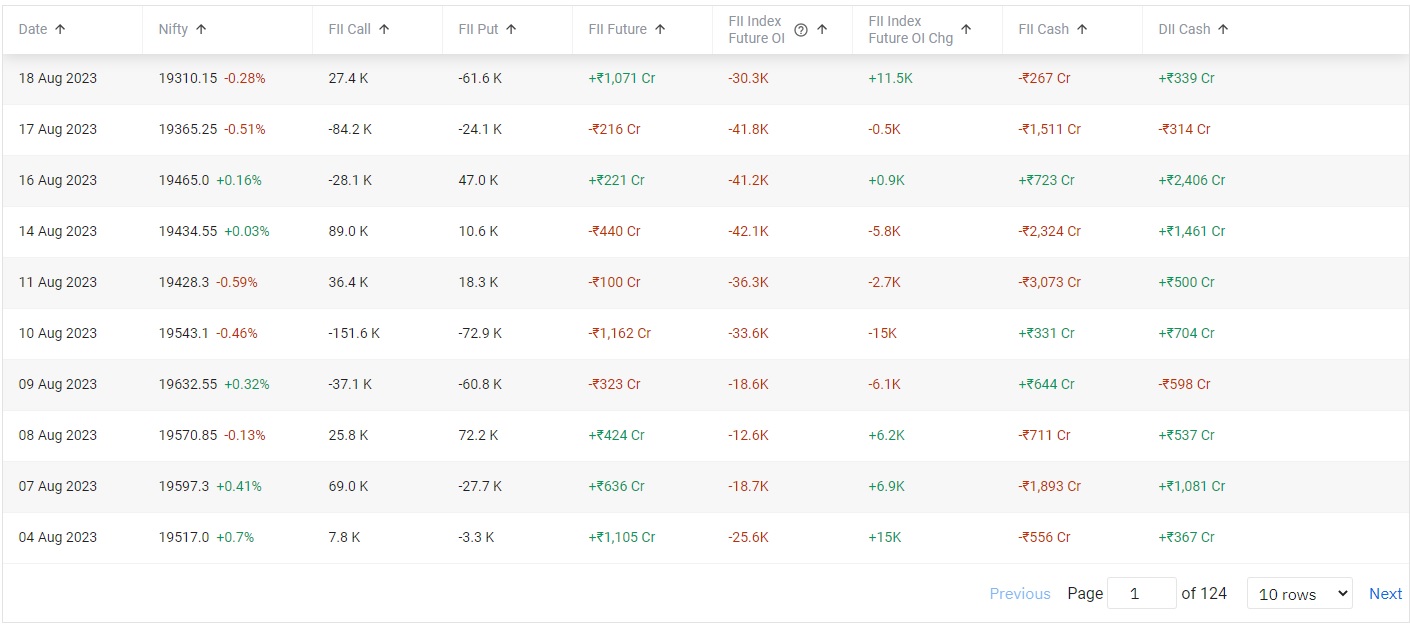
FII & DII Activity
- FII Cash :: ▼ -₹267.0 Cr
- FII Futures :: ▲ +₹1,071.1 Cr
- DII Cash :: ▲ +₹339.2 Cr
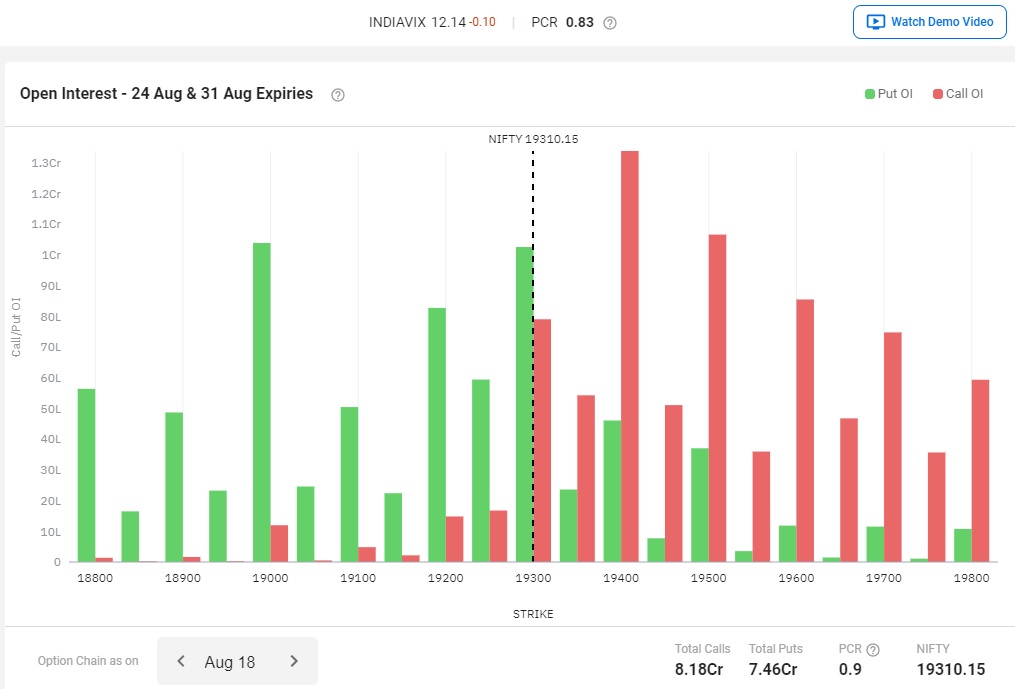
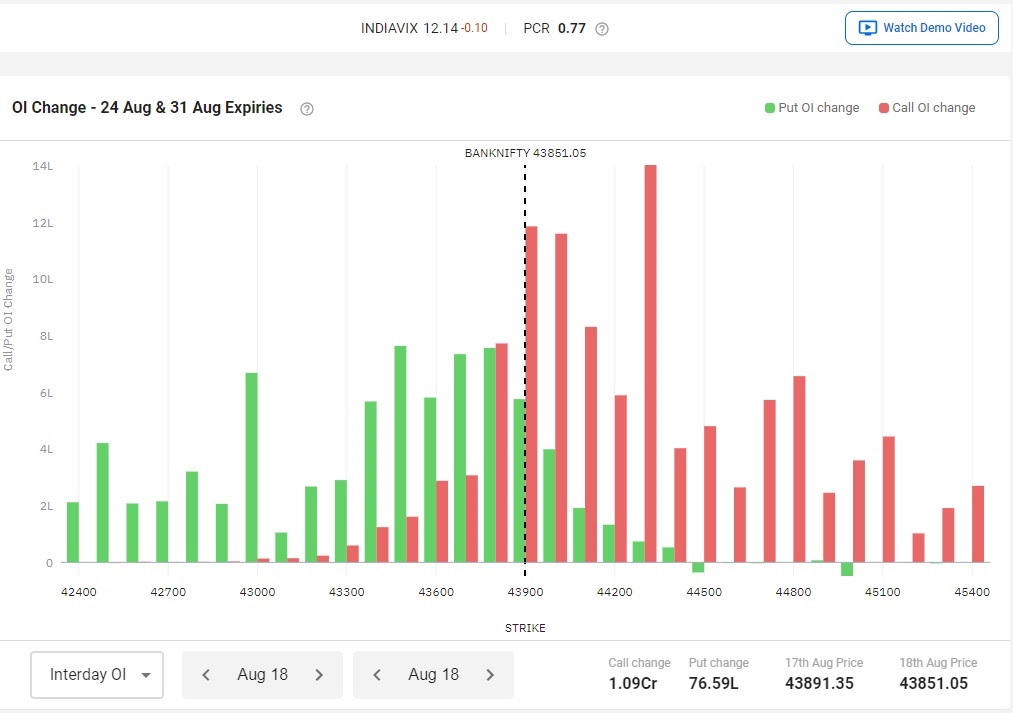
Open Interest (OI)-
Max OI Calls:: 19400 , 1.34 Cr
Max OI Puts:: 19000 & 19300 , 1.04 Cr Each
Note:: OI suggests key resistance at 19400 & support at 19000 & 19300
** Datas are only for NIFTY 50
PCR – 0.9 (-/+) Flat to Bullish
……
Market Sentiments
World Markets – World market traded NEGATIVE, closed mostly negative.
GIFT NIFTY FUTURES – Closed around 19329.5 at 01:15am 18-08-2023
Events Upcoming
- 23 Aug Wed 07:30 PM New Home Sales JUL USA 0.697M
- 31 Aug Thu 05:30 PM GDP Growth Rate YoY Q2 India 6.10%
- 01 Sep Fri 07:15 AM Caixin Manufacturing PMI AUG China 49.2
- 01 Sep Fri 06:00 PM Non Farm Payrolls AUG USA 187K
…..
Summary
1. Technical
NIFTY – Another bearish week, now 4 consecutive weeks closed in red. And clearly a trend line resistance was respected. Now it will be interesting to see if the trend continues. On daily chart, a DOJI is formed at the critical support 19300. Let’s see if it can sustain above it in upcoming days. Beyond these there could be strong selling if it fails. On the hourly chart of NIFTY 50, no signs of strength in NIFTY. Market is expected to remain volatile in coming days.
Important Levels:-
- Resistance – 19400 – 19500
- Support – 19200 -19300
BANKNIFTY – On weekly chart, no signs of strength in BANKNIFTY. And 4 consecutive weeks closed in red. If level 43500 is not protected we might see further down fall. Daily chart shows some strength near 43700 level, and formed an inside candle. Now its a wait and watch game. BANKNIFTY Looks strong on hourly chart and it is forming a base. Is It the bottom?
Important Levels:-
- Resistance – 44000 – 44100
- Support – 43600 – 43700
2. World Markets – Mostly NEGATIVE and closed in RED.
3. FII – Negligible but Positive
4. DII – Positive
5. OI – Flat to Bullish
6. PCR – 0.9, No clear direction.
7. GIFT NIFTY – Negative
8. VIX – 12.25
NOTEWORTHY:-
Points to remember on this upcoming week:-
- Bigger Trend is Bearish for now.
- BANKNIFTY is forming a base near 43600-43700
- BANKNIFTY looks convincing for Bullish trade if at all there are signs of bullishness.
Things to avoid:-
- Avoid aggressive buying or selling for now.
- Buy debit spreads to gain VEGA on fall.
- Avoid unnecessary risk now, it can go either way.
……
Researched, Analyzed & Drafted by :- Pixarts.Trade #safebull
CHECK OUT THESE POSTS!!…
- “Squeezing Maximum Profit by Trailing”
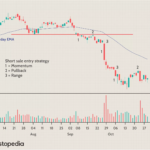 Marked important levels in BANKNIFTY using Price Action and Market Profile in Gocharting.
 - “Trailing Stop Loss, a way forward”
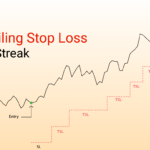 Initial trade in FINNIFTY stop loss got triggered then re-entered again, with defined risk, and trailed the trade to avoid getting loss and to close the day in green.
 - “Some move today in Indian Indices”
 “Could not capitalize much as system trailing stop loss got triggered, next time better to trail manually- a valuable lesson learned.”
 - ” All about today, the trades, and the win”
 Market opened flat as expected, and rallied some more points, allowing an exit for the put short due to short covering. Booked some profit.
 - “Wonderful Day & All well executed Trades”
 SHILLONG :: Following up with the trend since morning, VWAP in 15mins candle have dipped and Cumulative Delta divergence observed after 1st 15-mins candle(green) with negative Delta.
The above analysis is solely the opinion of the author, no way an assured tips/direction to trade, they are solely for educational purposes. Please do not trade with out a proper study and analysis, we will not be responsible for your loss. We are not SEBI registered.
#SafeBull, #pixarts.Trade