Weekly View – Expiry 4th May 2023
#safebull , Analysis , Educational , Information , Learning , Market
There has been a continuous bull run for the last 5 sessions that posted a growth of 421 pts, hence some correction/pause is expected if it has to continue its bull run, and on daily basis till May 3rd, being FED Rate Hike outcome, therefore likely a pause or flattish market is expected till the decision is made public by US FED…[ Read More ]…
The Broader Daily & Weekly view is shared below for this week expiry, on the basis of Technical and Data Analysis.
IMPORTANT ALERT !!!:-
- Read the Disclaimer.
- For intraday follow price action in shorter time frame.
- This just a personal opinion.

Technical Analysis
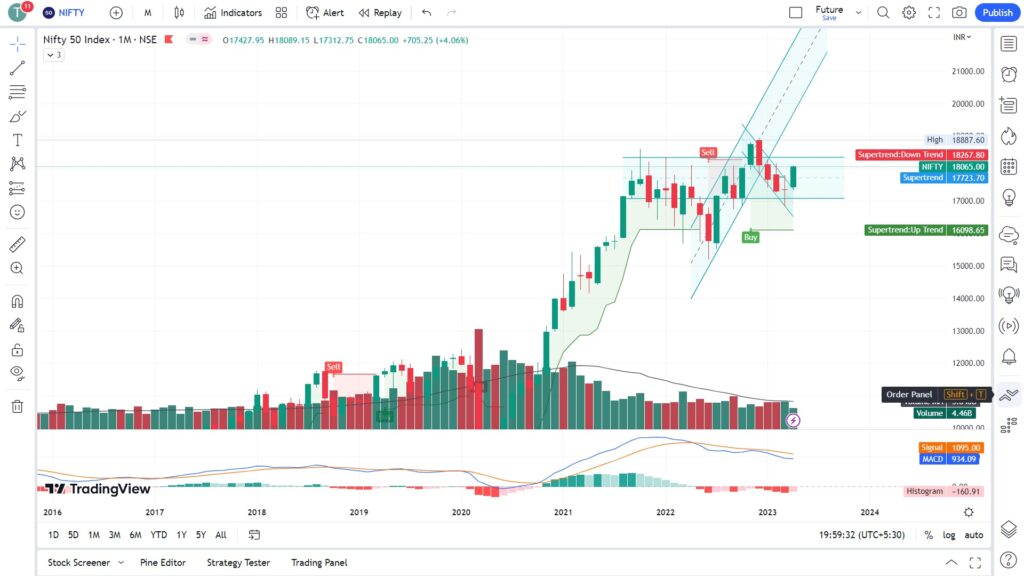
Monthly View- On the monthly chart, it has broken out from the bearish channel and closed very strongly bullish, at the same time Doji is followed by a strong bullish candle, trend reversal confirmed. Refer the Fig. 1
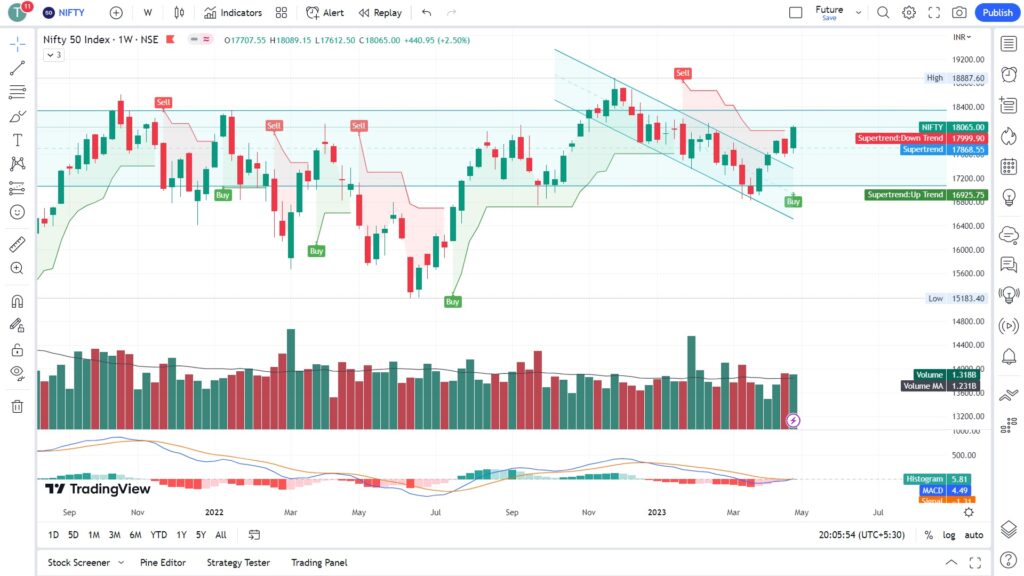
Weekly View- After a bull run for 3 consecutive weeks and healthy weekly correction, last week posted a strong positive move, price action on the weekly chart is technically a very strong bullish indication, and there are rooms for upward movement till 18200, before it dips for another higher low or correction. Refer the Fig. 2
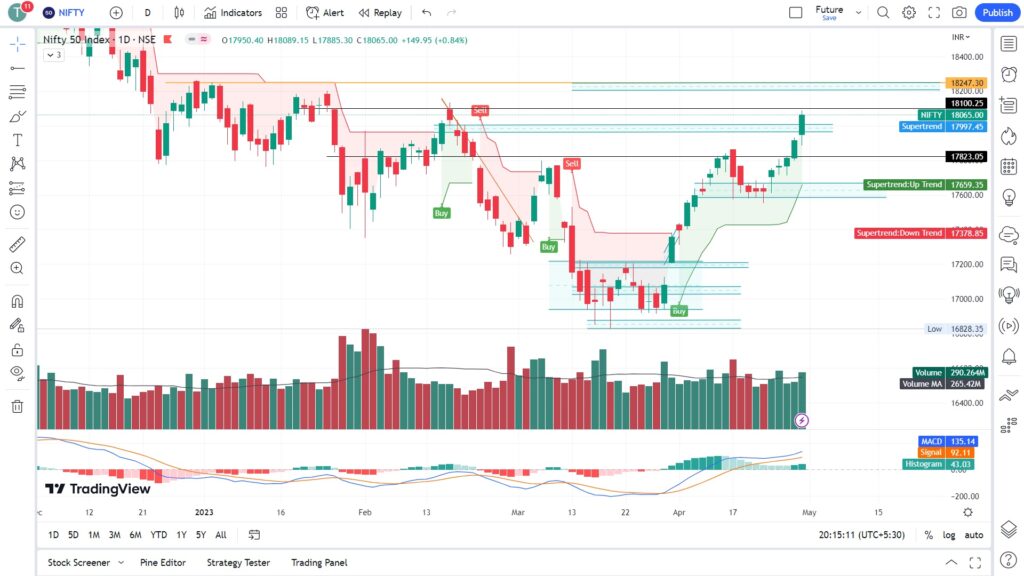
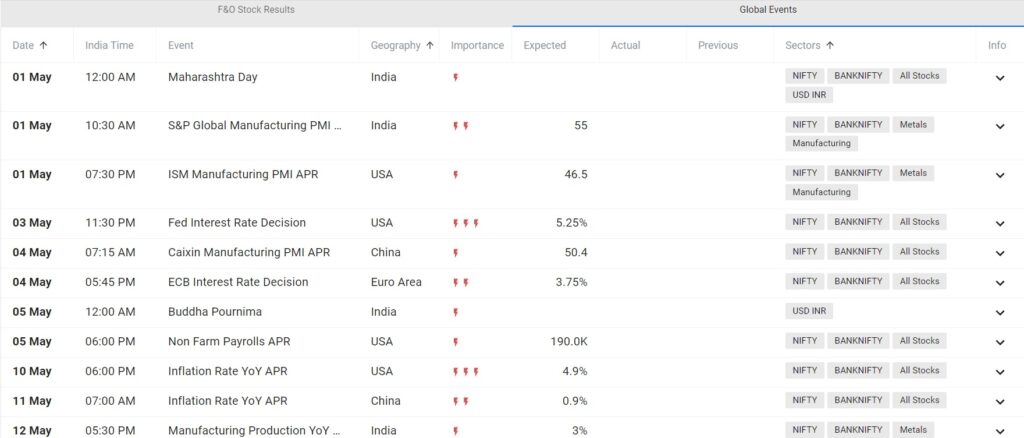
Daily View- There has been a continuous bull run for the last 5 sessions that posted a growth of 421 pts, hence some correction/pause is expected if it has to continue its bull run, and on daily basis till May 3rd, being FED Rate Hike outcome, therefore likely a pause or flattish market is expected till the decision is made public by US FED. Refer the Fig. 3
Important Levels from hourly Chart:-
Resistance levels are – 18100 – 18200
Support levels are – 17950 – 18000
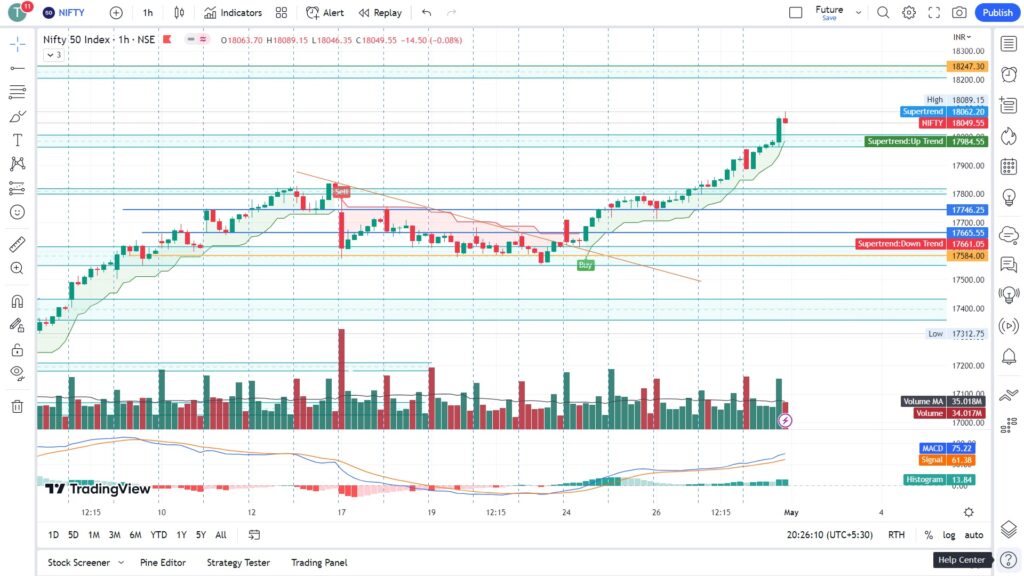
No trading Zone- 17950 – 18000
Previous Day – Strongly Positive
Previous Week – Strongly Positive.
Note:- There has been a continuous bull run for the last 5 sessions that posted a growth of 421 pts, hence some correction/pause is expected if it has to continue its bull run, and on daily basis till May 3rd, being FED Rate Hike outcome, therefore likely a pause or flattish market is expected till the decision is made public by US FED.
Data Analysis
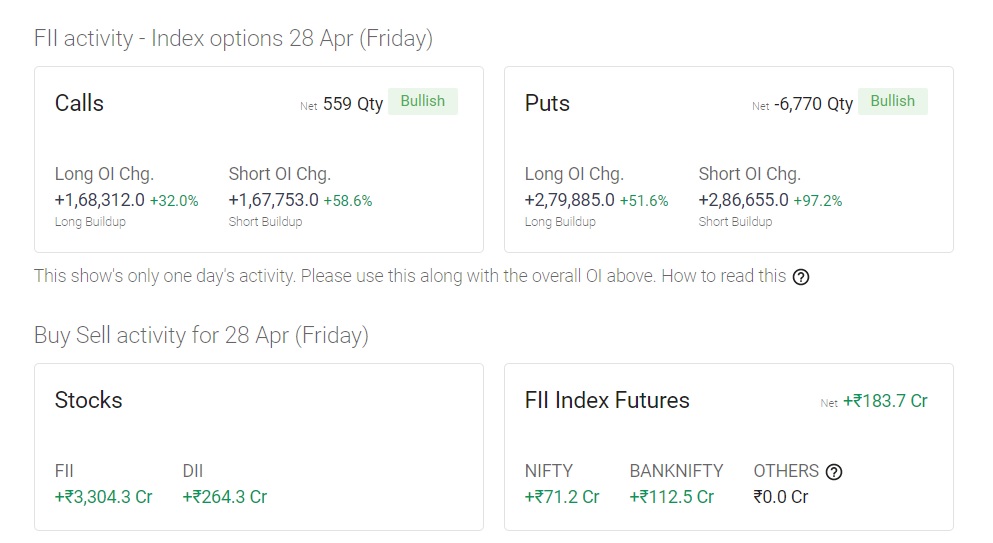
FII & DII Activity- Buying continues by FII in cash segments, it indicates strong bullish momentum.
FII Cash :: ▲ +₹3,304.3 Cr
FII Futures :: ▲ +₹183.7 Cr
DII Cash :: ▲ +₹264.3 Cr
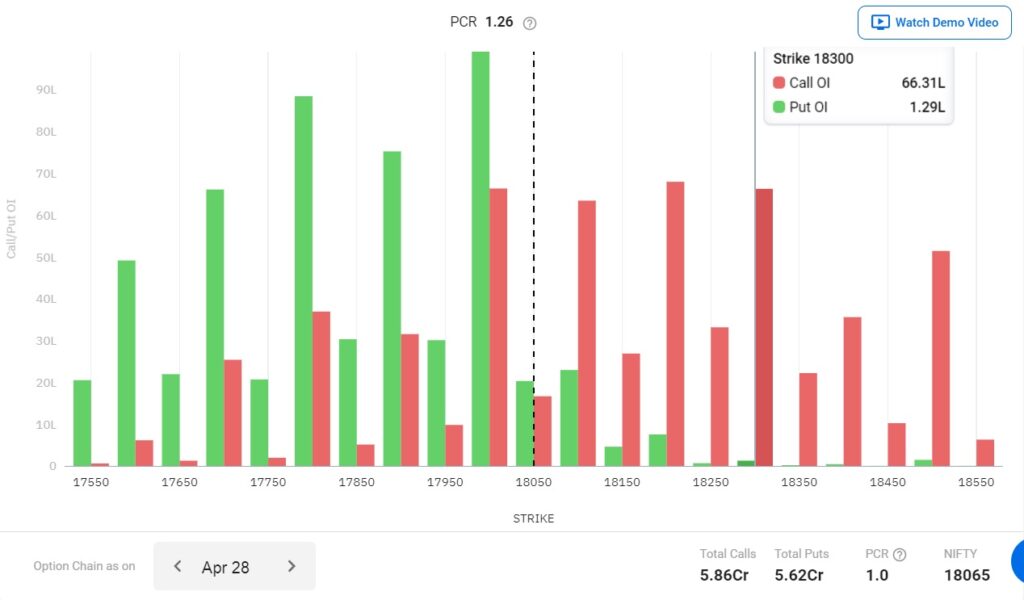
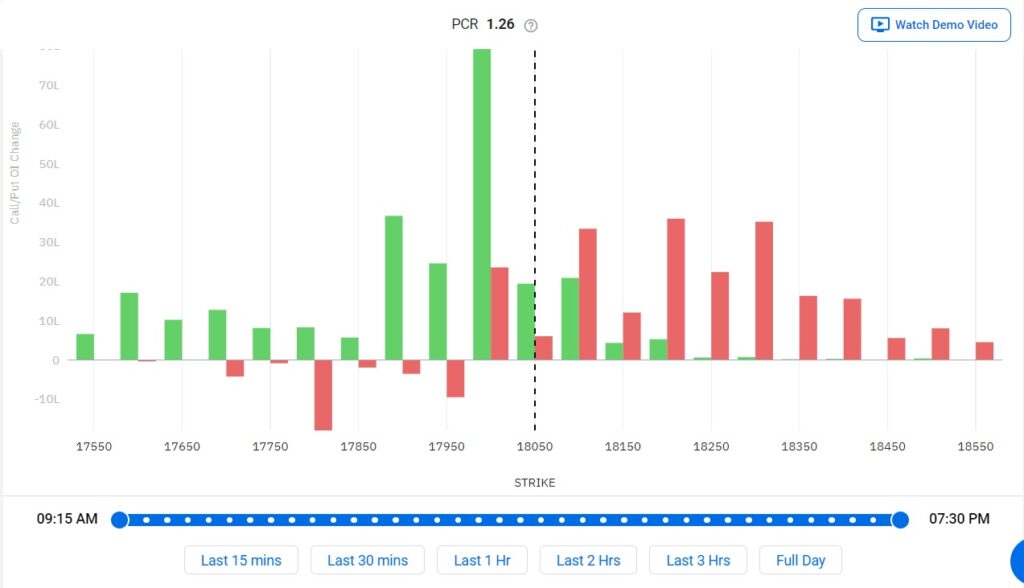
Open Interest (OI)- Both puts and calls are equally written with little more on puts side, but if we see in the last few trading sessions massive Puts are written at about 87 lakhs only at 18000, and unwinding observed in calls, indicating a strong positive momentum. And slight increase in the PCR gap, indicating tiredness, Looks mildly bullish .
PCR – 1.0 (+) Flat to Bullish.
Market Sentiments
World Markets – Traded and closed mostly Bullish
SGX N50 – Closed around 18207.5 at 10:00pm 28-04-2022
Events this Expiry/week
Quick links::
- #safebull (14)
- Analysis (6)
- Calendar (1)
- Educational (9)
- Information (10)
- Learning (27)
- Market (3)
- News (6)
- Strategy (17)
- Taxes (1)
The above analysis is solely the opinion of the author, no way an assured tips/direction to trade, they are solely for educational purposes. Please do not trade with out a proper study and analysis, we will not be responsible for your loss. We are not SEBI registered.
#SafeBull