Market View – 18th May 2023 Expiry, Expectations, Support & Resistances
#safebull , Analysis , Educational , Information , Learning , Market
How the market turn out previous expiry 18th May 2023, and what we can expect the next expiry. Broader view is shared below for the next week expiry, on the basis of Technical and Data Analysis. IMPORTANT ALERT !!!:- How the market turn out this expiry, 11th May 2023? Despite global market reeling under pressure, […]
How the market turn out previous expiry 18th May 2023, and what we can expect the next expiry. Broader view is shared below for the next week expiry, on the basis of Technical and Data Analysis.
IMPORTANT ALERT !!!:-
- Read the Disclaimer.
- For intraday follow price action in shorter time frame.
- This just a personal opinion.

How the market turn out this expiry, 11th May 2023?
Despite global market reeling under pressure, in the first few days of the week Indian indices performed well even though negative. And with positivity build up by US FED hike with positive statement and Inflations at 4.9% against projected 5%, has let FII to continue in buying, and bull run continued. Closed the week and expiry on a strong note with a growth of 245 pts over the weekend.
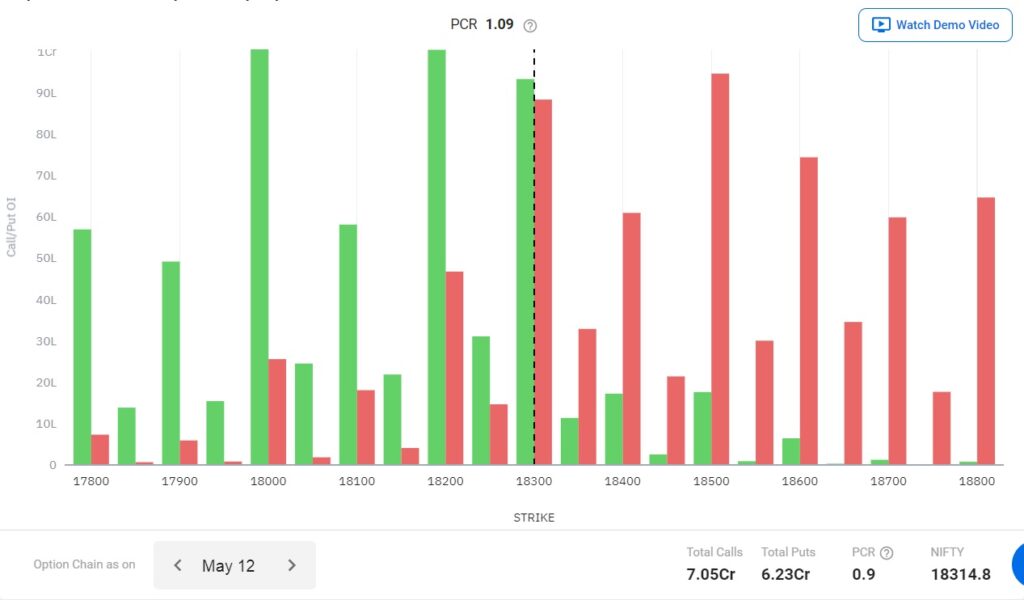
Strong support is seen at 18200 with 1Cr put sold and at 18000 as well with 1Cr put sold. Resistance seems to be building up at 18500 level with 0.96cr OI Calls.
Technical Analysis
Monthly View- No Change in view
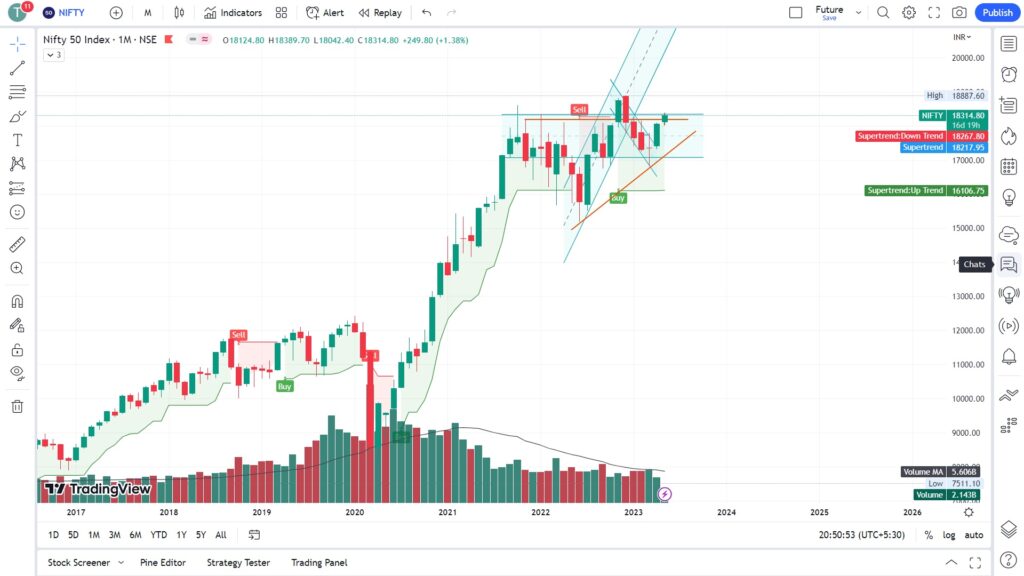
On the monthly chart, it has broken out from the bearish channel and closed on a very strong bullish note, after a trend reversal confirmation a bullish candle is developing, last Friday gave a gain of 245 pts adding to the bullishness, and overall bullish trend is still intact. Refer the Fig. 1
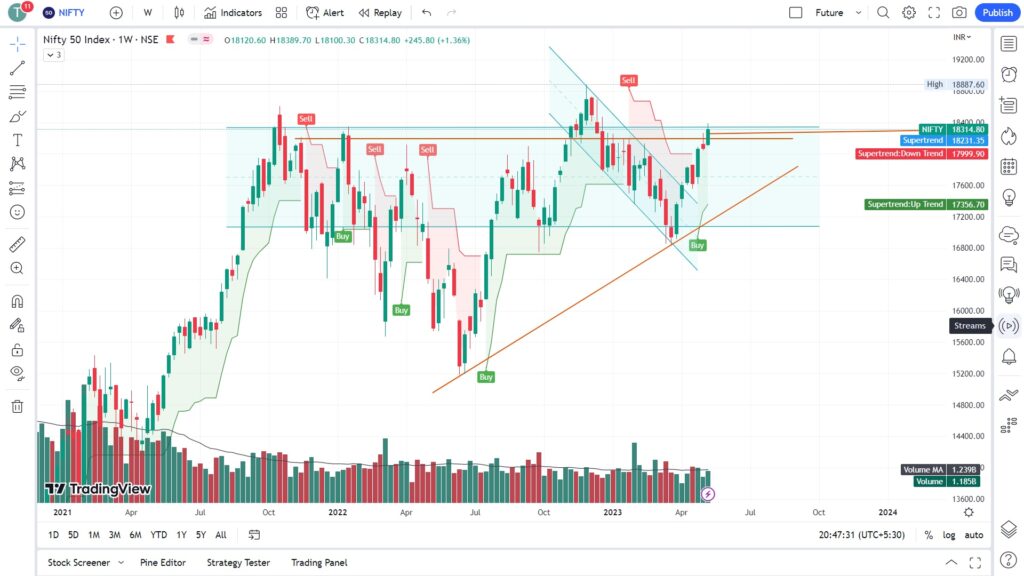
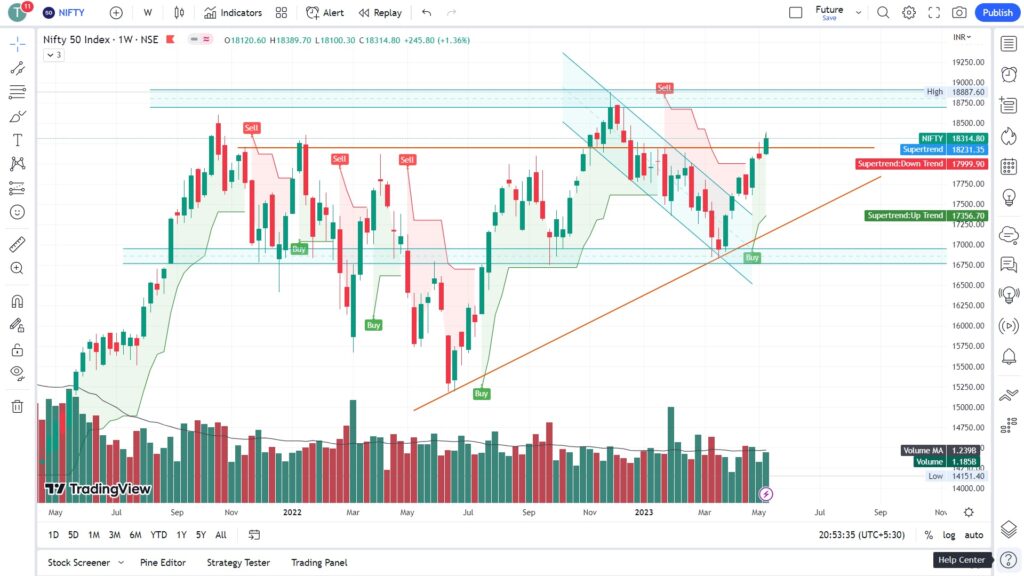
Weekly View- After a strong closure last week, against the correction on the week before, market so far continued its bull run and it has gained 1540 Pts from the last dip. Market is still under the strong gripped of the bulls. After such a huge gain even though bullish trades continue, but it is best to lighten up the lots or trade cautiously as it has a very high change of corrections and profit booking. Refer the Fig. 2
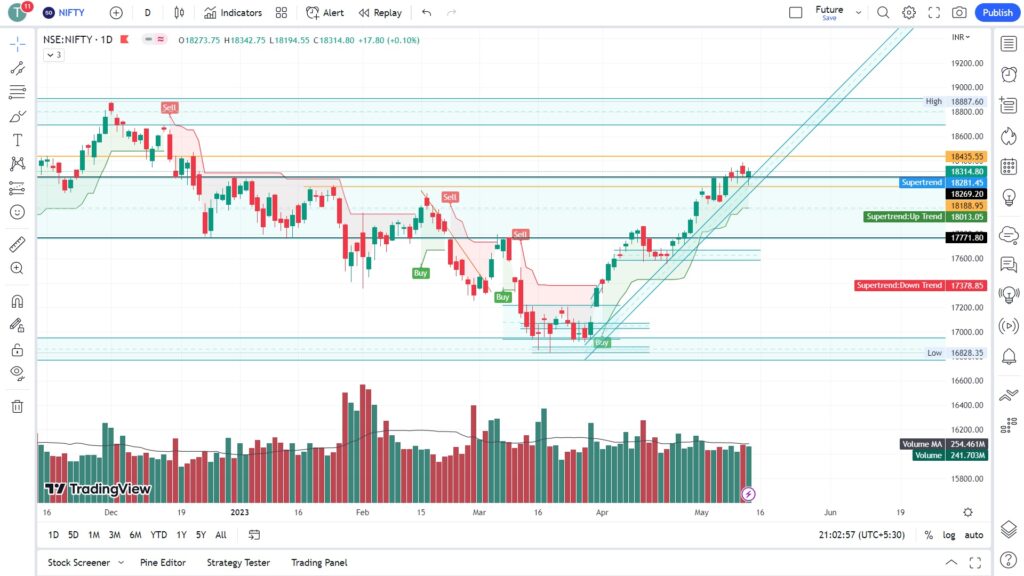
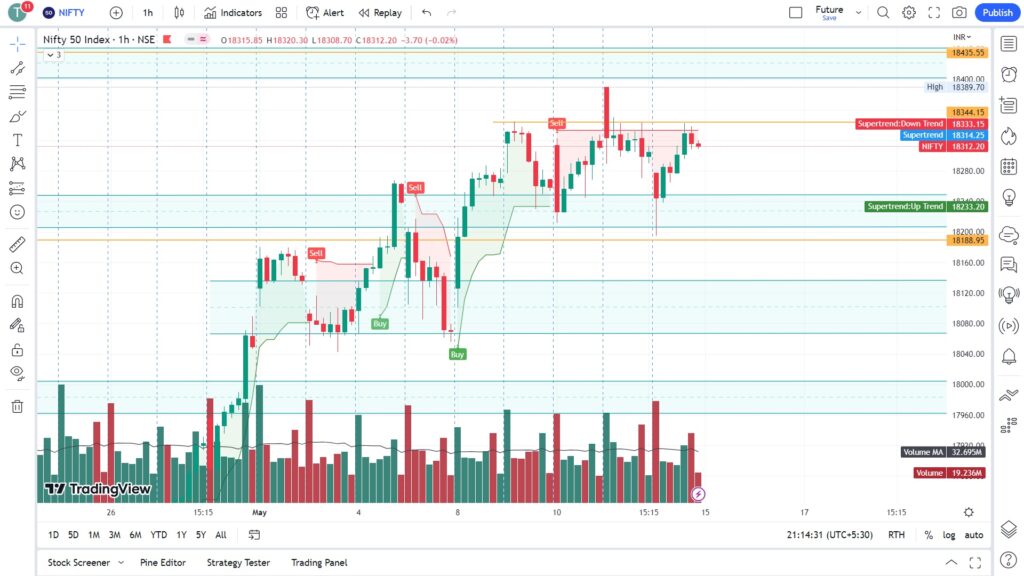
Daily View- Bull run continues and for the last 4(four) sessions it has been consolidating around 18300 levels, and had moved about 1500 pts from the previous dip, and strong support at 18200. Trade cautiously on the bullish side as the market is in over sold zone, but don’t short as well. We should short only if the market sustains below 18200.
In the last few sessions, despite European & American indices underperforming, Indian indices added some 245 pts gains and both weekly and daily price action is bullish right now.
In the hourly chart, head and shoulder kind of pattern is formed, indicating a negative cycles, beginning and the market has not been able to sustain above 18300- 18350 level, therefore this would be a zone of interest or no trading zone. Refer the Fig. 3
Important Levels from hourly Chart:-
Resistance levels are – 18400 – 18500
Support levels are – 18100 – 18200
No trading Zone- 18350 – 18250
Previous Day – Postive
Previous Week – Postive
Note:-
Bull run continues and for the last 4(four) sessions has been consolidating around 18300 levels, and had moved about 1500 pts from the previous dip, and strong support at 18200. Trade cautiously on the bullish side as the market is in over sold zone, but don’t short as well. We should short only if the market sustains below 18200.
In the last few sessions, despite European & American indices underperforming, Indian indices added some 245 pts gains and both weekly and daily price action is bullish right now.
In the hourly chart Head and shoulder kind of pattern is formed, indicating a negative cycle beginning and market has not been able to sustain above 18300- 18350 level, therefore this would be a zone of interest or no trading zone.
**Factors that are worrying are low VIX and market mood is at extreme greed. Finally Vix had improve to some extend.
Data Analysis
FII & DII Activity-
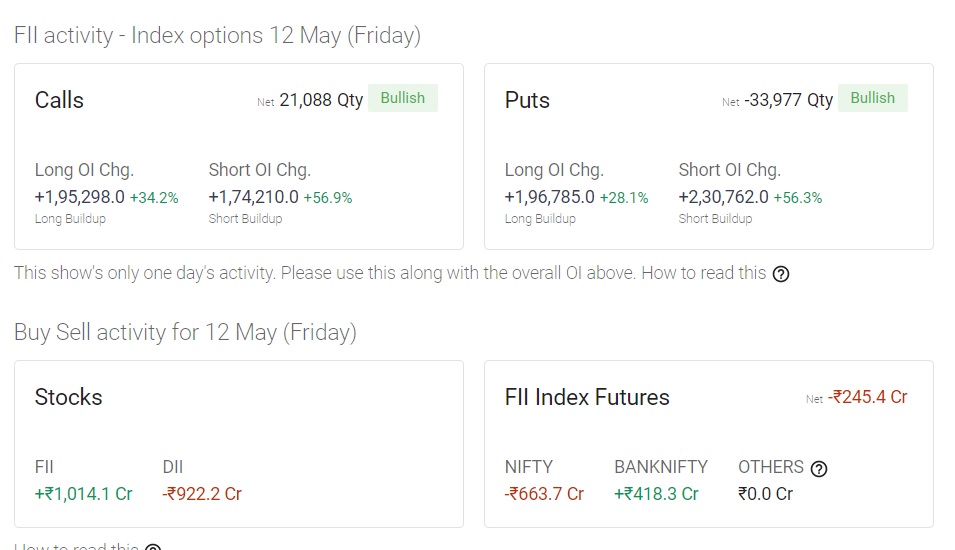
Buying continues by FII in cash segments, but selling in futures segment indicating a mixed signal.
FII Cash :: ▲ +₹1,014.1 Cr
FII Futures :: ▼ -₹245.4 Cr
DII Cash :: ▼ -₹922.2 Cr
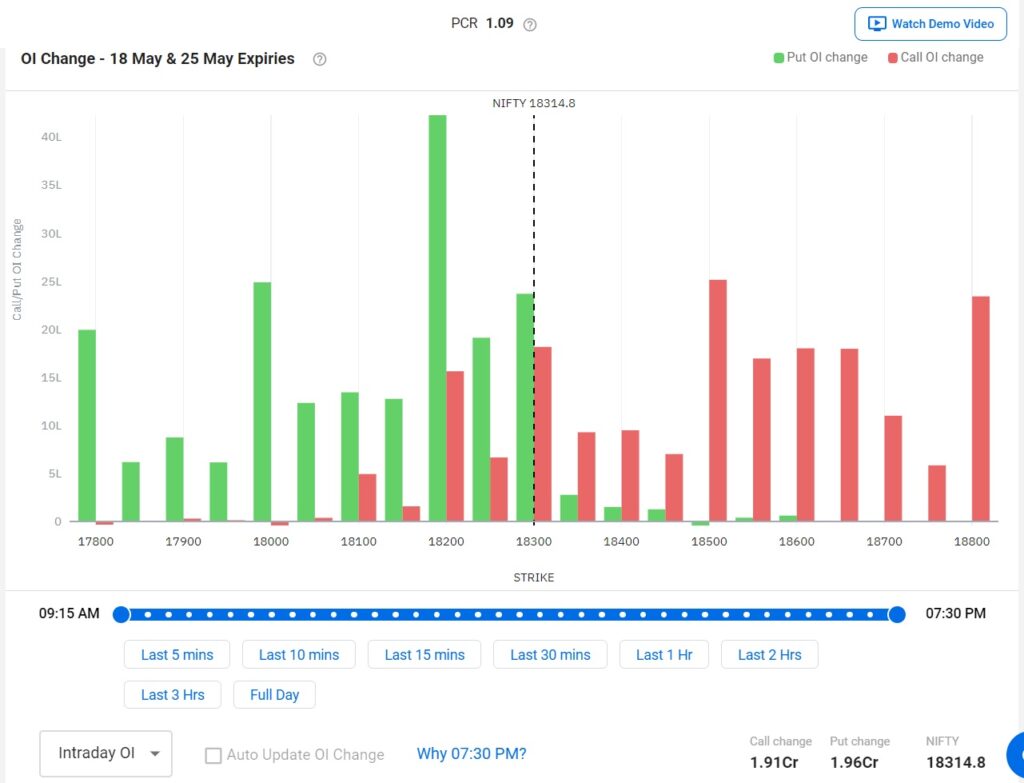
Open Interest (OI)-
Nominally more puts written than calls with maximum at 18000 & 18200, and Rs. 1Cr worth each written. And the PCR gap have decreased further, indicating strength in the broader market.
PCR – 0.9 (-) Flat.
Market Sentiments
World Markets – World market digested the US FED hikes and YOY Inflation data, traded mostly positive except US markets traded flat.
SGX N50 – Closed around 18250 at 19:00pm 14-05-2022
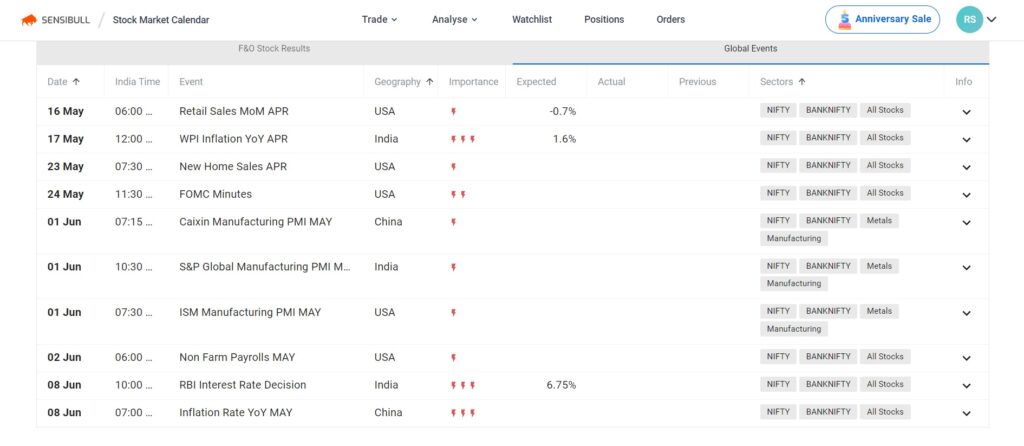
Events this Expiry/week
Quick links::
- #safebull (14)
- Analysis (6)
- Calendar (1)
- Educational (9)
- Information (10)
- Learning (27)
- Market (3)
- News (6)
- Strategy (17)
- Taxes (1)
The above analysis is solely the opinion of the author, no way an assured tips/direction to trade, they are solely for educational purposes. Please do not trade with out a proper study and analysis, we will not be responsible for your loss. We are not SEBI registered.
#SafeBull