Market View – 1st June 2023 Expiry
#safebull , Analysis , Educational , Information , Learning , Market
Our View last week:
Price action is highly bullish, and in the chart a hammer at the bottom of the swing, indicating the trend reversal from bearish to Bullish on daily time frame, that too with good volume. A good up move is anticipated on Monday with all other markets closing positively with no events and negative news so far. On the hourly chart a strong buying is observed in the last few hours of the last session of the week
Market Behaviour:
Exactly on Monday, NIFTY added 111Pts , followed by negative sessions on Tuesday and Wednesday, but gained again around 200pts on Thursday and Friday session. The week ended very positively and accumulated around 300pts in net over the week..[ Read More ]…
Expectations, Support & Resistances
WARNING !!!:-
- Read the Disclaimer.
- This just a personal opinion.
:: How the market turn out last expiry and our view?
Our View last week:
Price action is highly bullish, and in the chart a hammer at the bottom of the swing, indicating the trend reversal from bearish to Bullish on daily time frame, that too with good volume. A good up move is anticipated on Monday with all other markets closing positively with no events and negative news so far. On the hourly chart a strong buying is observed in the last few hours of the last session of the week
Market Behavior:
Exactly on Monday, NIFTY added 111Pts , followed by negative sessions on Tuesday and Wednesday, but recovered and gained around 200pts on Thursday and Friday session. The week ended very positively and accumulated around 300pts in net over the weekend.

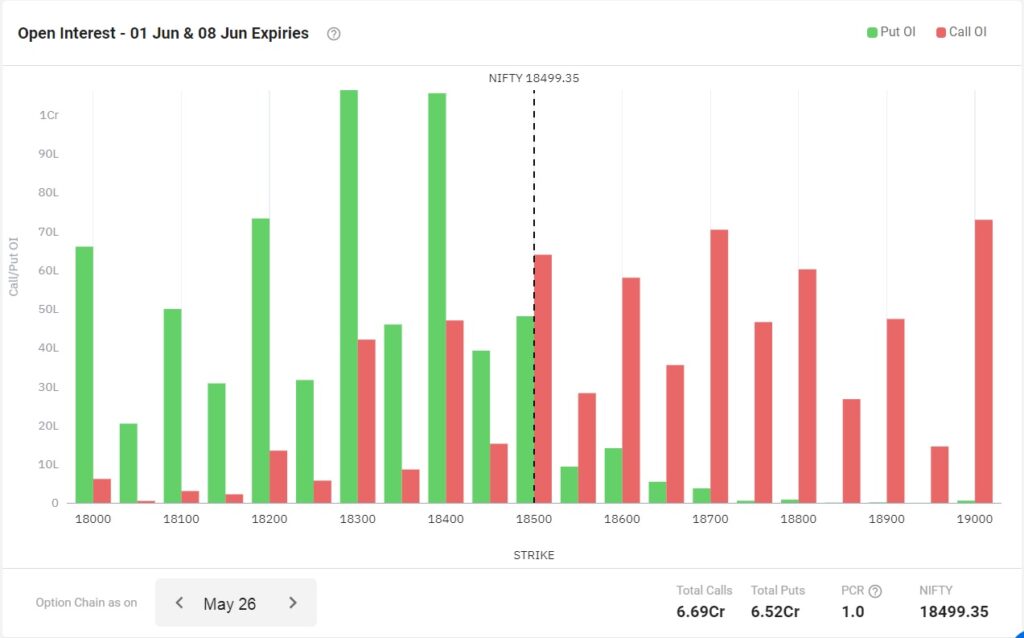
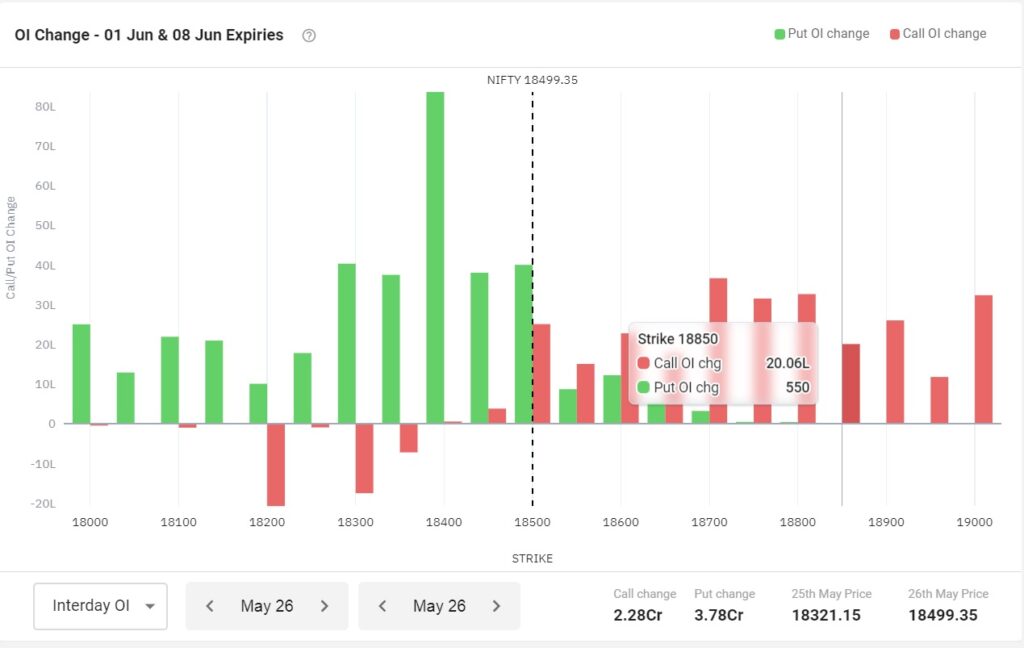
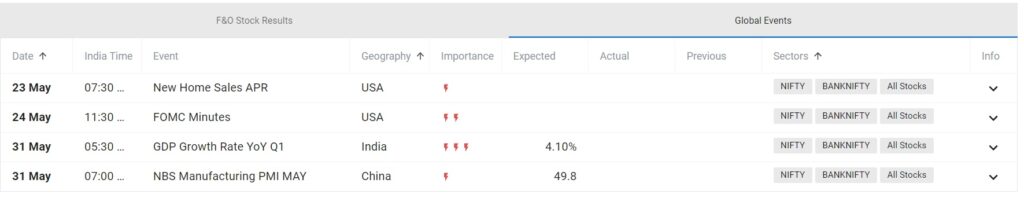
NIFTY has closed with PCR of 1.0 and put writing of 1.06 Cr each at 18300 & 18400, indicating it as a strong support for the upcoming week. With Lots of positivity around, market is expected to open on Monday, with US debt ceiling nearing a deal and the mixed US CPI data effect has already been absorbed, only event to watch out for is Indian YOY GDP data on 31st May 5:30Pm.
:: Technical Analysis
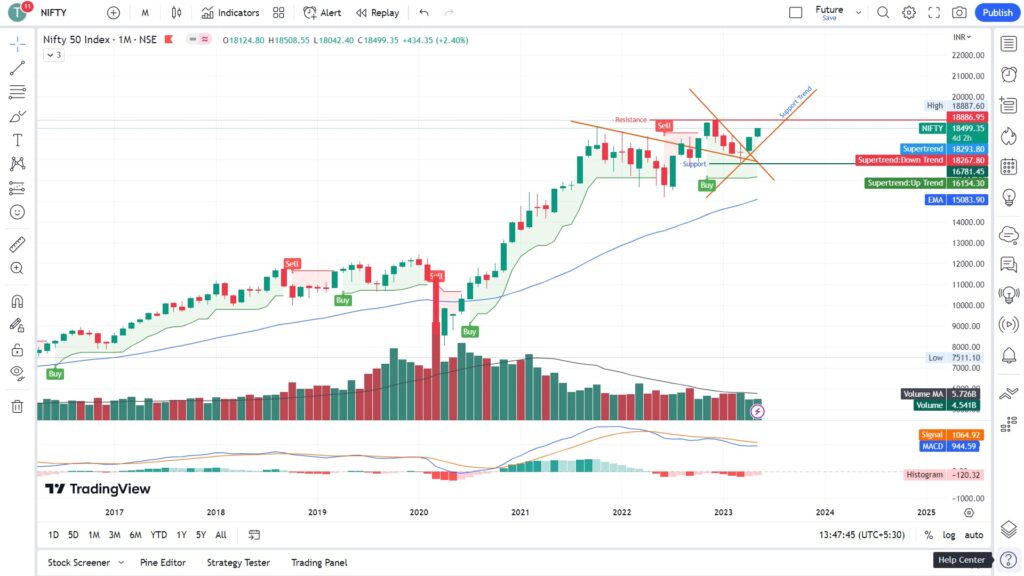
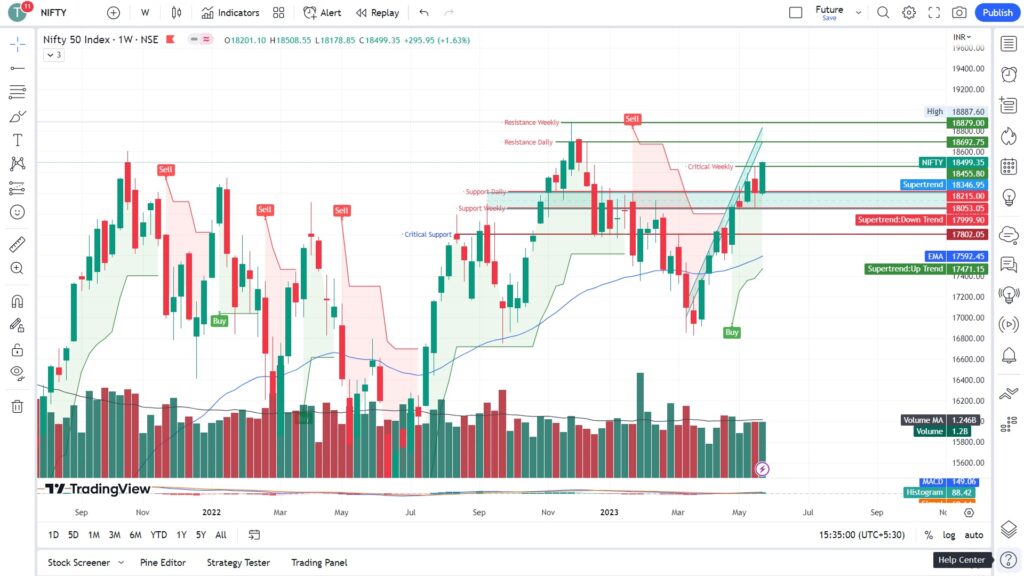
Weekly View– The bull run continues after a pause/correction previous week, this week closed above last week High. Gap has been filled between 18400 & 18500. Strong weekly closure with a gain of 300+ pts by NIFTY, and NIFTY is inching towards the All time high, next resistance is at 18600, if the market sustains above 18500 this week, a new all time high is very much achievable. Refer the Fig. 2
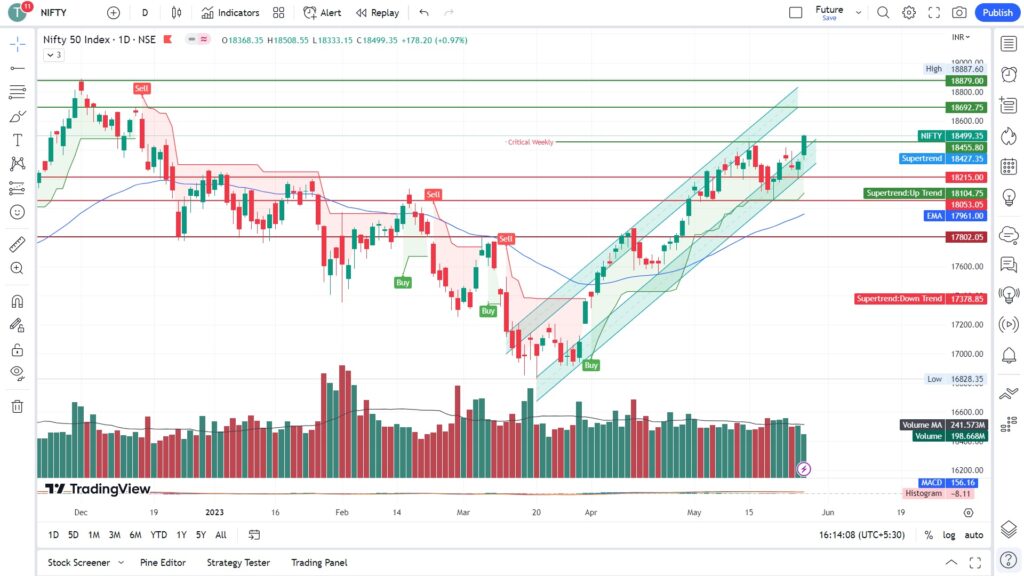
Daily View- Price action looks very bullish in the daily time frame. After a huge rally on Monday, there was a slight correction on Tuesday & Wednesday session, which were recovered and closed above last week’s high on Friday.
On Monday if the market opens up and sustains above 18500 levels for few hours, market is likely to continue with the trend and face resistance at 18600. But before breaking the all time high, a little pause and correction is expected and will be considered necessary for strong up move.
Refer the Fig. 3
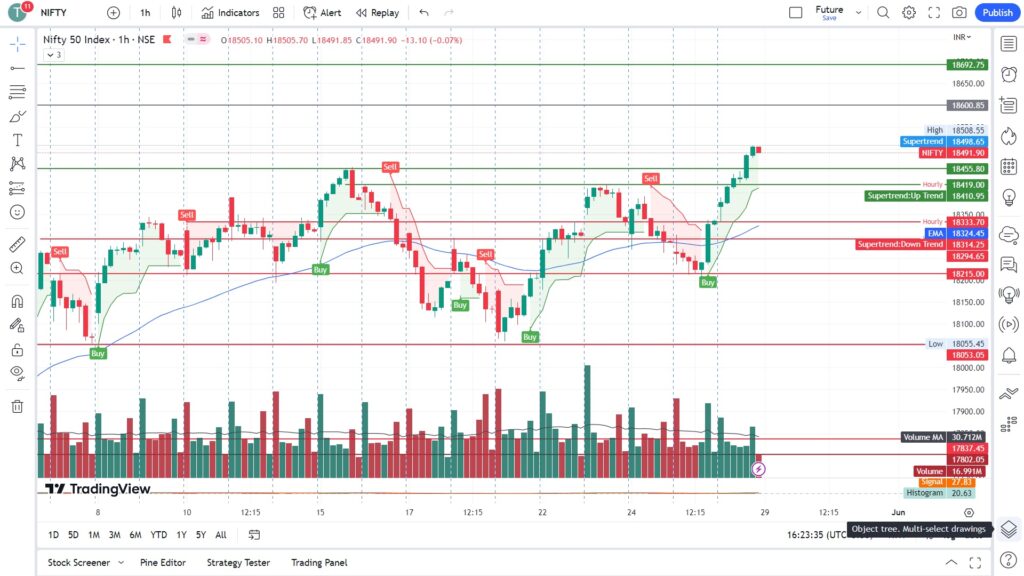
The price action on hourly chart market is very bullish as long as and likely to stay bullish as long as 18412 level is held. Correction till 18400 is highly anticipated and will be considered a healthy retracement.
Important Levels:
Resistance – 18600 – 18692
Support – 18415 -18455
No trading Zone- 18450 -18600
Previous Day – Postive
Previous Week – Positive
NOTEWORTHY:-
Price action looks very bullish in the daily time frame. After a huge rally on Monday, there was a slight correction on Tuesday & Wednesday session, which were recovered and closed above last week’s high on Friday.
On Monday if the market opens up and sustains above 18500 levels for few hours, market is likely to continue with the trend and face resistance at 18600. But before breaking the all time high, a little pause and correction is expected and will be considered necessary for strong up move.
NIFTY has closed with PCR of 1.0 and put writing of 1.06 Cr each at 18300 & 18400, indicating it as a strong support for the upcoming week. With Lots of positivity around, market is expected to open on Monday, with US debt ceiling nearing a deal and the mixed US CPI data effect has already been absorbed, only event to watch out for is Indian YOY GDP data on 31st May 5:30Pm.
:: Data Analysis
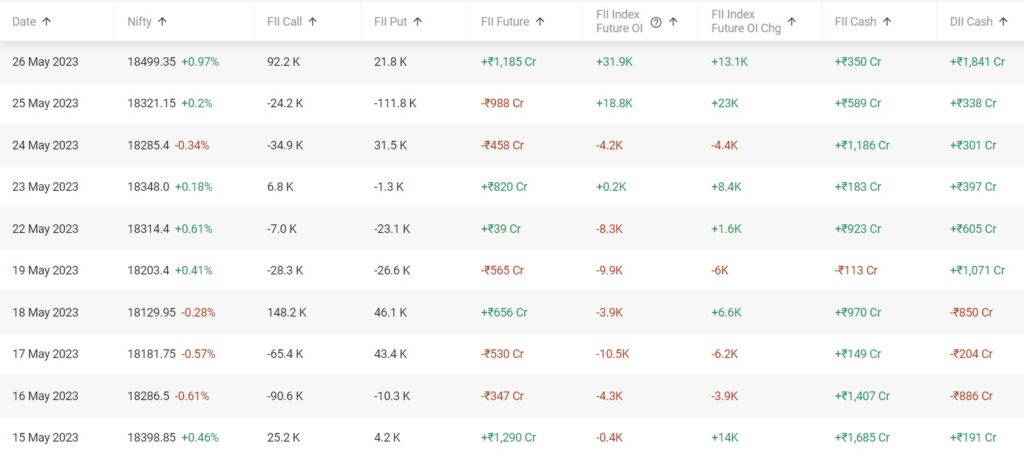
FII & DII Activity-
FII buying observed in all segments.
FII Cash :: ▲ +₹350.1 Cr
FII Futures :: ▼ +₹1,184.8 Cr
DII Cash :: ▲ +₹1,841.0 Cr
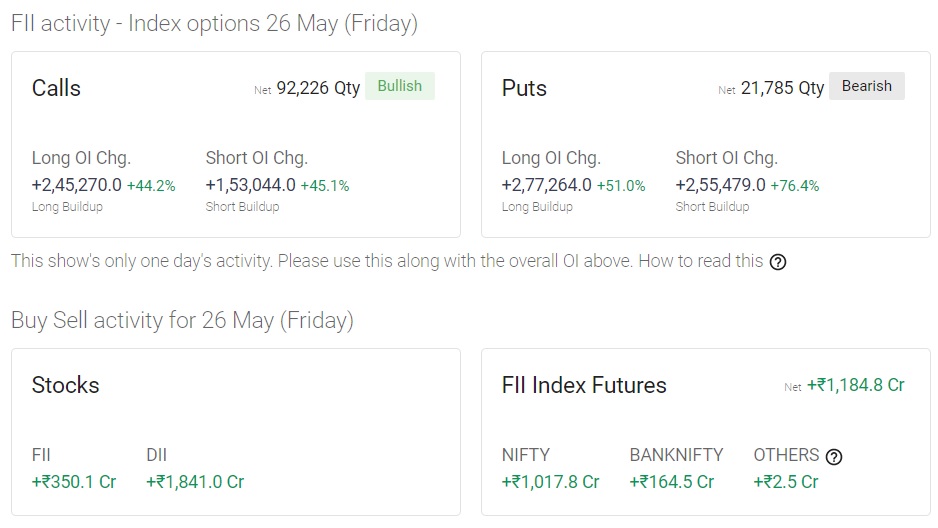
Open Interest (OI)-
Lots of put writing observed at 18300 & 18400 level about 1.06Cr each, and no significant call writing at high levels, thus no strong resistance in the upper side.
PCR – 1.0 (+) Bullish.
:: Market Sentiments
World Markets – World market mostly traded positively. And US market rose with debt ceiling deal nearing a closure.
SGX N50 – Closed around 18632.5 at 4:00pm 27-05-2022
:: Events this Expiry/week
Quick links::
- #safebull (14)
- Analysis (6)
- Calendar (1)
- Educational (9)
- Information (10)
- Learning (27)
- Market (3)
- News (6)
- Strategy (17)
- Taxes (1)
The above analysis is solely the opinion of the author, no way an assured tips/direction to trade, they are solely for educational purposes. Please do not trade with out a proper study and analysis, we will not be responsible for your loss. We are not SEBI registered.
#SafeBull