Technical Analysis for week 19th February, 2024
Analysis , Charts , Information , Weekly
:: NIFTY 50
View :
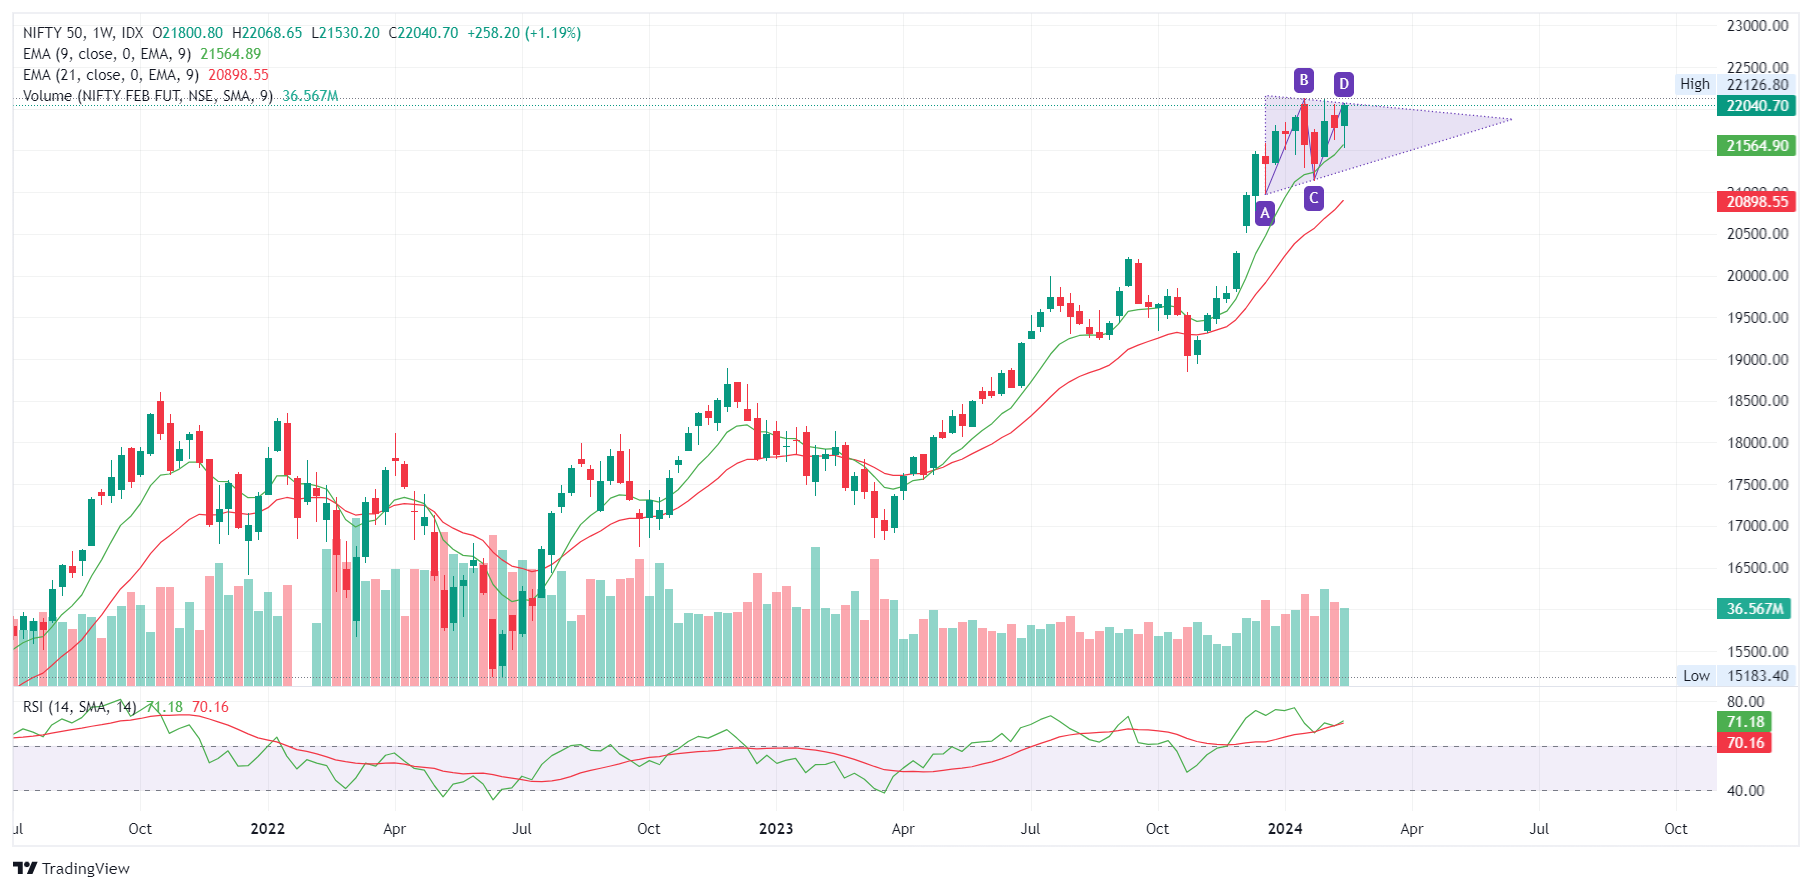
A bullish triangular flag pattern is evident on weekly time frame, with a possible breakout in the upper side, in the upcoming week.
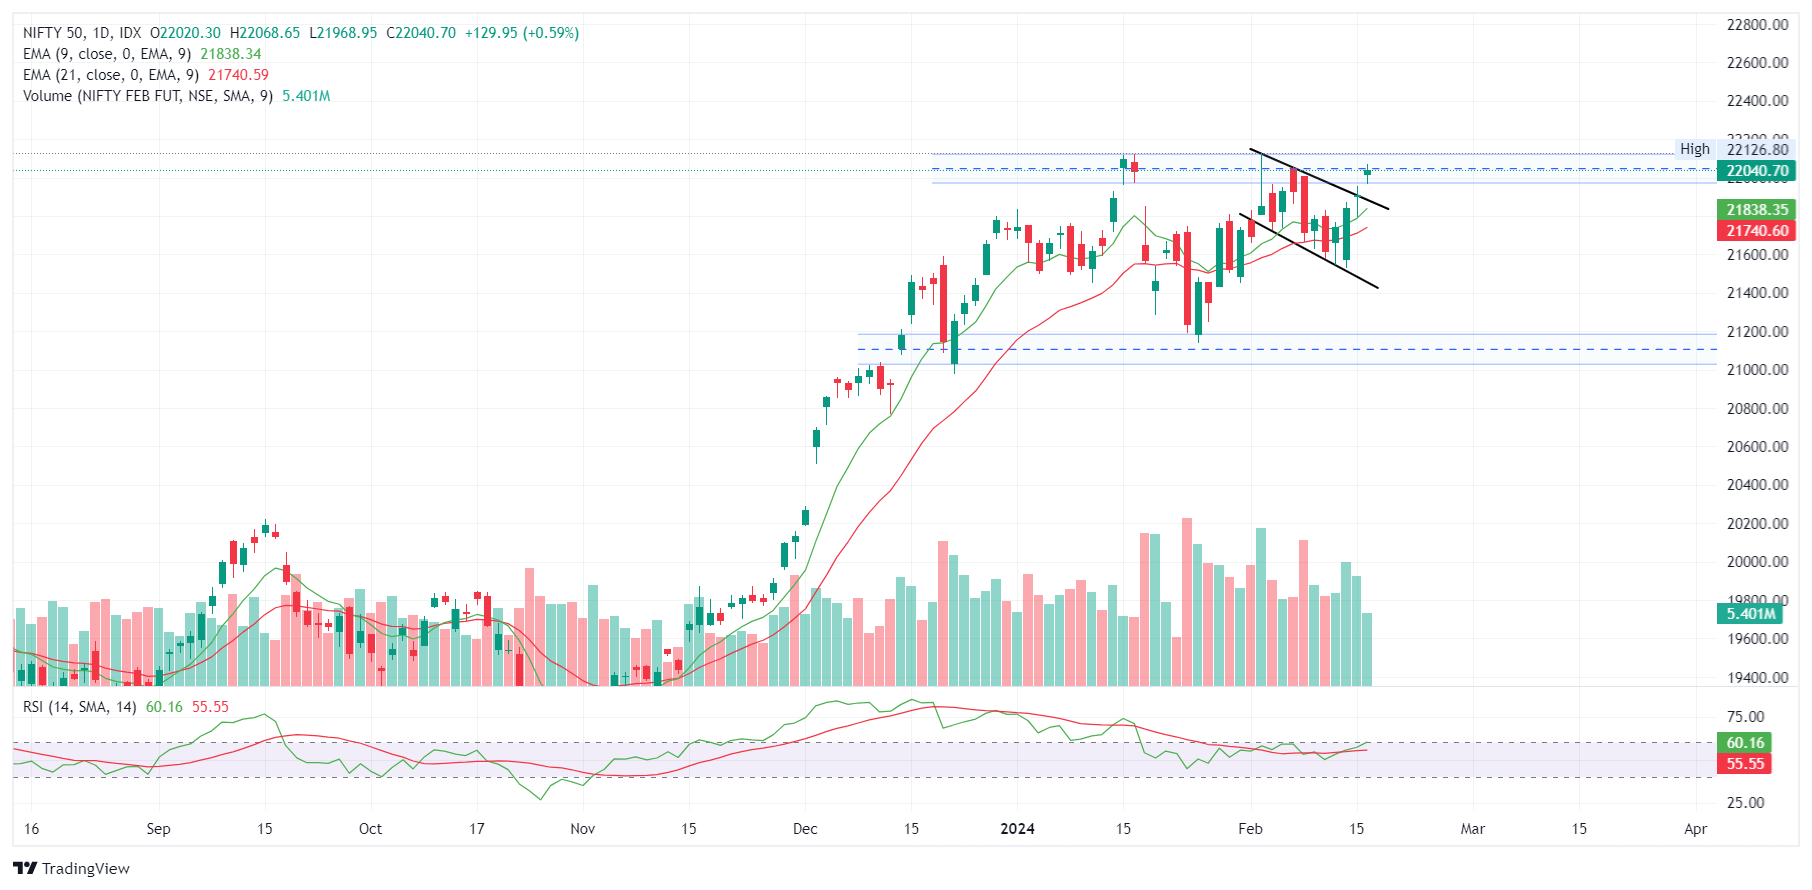
Clear break out from a bullish flag pattern on daily time frame confirmed. And NIFTY is trading near all time high.
Important Levels
- Resistance – 22,150- 22,200
- Support – 21,950 – 22,000
- No trading Zone – 21,950 – 22,000
BANKNIFTY
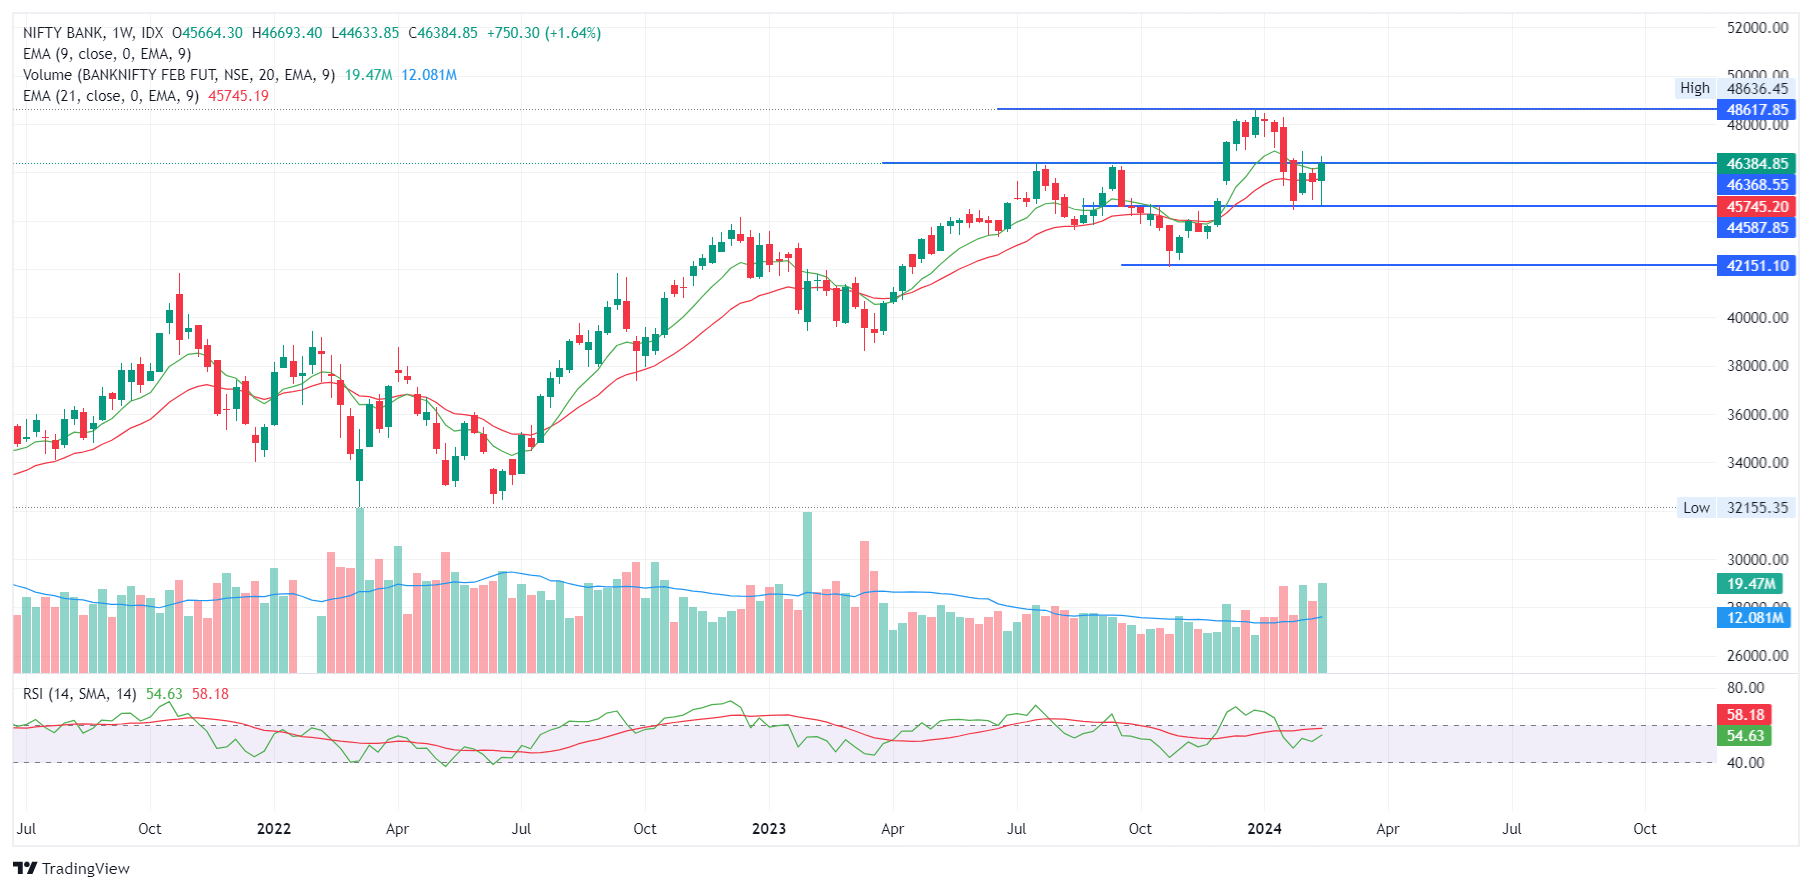
View :
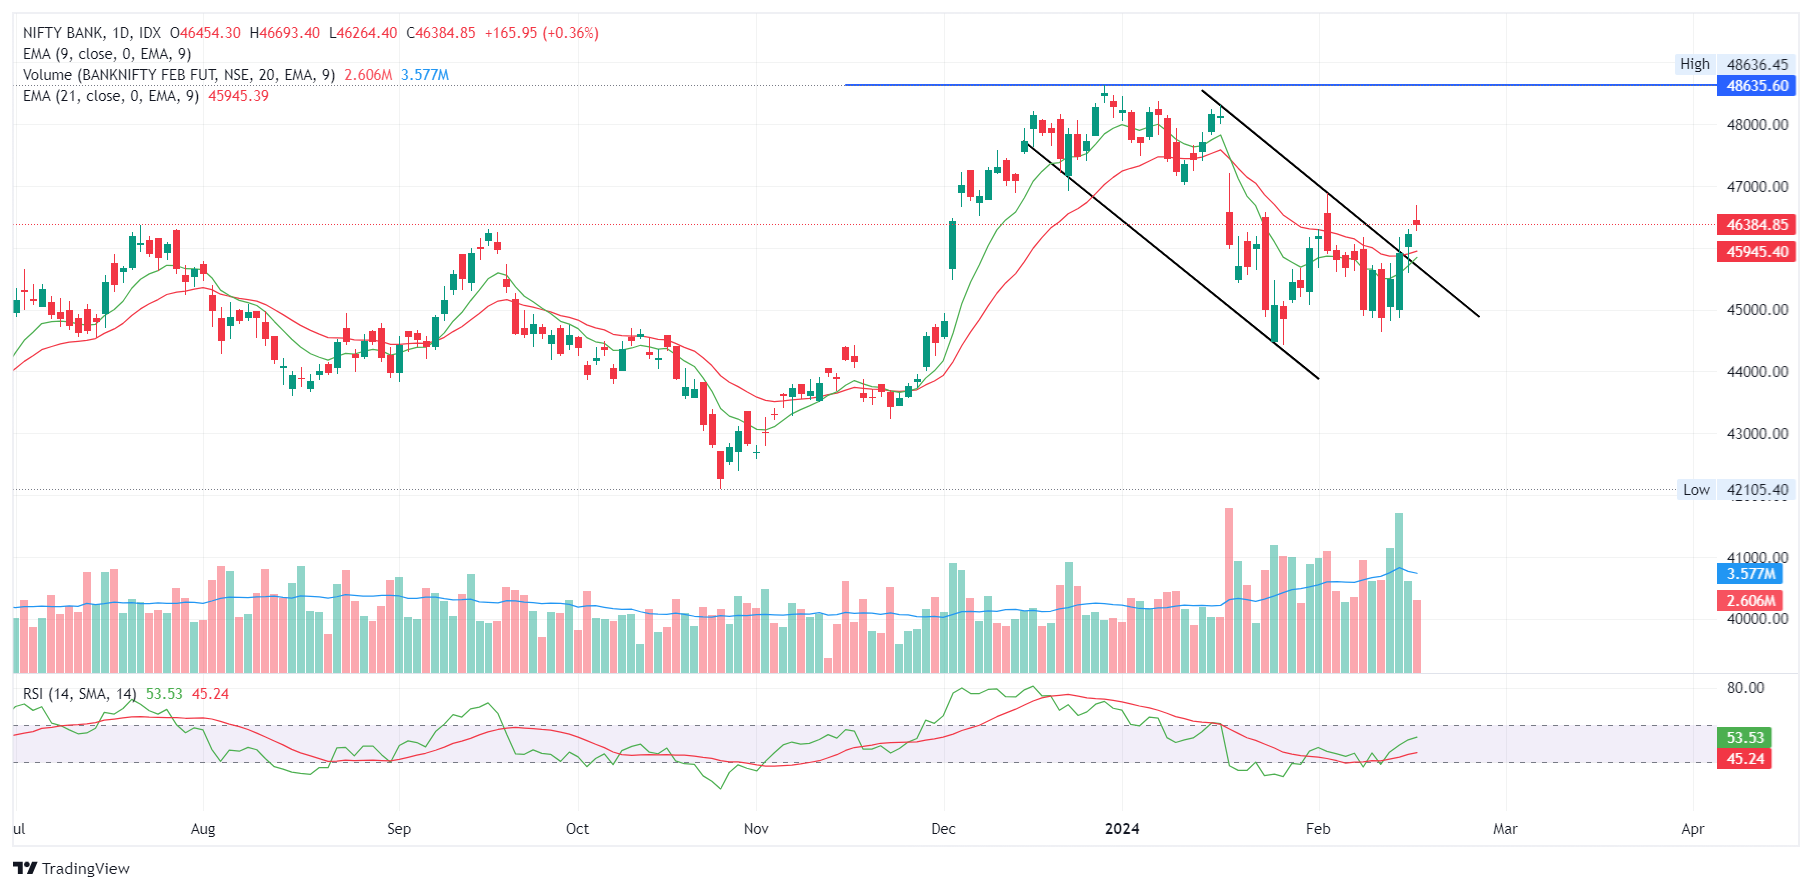
In the weekly chart very strong wicks are observed from the bottom, Looks like bullishness is back.
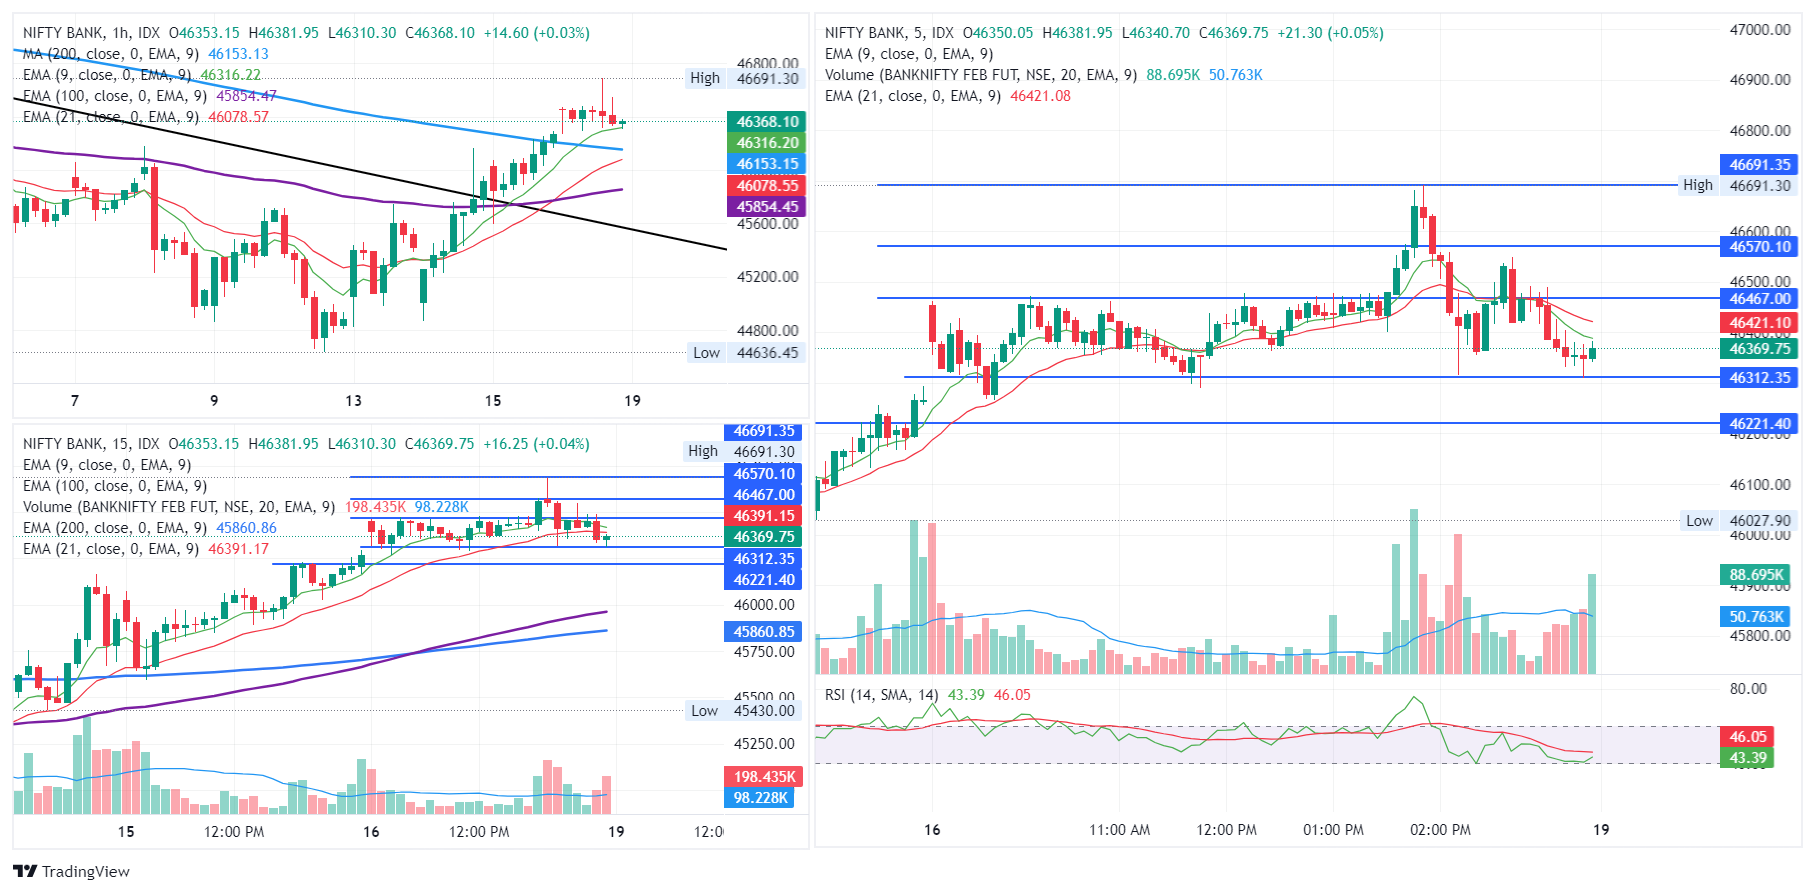
On the daily time frame, a trendline break out is observed in the bullish side. Hopeful to see more upside.
Important Levels
- Resistance – 46,600 – 46,700
- Support – 46,200 – 46,300
- No trading – 46,200 – 46,300