Data analysis for the Week, 5th February, 2024
Data , Weekly
FII & DII Data
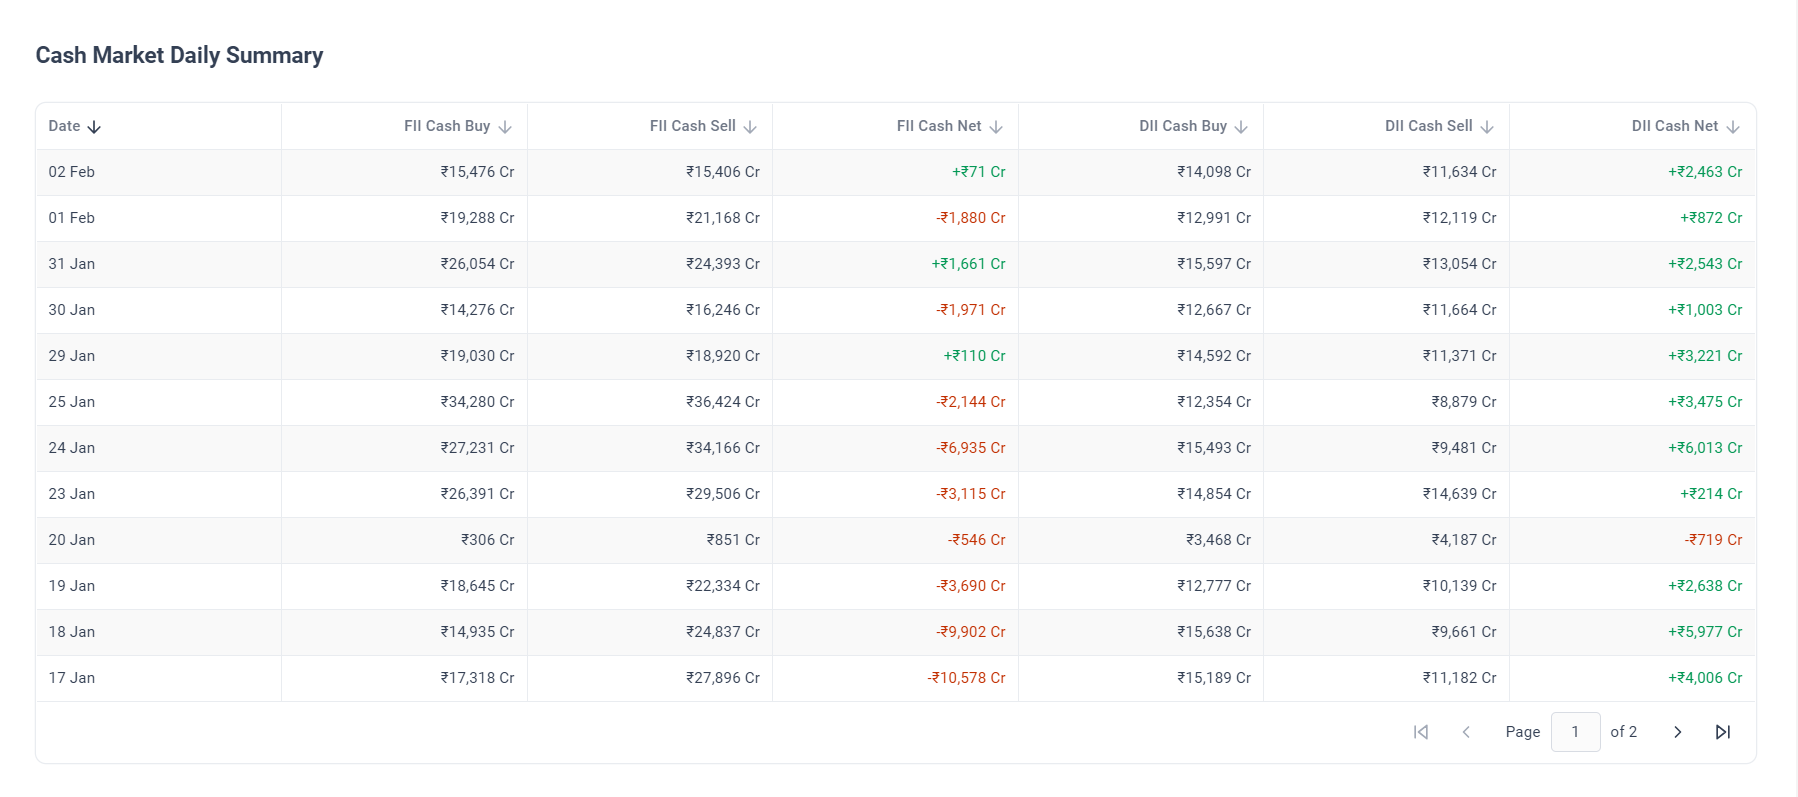
Observations:
FII & DII data suggest market to trade in flat to Bullish:
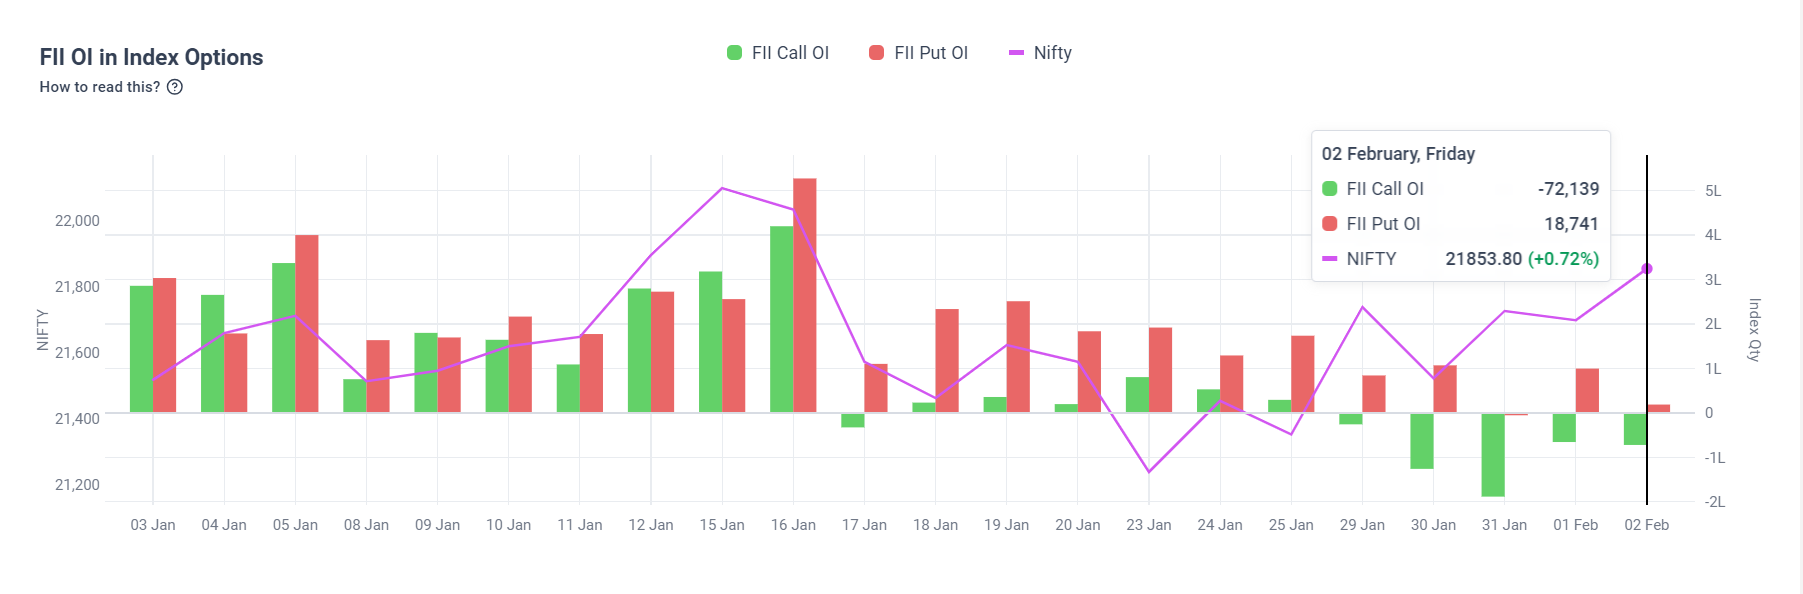
- Outstanding puts is 18K bought against -72K calls shorted – Looks Bearish.
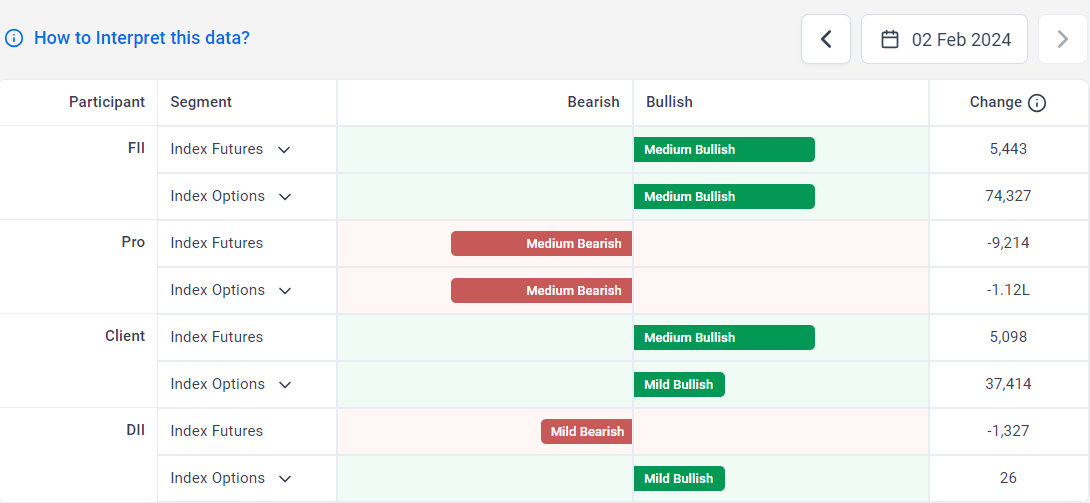
- Last session FII, PRO, Clients & DII activity – Bullish inclined as FII, Client & DII But Pro are Bearish.
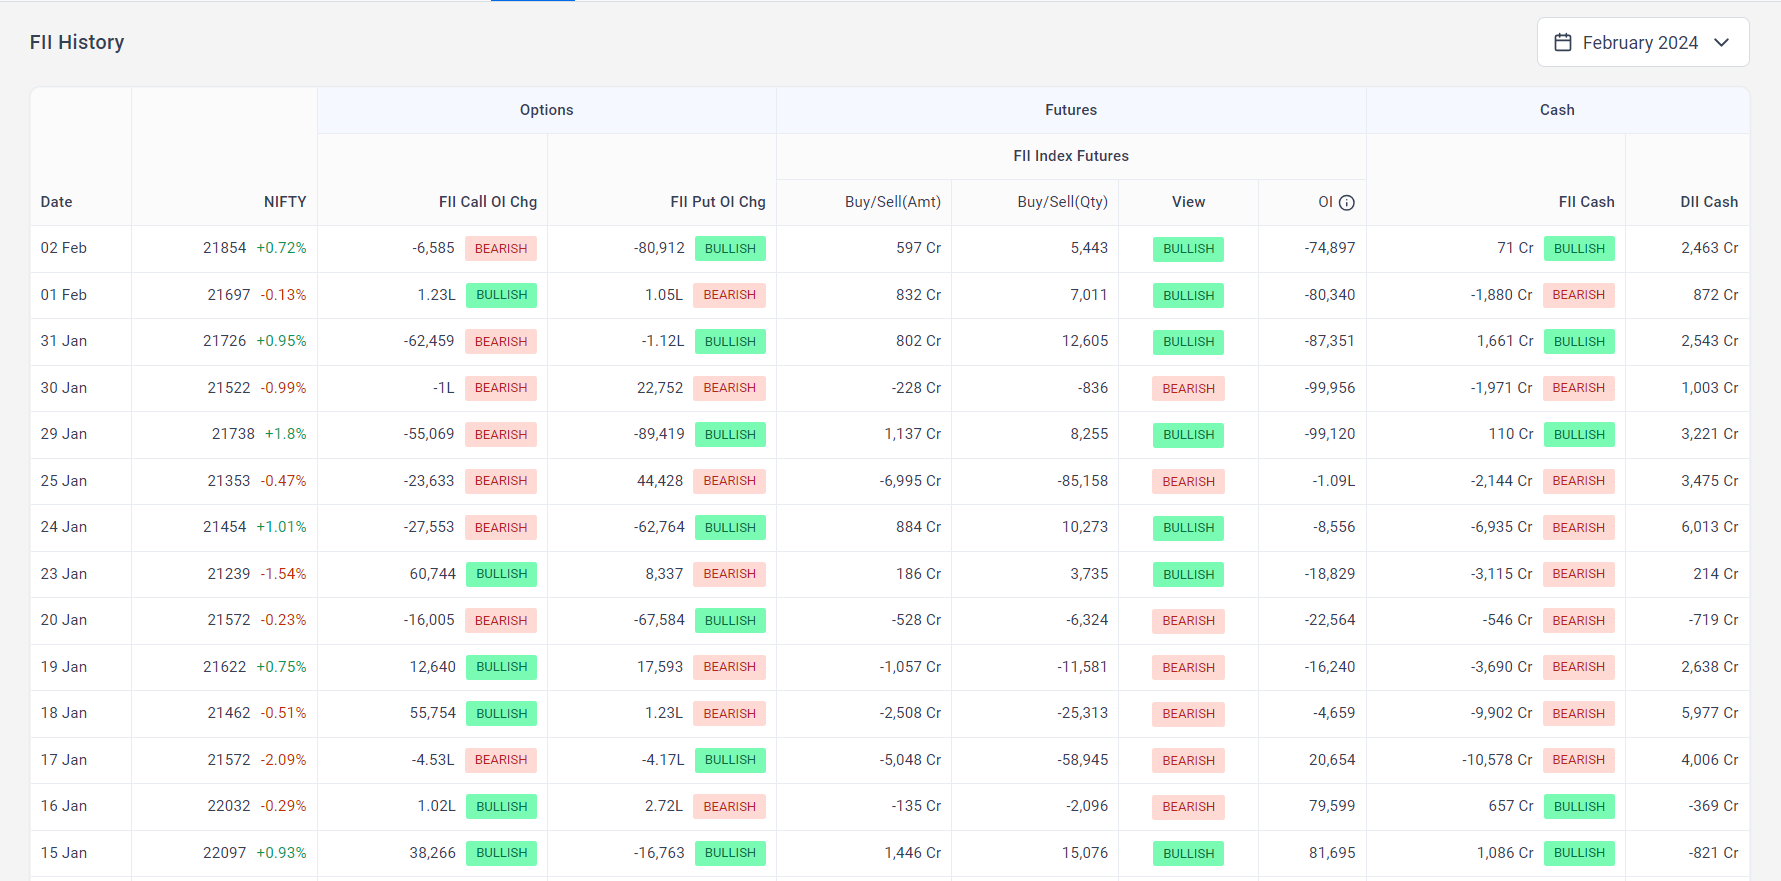
- FII stocks is 71Cr bought – Does not hold relevance for intraday but bullish in long term perspective
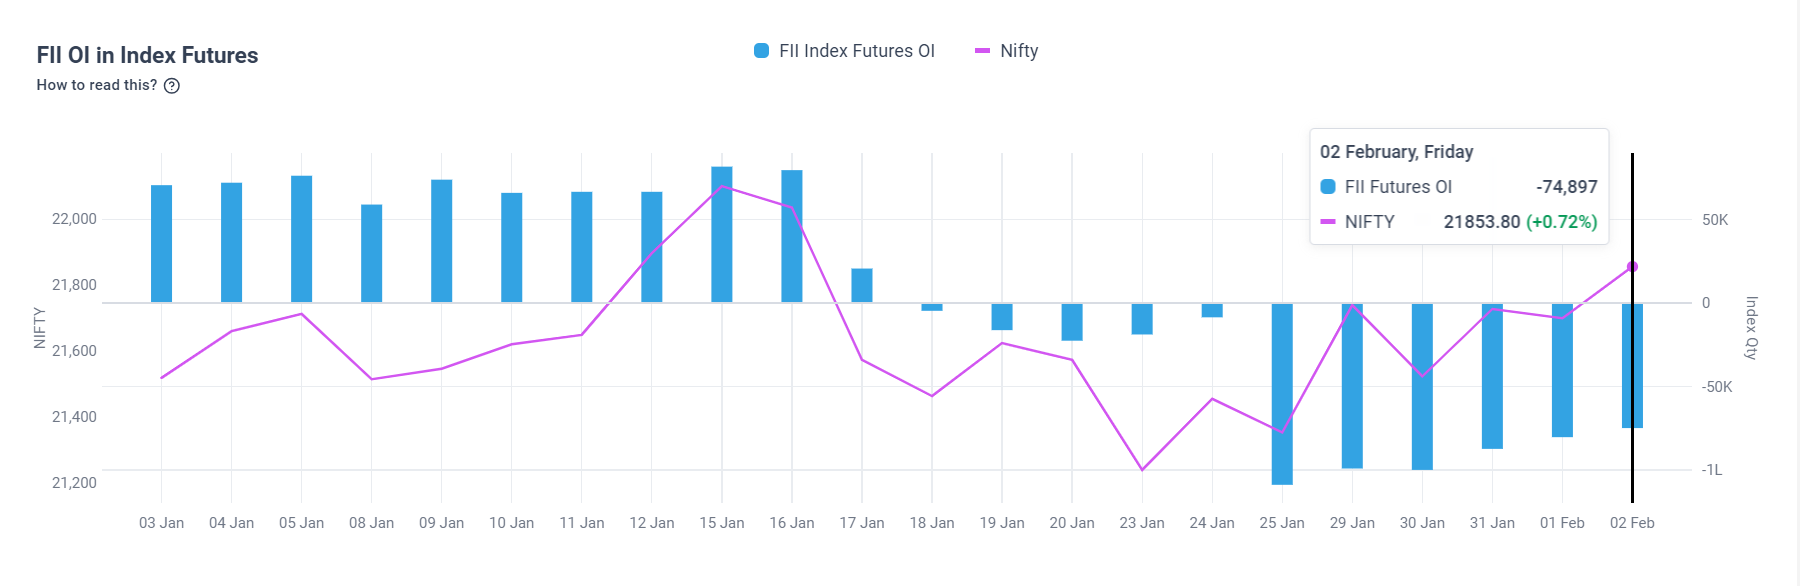
- Net Future OI change = have dip to -74K , Improved.
Open Interests
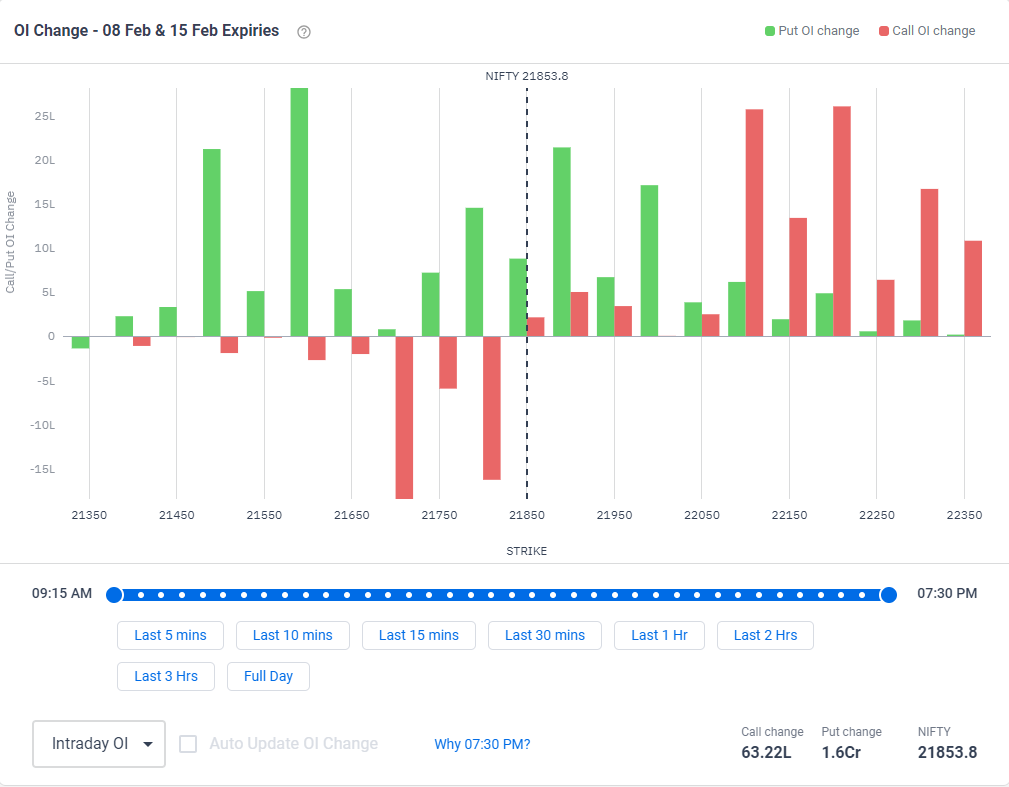
Observations:
OI data suggest market to remain volatile, No Clear Horizon is visible.
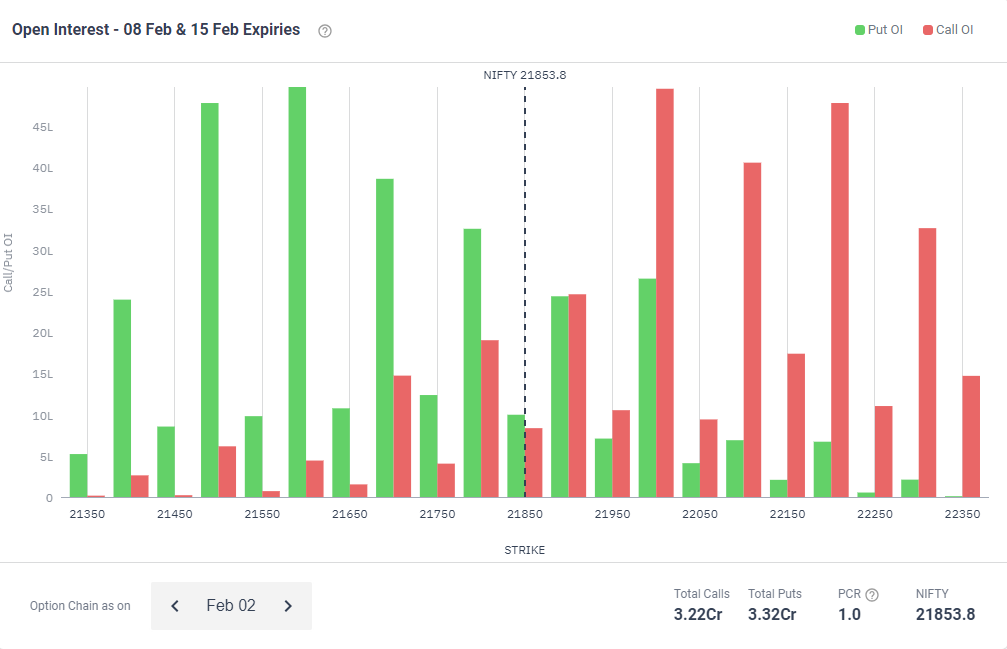
Nifty OI
- Max OI Calls:: 2200 , 0.22 Cr
- Max OI Puts:: 21600, 0.22 Cr
- PCR:: 1.0
Note:: OI suggests strong support at 21600 , and a Resistance at 22000. Likely to remain volatile and range bound.
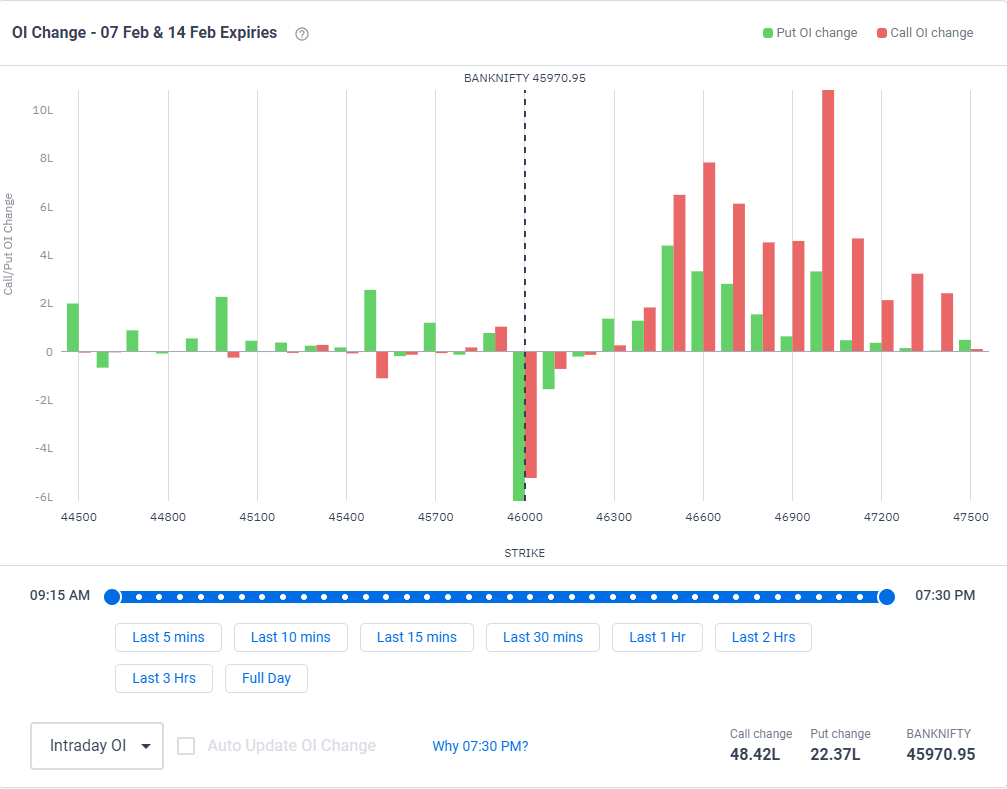
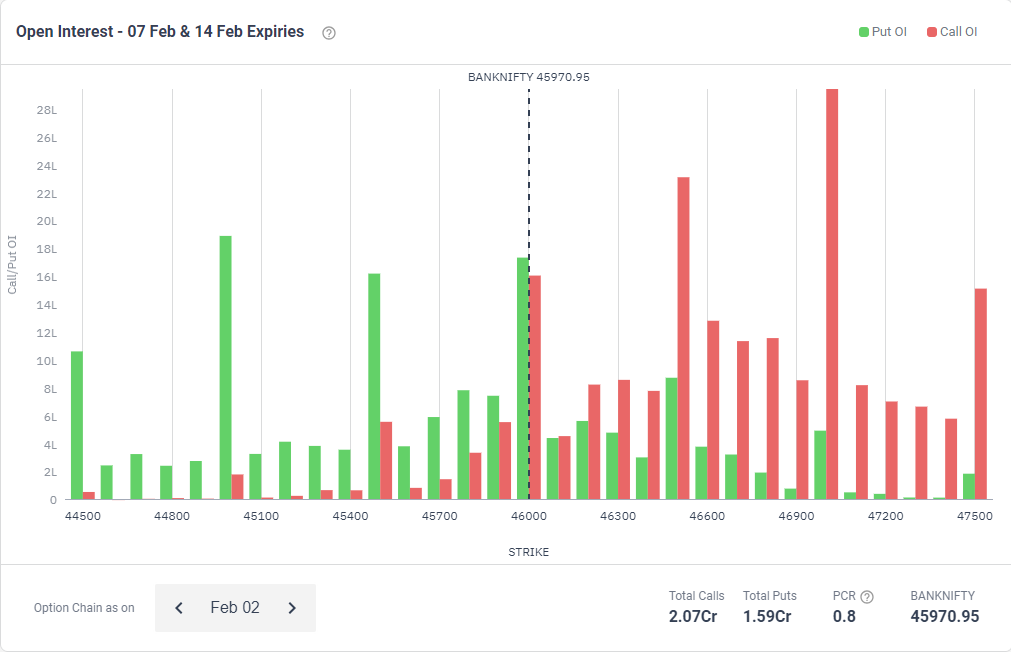
Banknifty OI
- Max OI Calls:: 47000 , 0.30 Cr
- Max OI Puts:: 45000, 0.19 Cr
- PCR:: 0.8
Note:: OI suggests a support at 45000 , and Resistance at 47000. Likely to remain volatile and range bound.