Chart Analysis for the Week, 5th February, 2024
Charts , Weekly
NIFTY 50
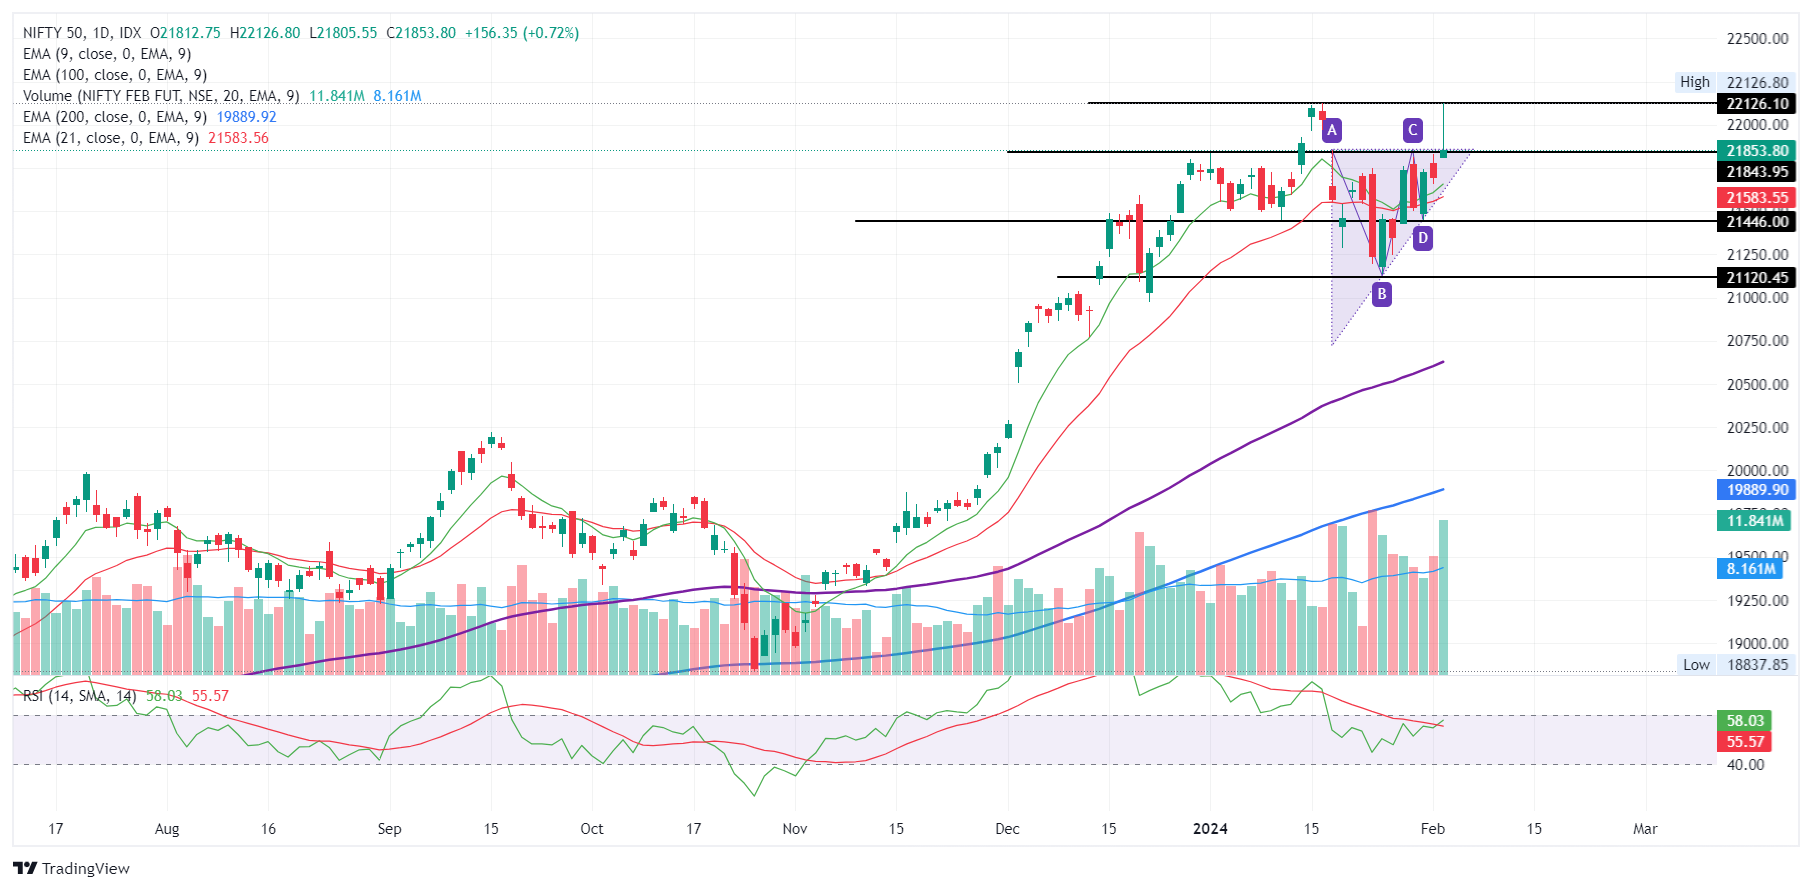
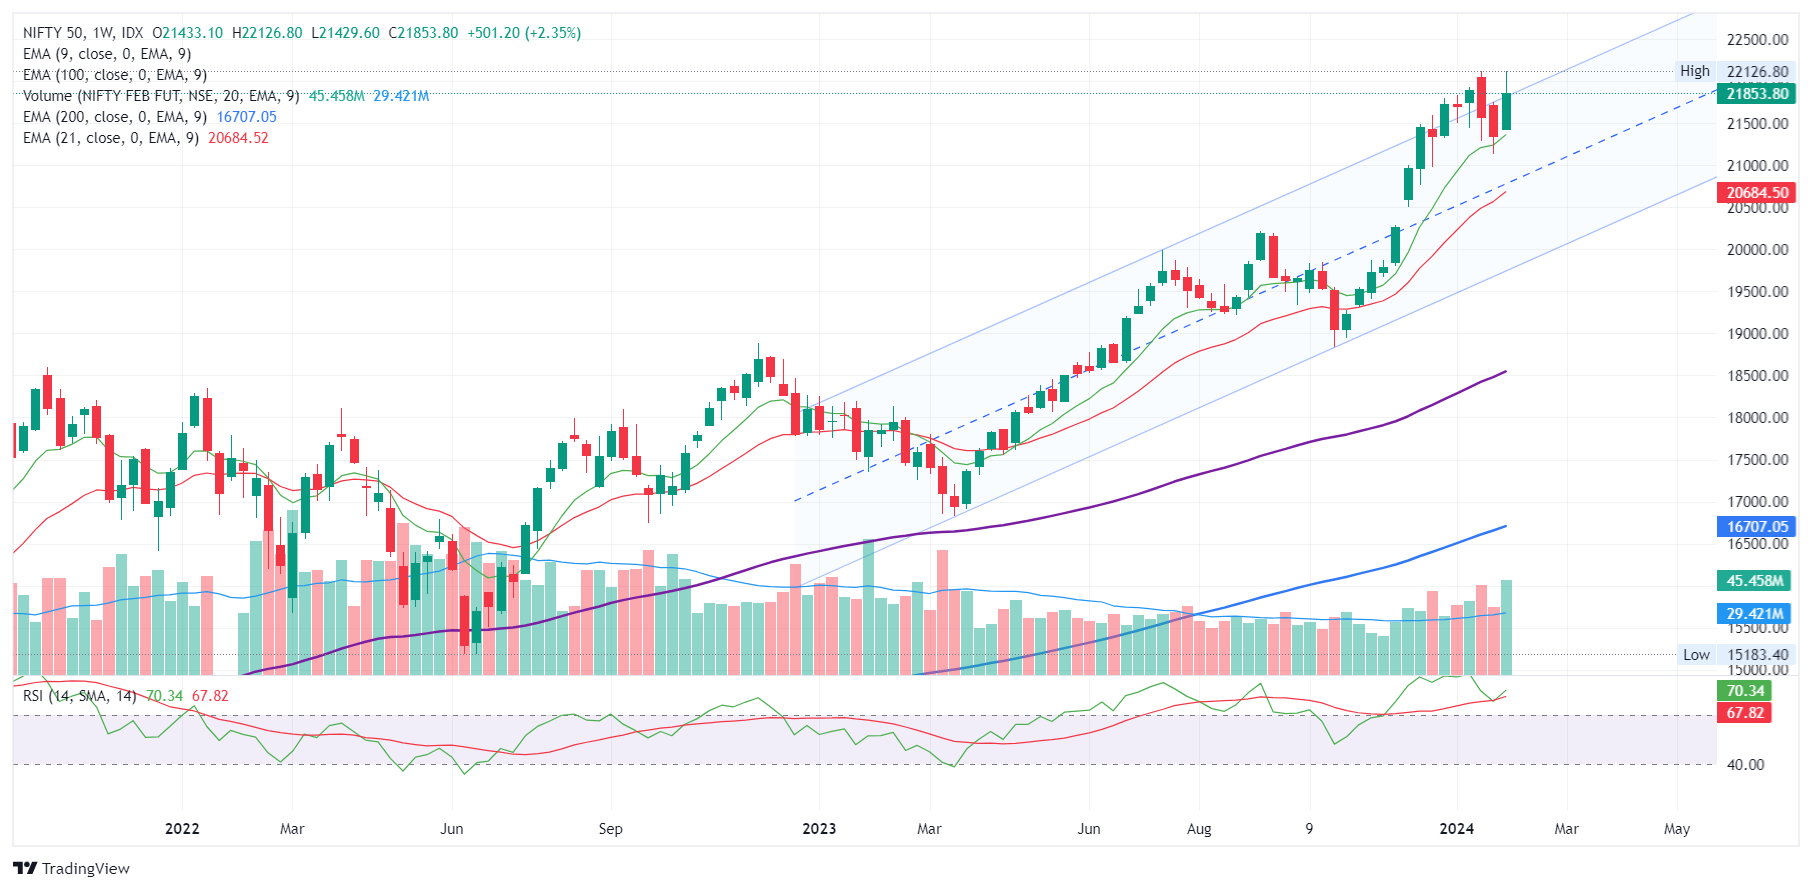
View :
On a weekly chart after two back to back weekly correction, week formed a bullish candle and tested the all time high.
After a good positive price action, and on Friday there was profit booking seen forming an inverted hammer. No clear convincing direction, but looks bullish as of now.
Important Levels
- Resistance – 21,900 – 22,000
- Support – 21,650 – 21,750
- No trading Zone – 21,650 – 21,750
BANKNIFTY
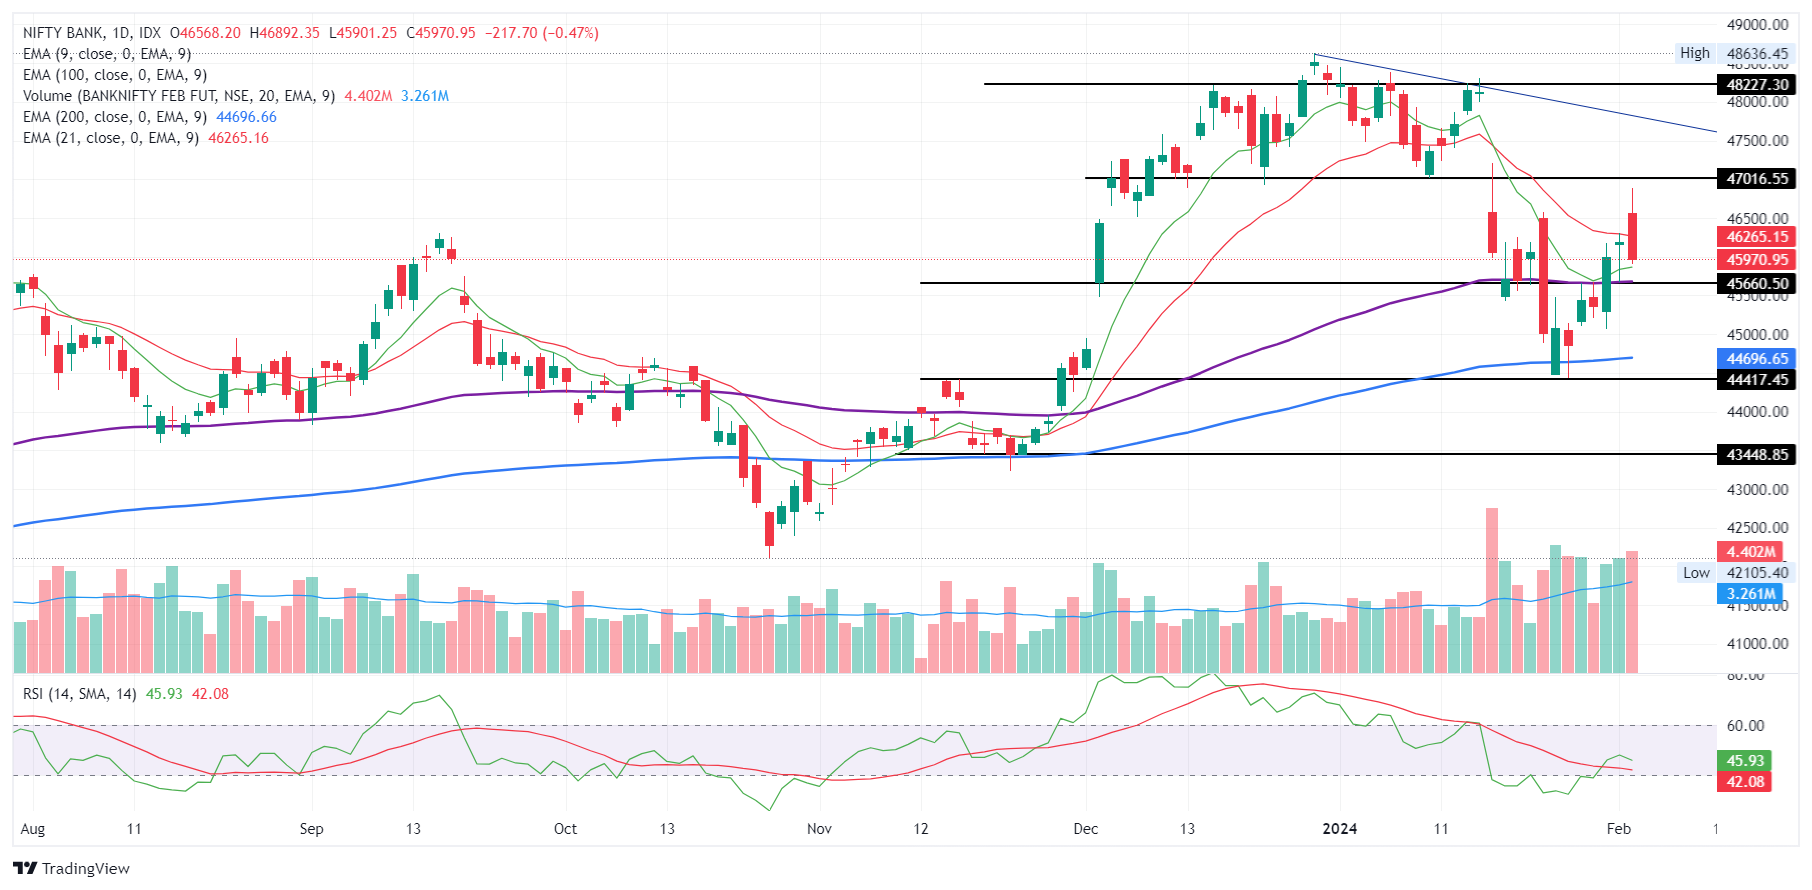
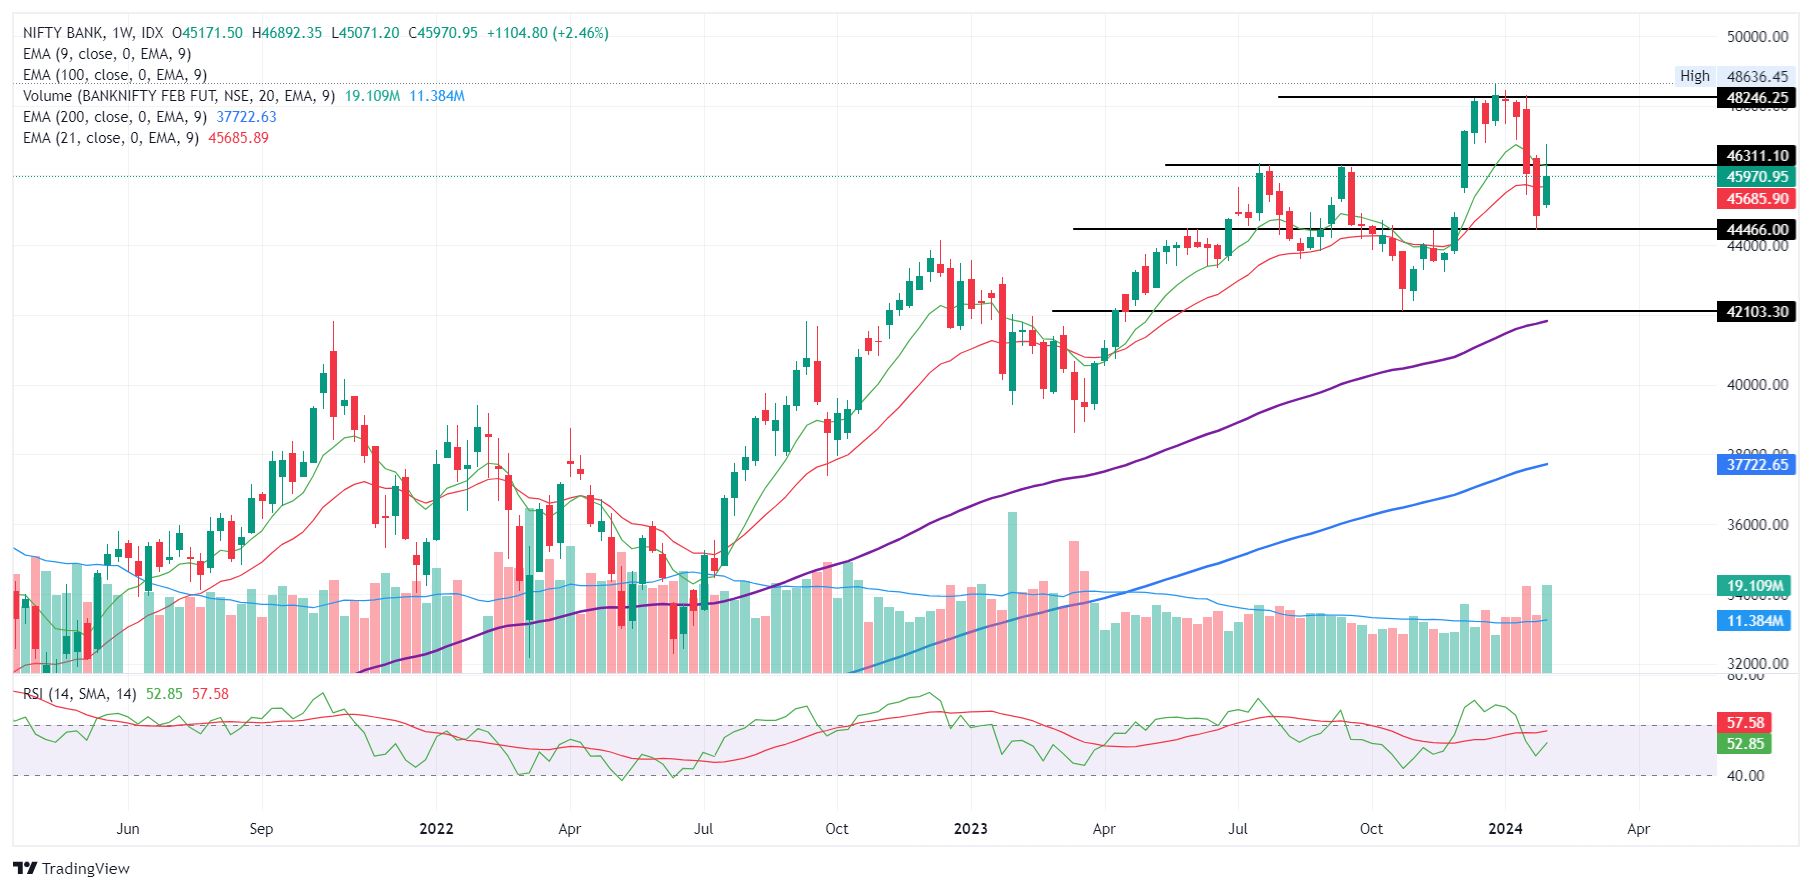
View :
Banknifty had been continuously falling for past few weeks, finally some recovery seen and formed a Bullish Harami pattern.
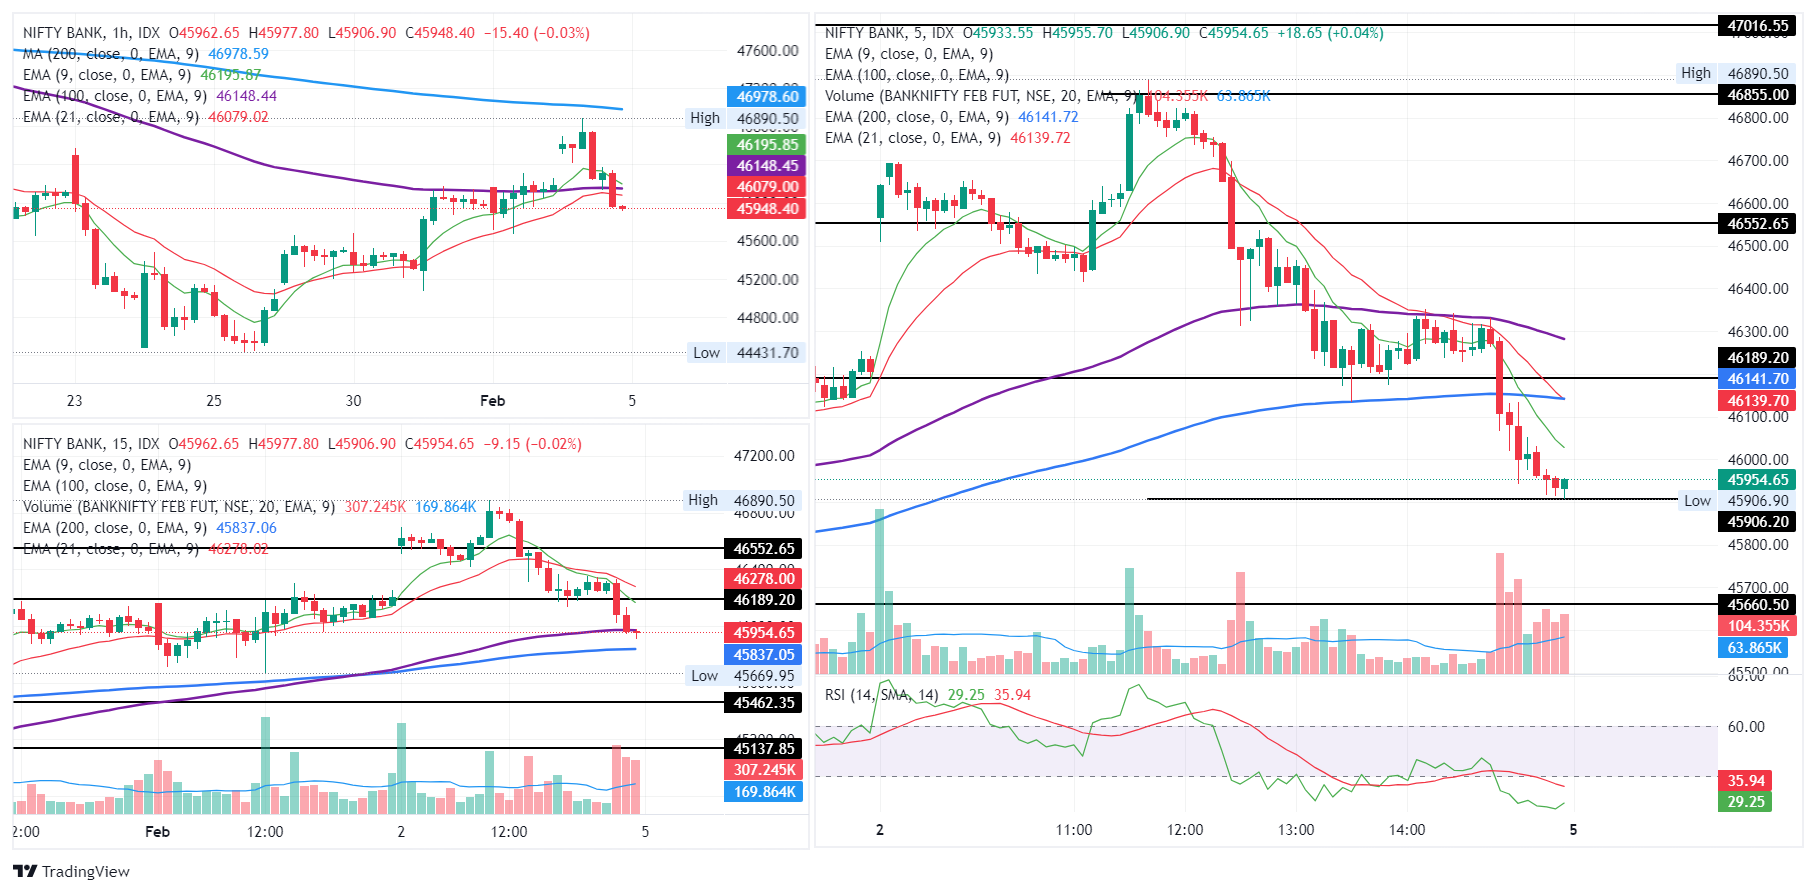
On daily time frame, after a Doji formation, some strong profit booking from top observed – forming a bearish engulfing candle. Needs to be cautious a bit for now.
Important Levels
- Resistance – 46,700 – 46,900
- Support – 44,300 – 44,500
- No trading – 45,400 – 45,500