4th Week 2024 – The Weekly Chart
Analysis , Charts , Weekly
:: NIFTY 50
View :
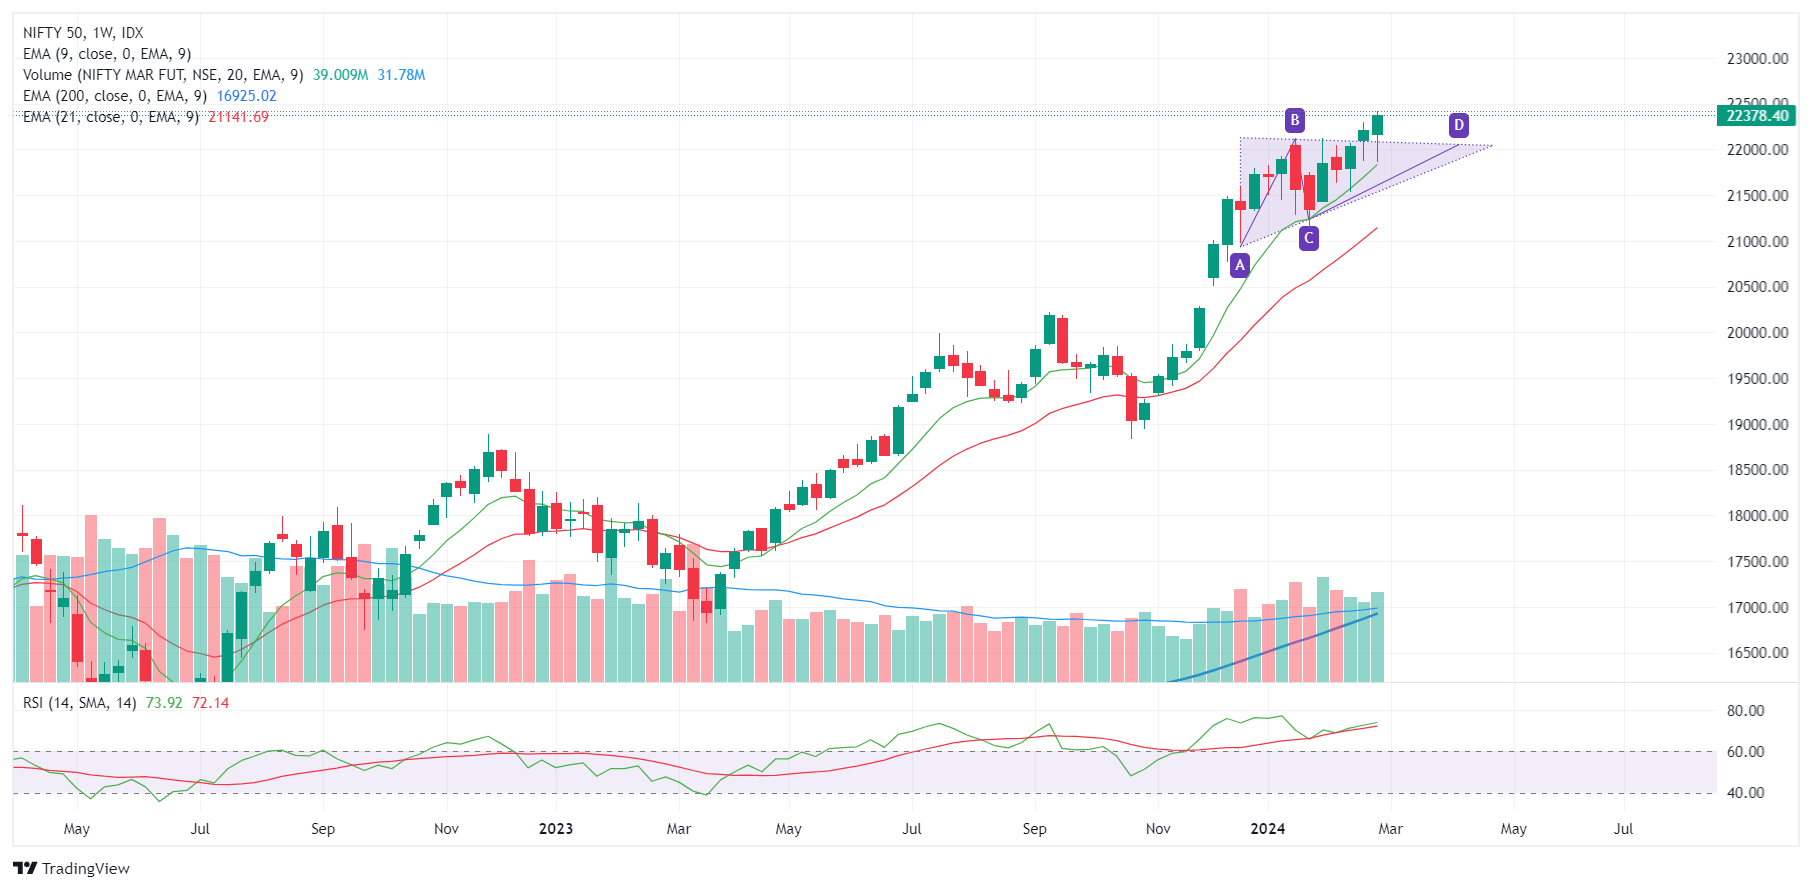
A bullish triangular flag pattern is evidently broken on a weekly time frame. And NIFTY is sitting right now at all time high. Looks like more upside is possible.
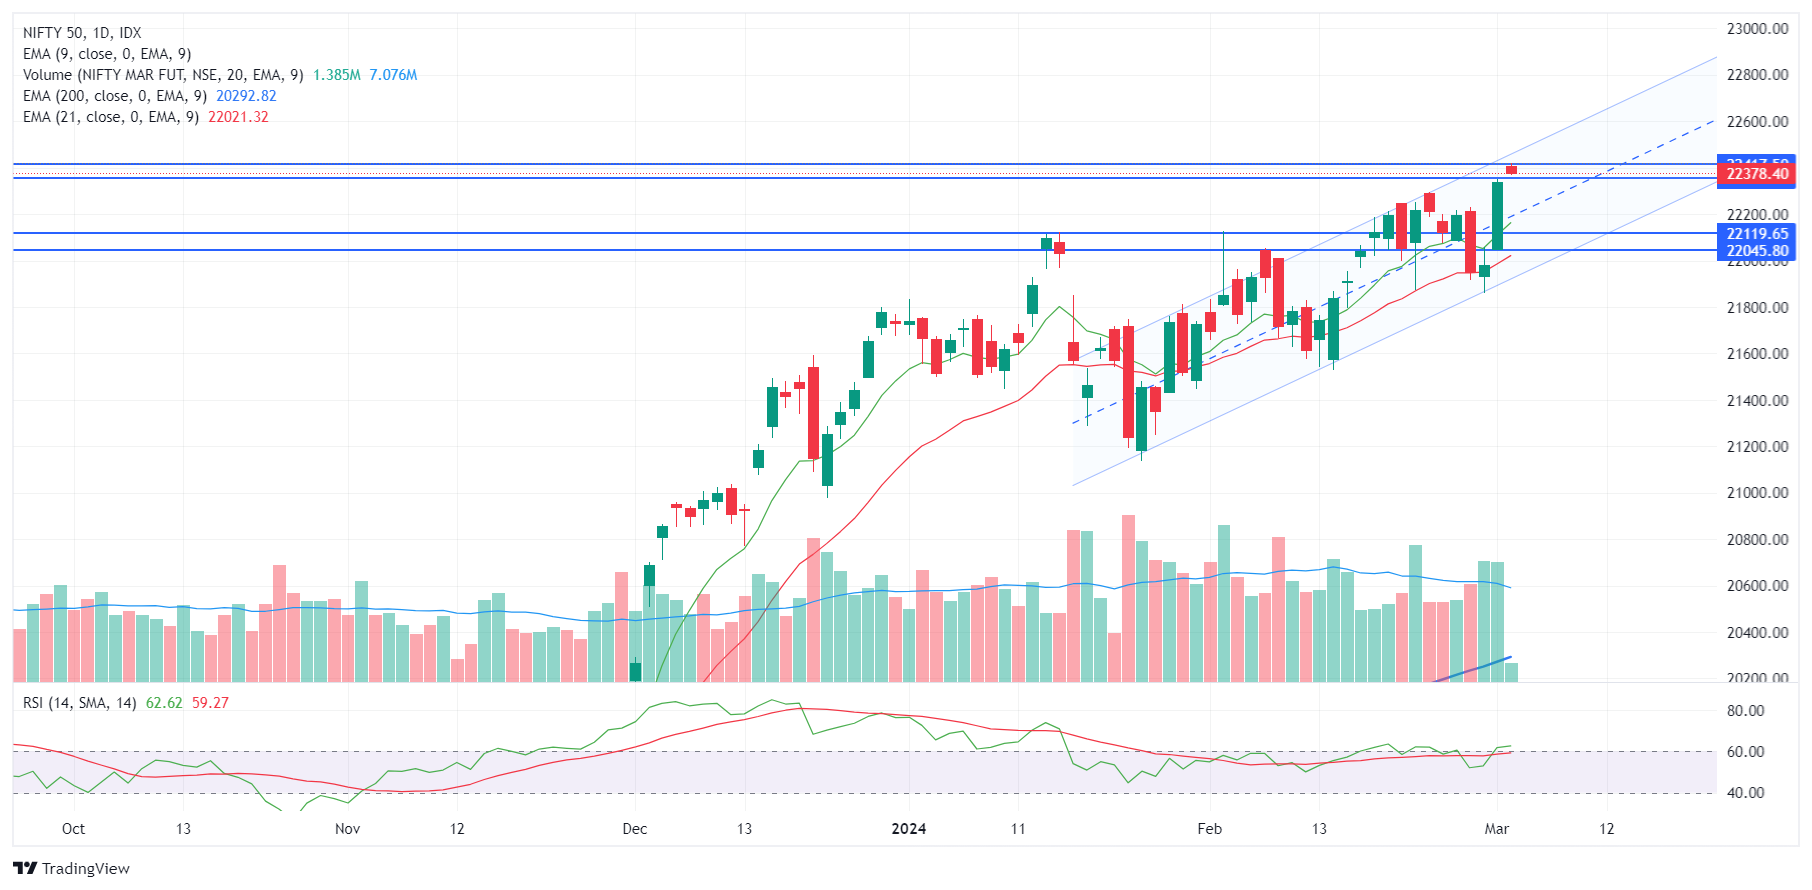
On a daily time frame after a bullish reversal, which has been confirmed. Market is at an all time high.
Important Levels
- Resistance – 22,400- 22,800
- Support – 22,000 – 22,350
- No trading Zone – 22,000 – 22,350
BANKNIFTY
View :
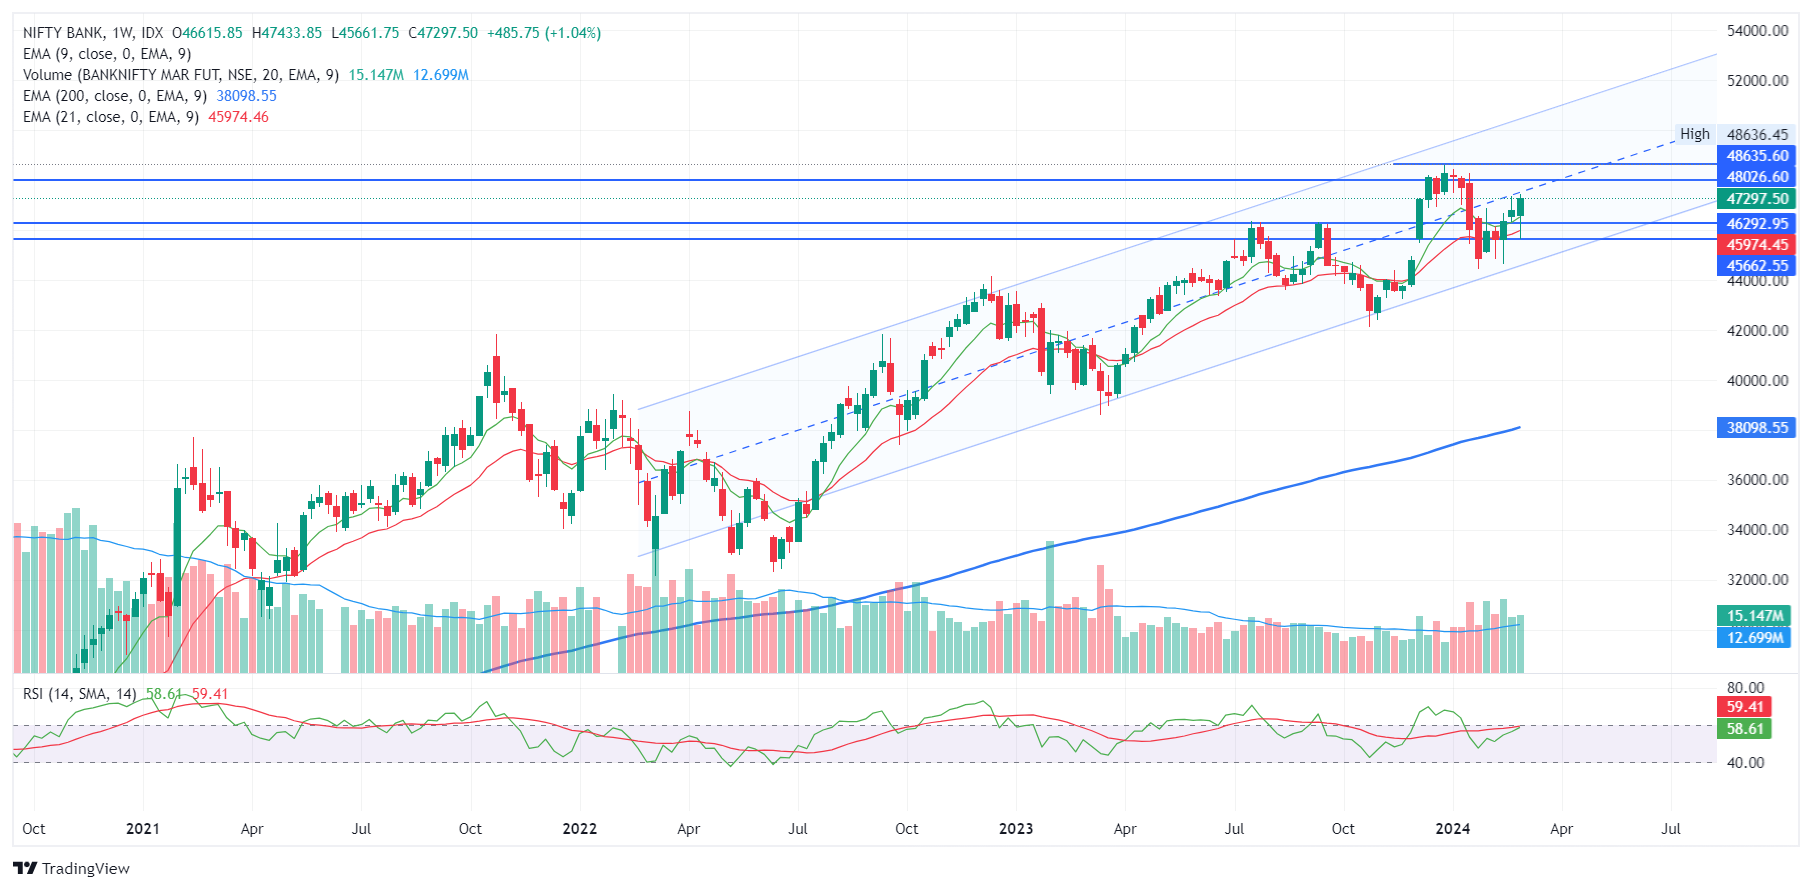
In the weekly chart clearly it is still following the bullish channel, taken a support at the base of the channel.
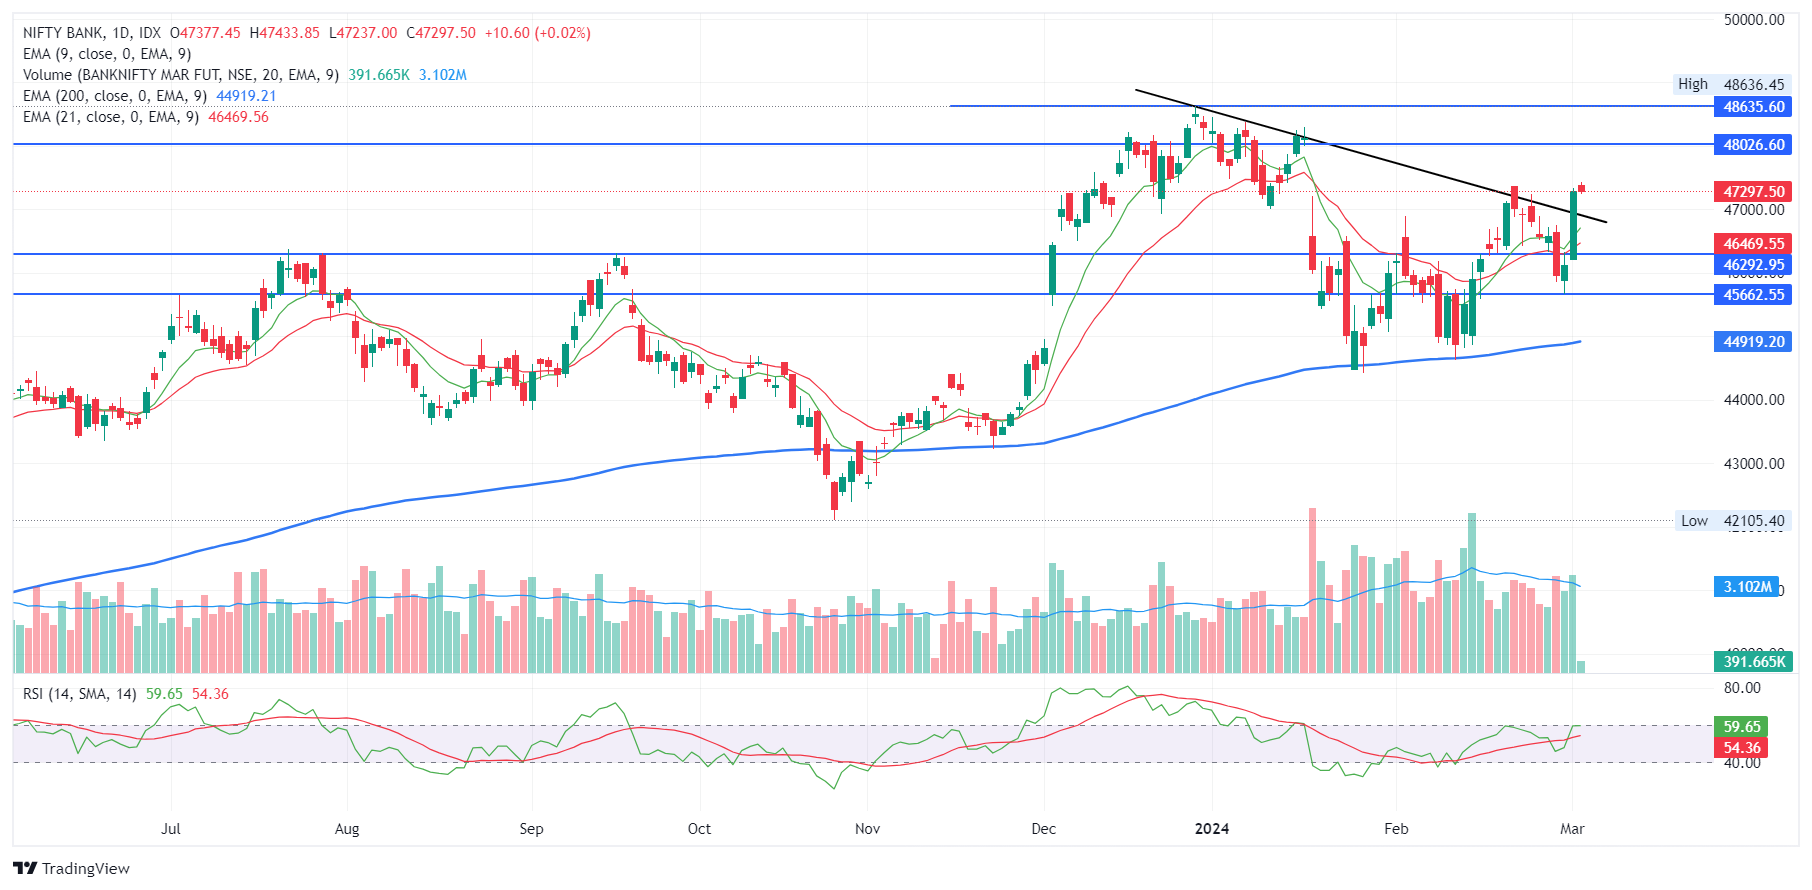
On the daily time frame, a trendline break out has been successful and it has been confirmed.
Important Levels
- Resistance – 47,000 – 47,100
- Support – 46,500 – 46,600
- No trading – 46,500 – 46,600