26th February, 2024 – Technicals
Analysis , Charts , Information , Weekly
:: NIFTY 50

View :
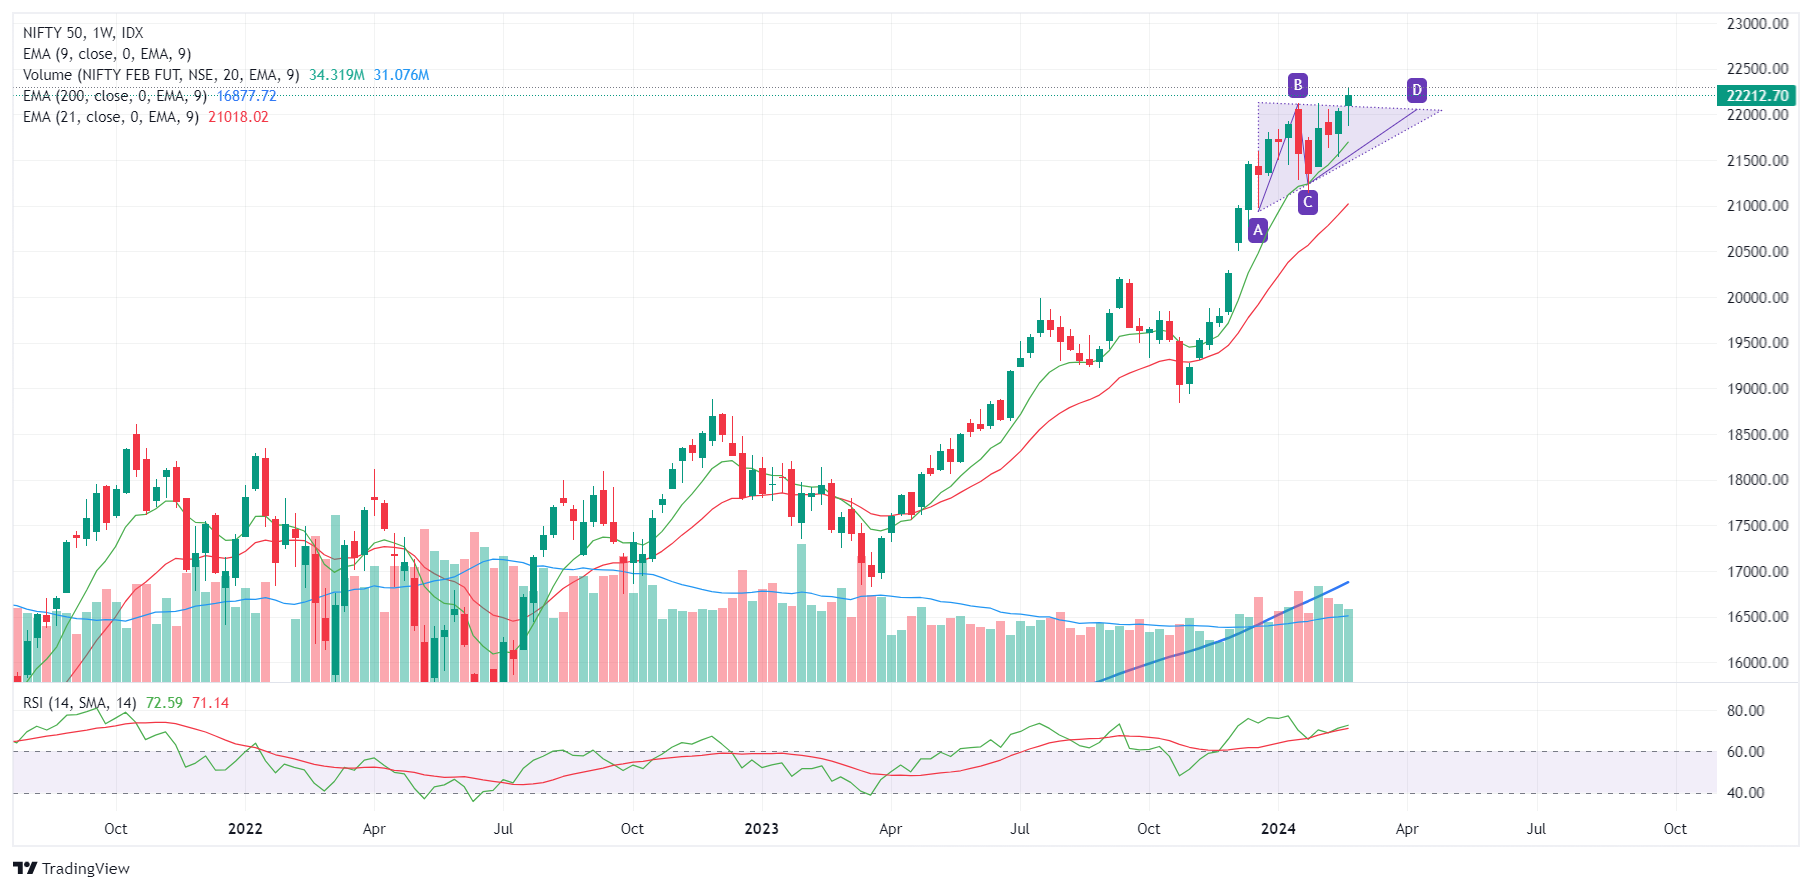
A bullish triangular flag pattern is evident on weekly time frame, which has been confirmed. Looks like more upside is possible.
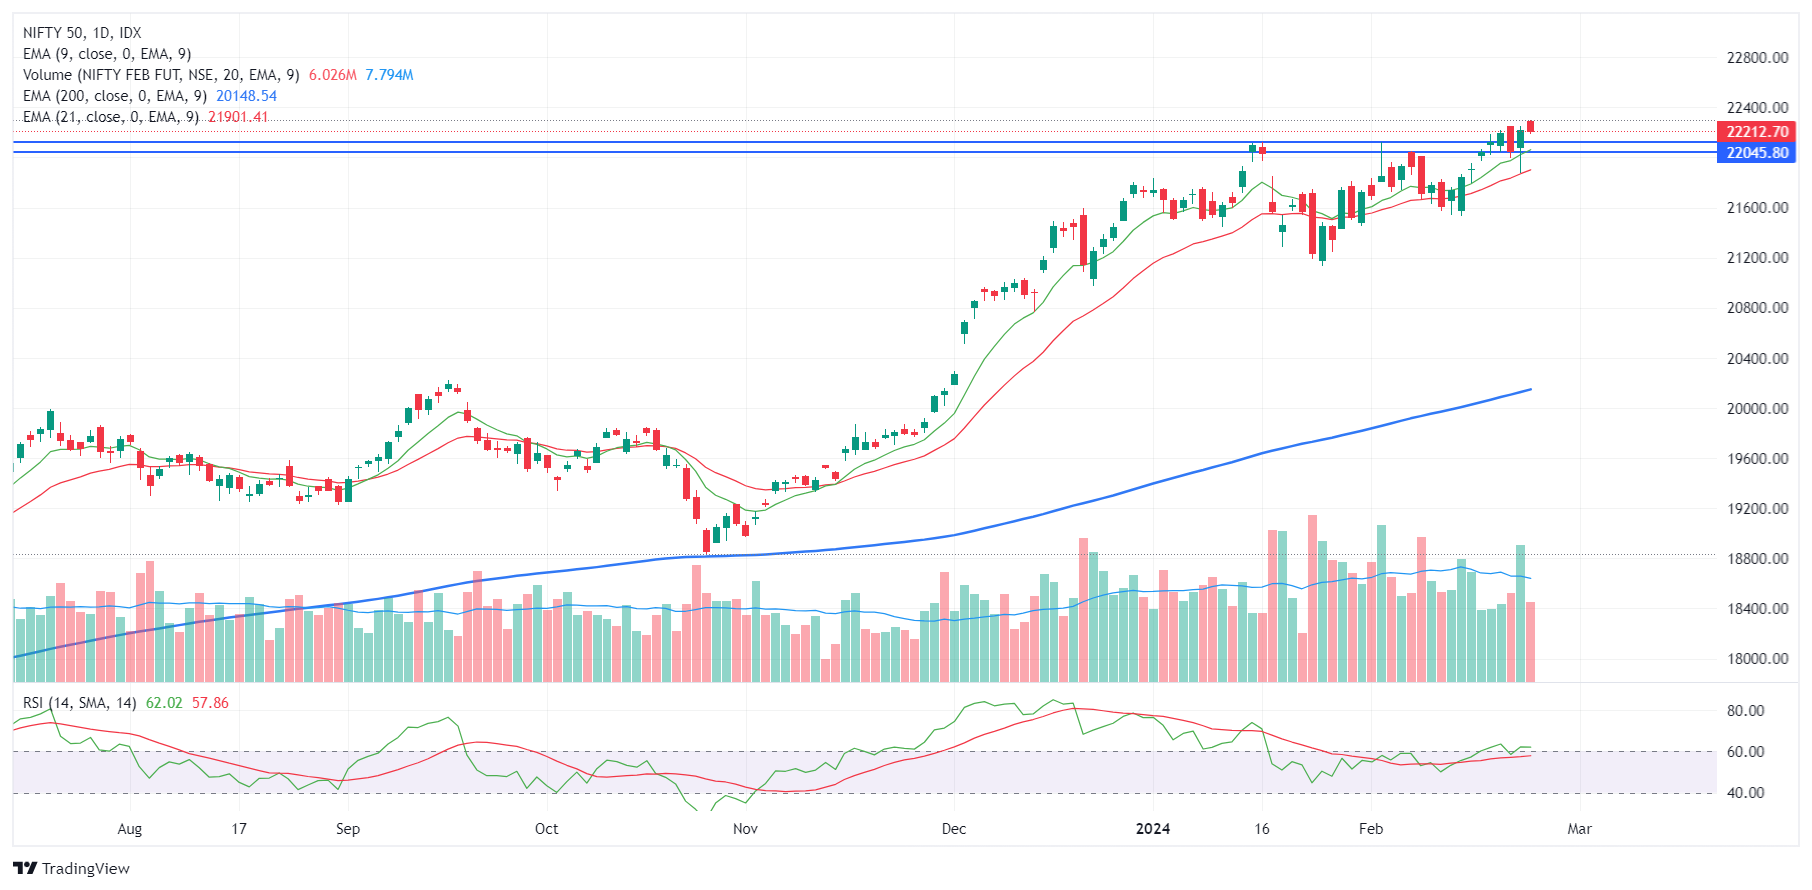
On a daily time frame after a bullish move and a pause, NIFTY tested new all time high and traded rangebound in the last session, hence a good sign for more upside moves.
Important Levels
- Resistance – 22,200- 22,300
- Support – 22,000 – 22,100
- No trading Zone – 22,000 – 22,100
BANKNIFTY
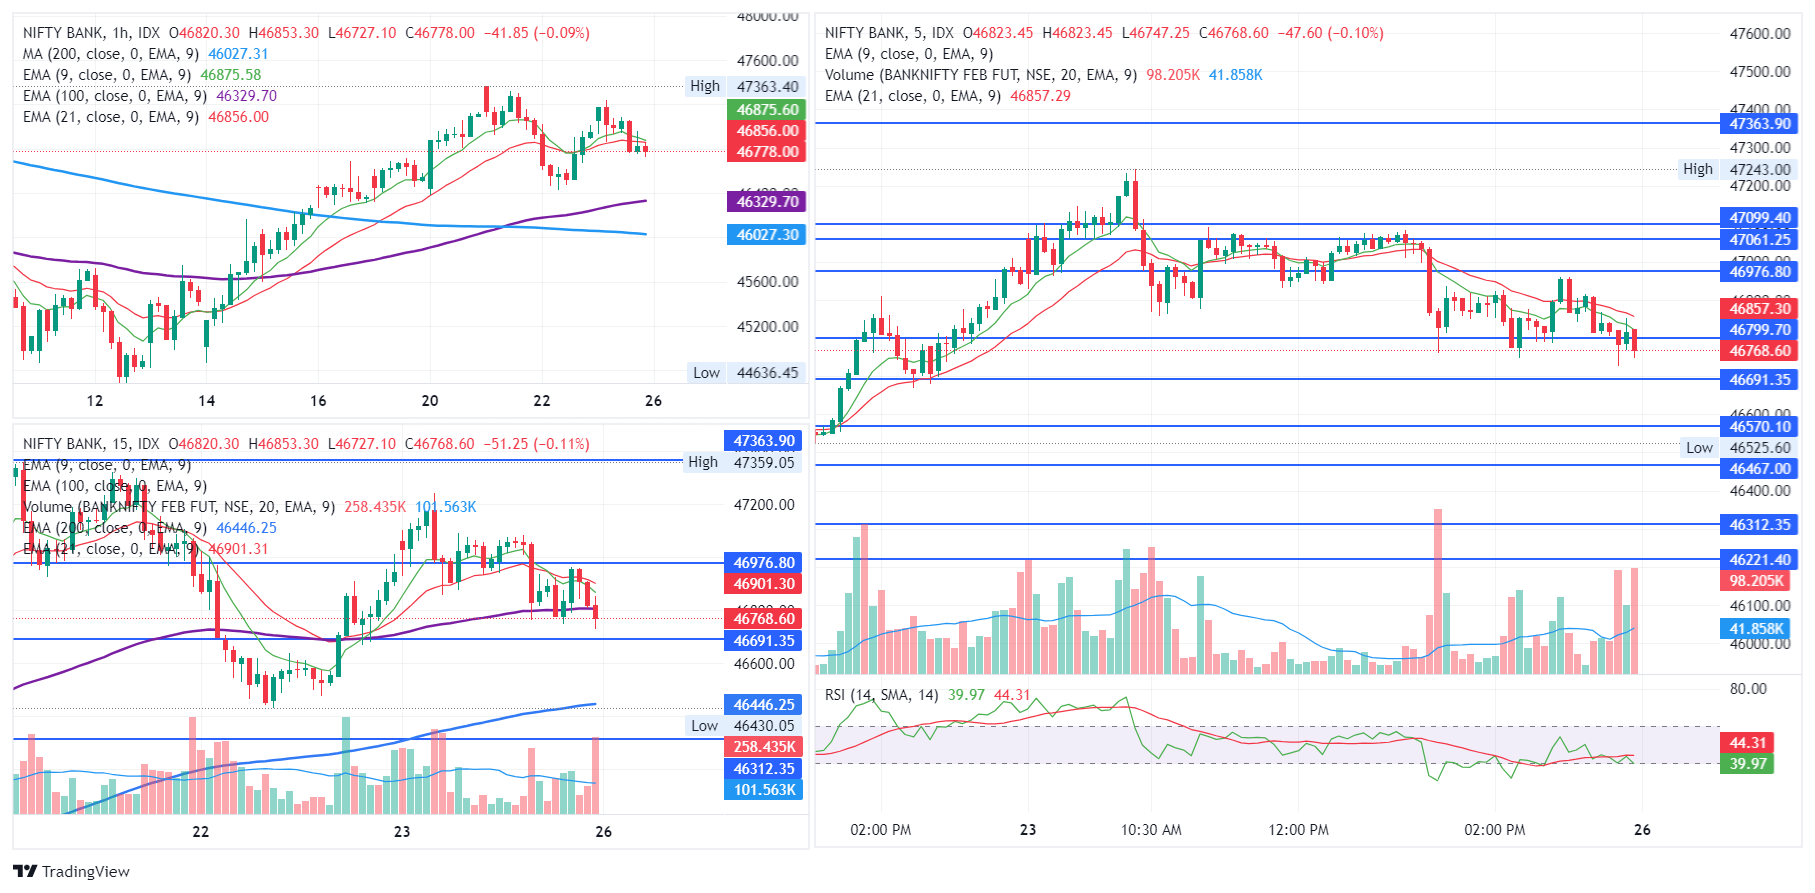
View :
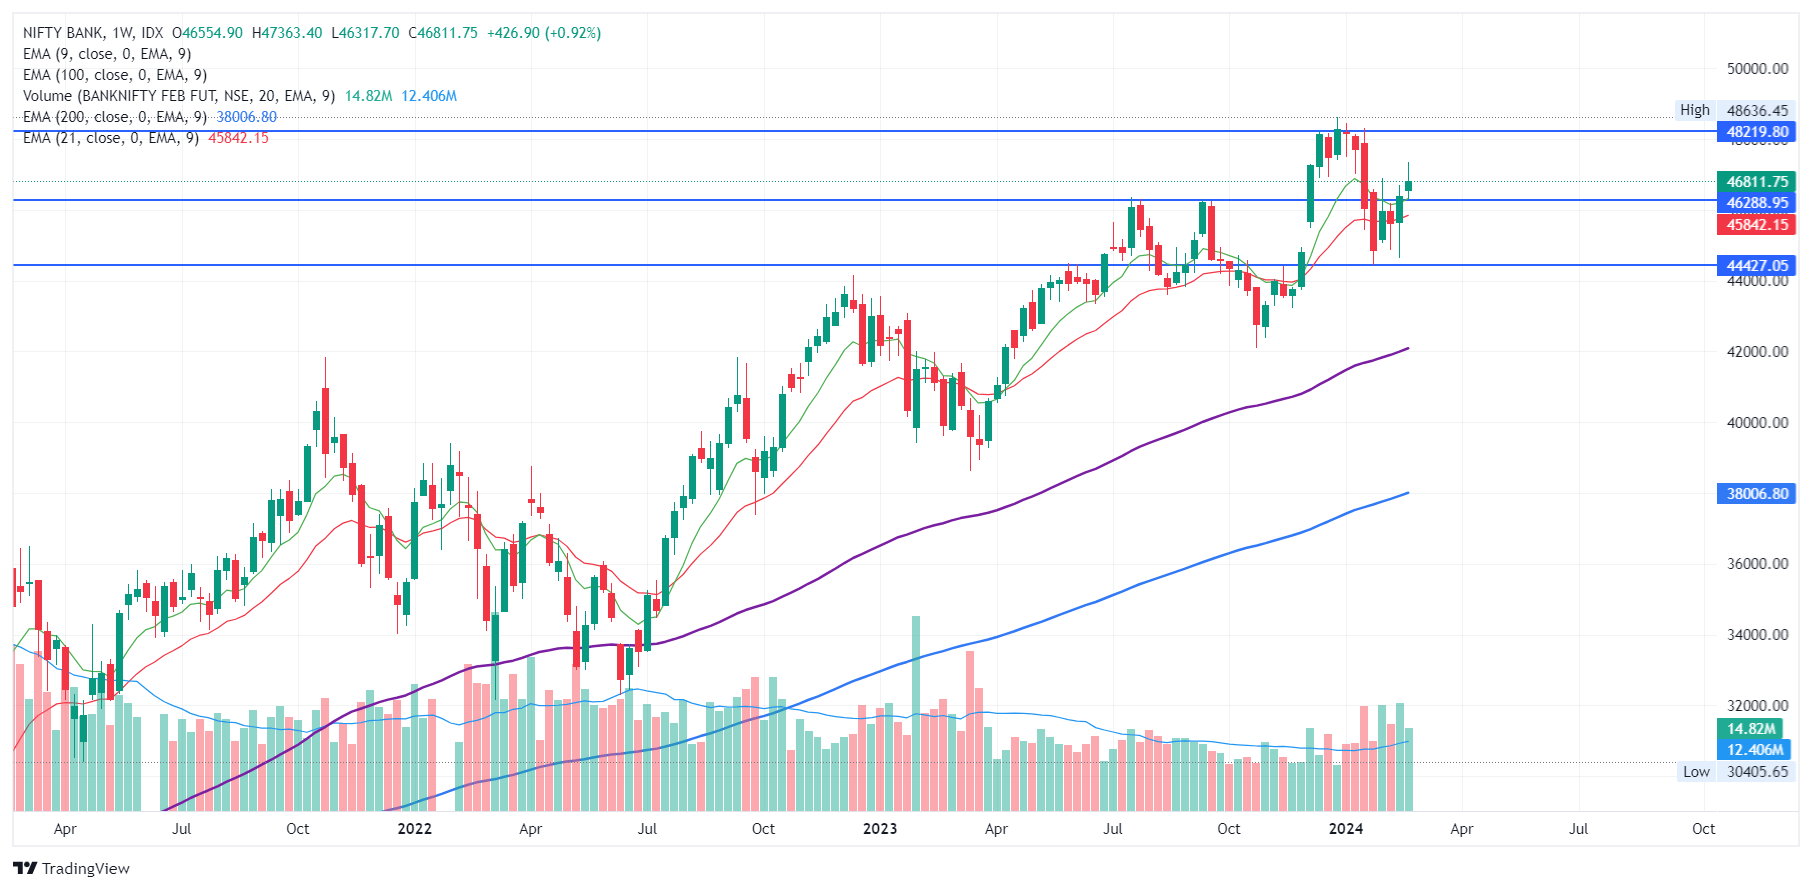
In the weekly chart after very strong wick at the bottom, a green but indecisive candle is formed last week.
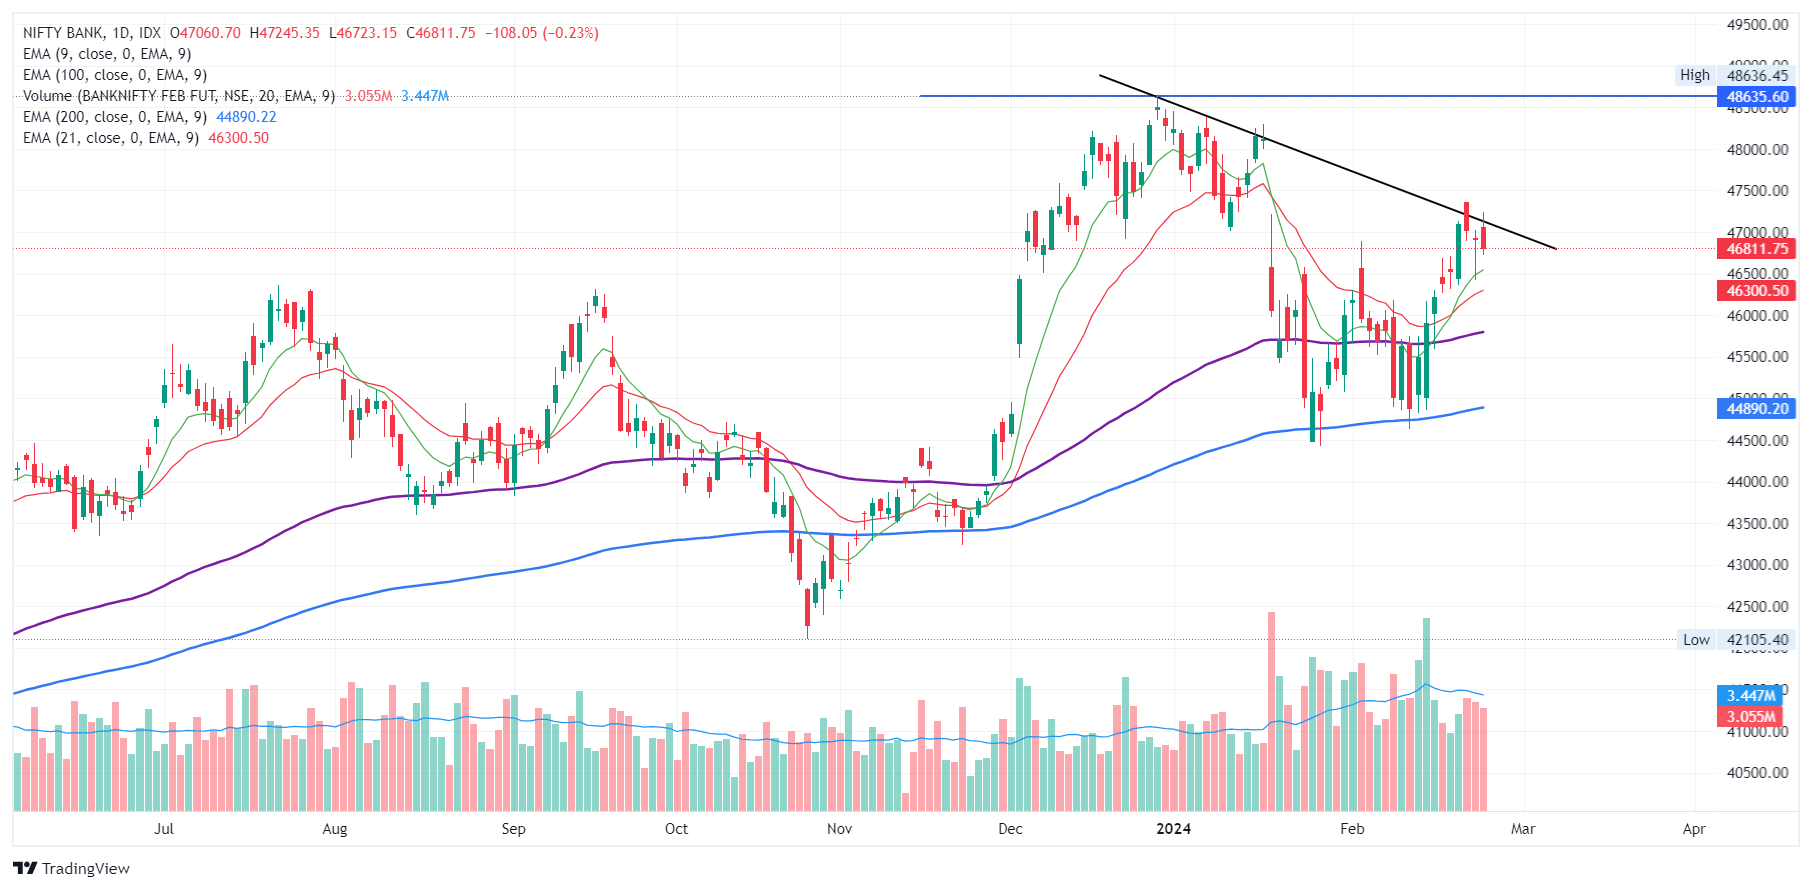
On the daily time frame, a trendline break out fail like candle is formed. Its a wait and watch.
Important Levels
- Resistance – 47,000 – 47,100
- Support – 46,500 – 46,600
- No trading – 46,500 – 46,600