11th March 2024 – Week Chart & Order Flow
Analysis , Charts , Weekly
:: NIFTY 50
View :
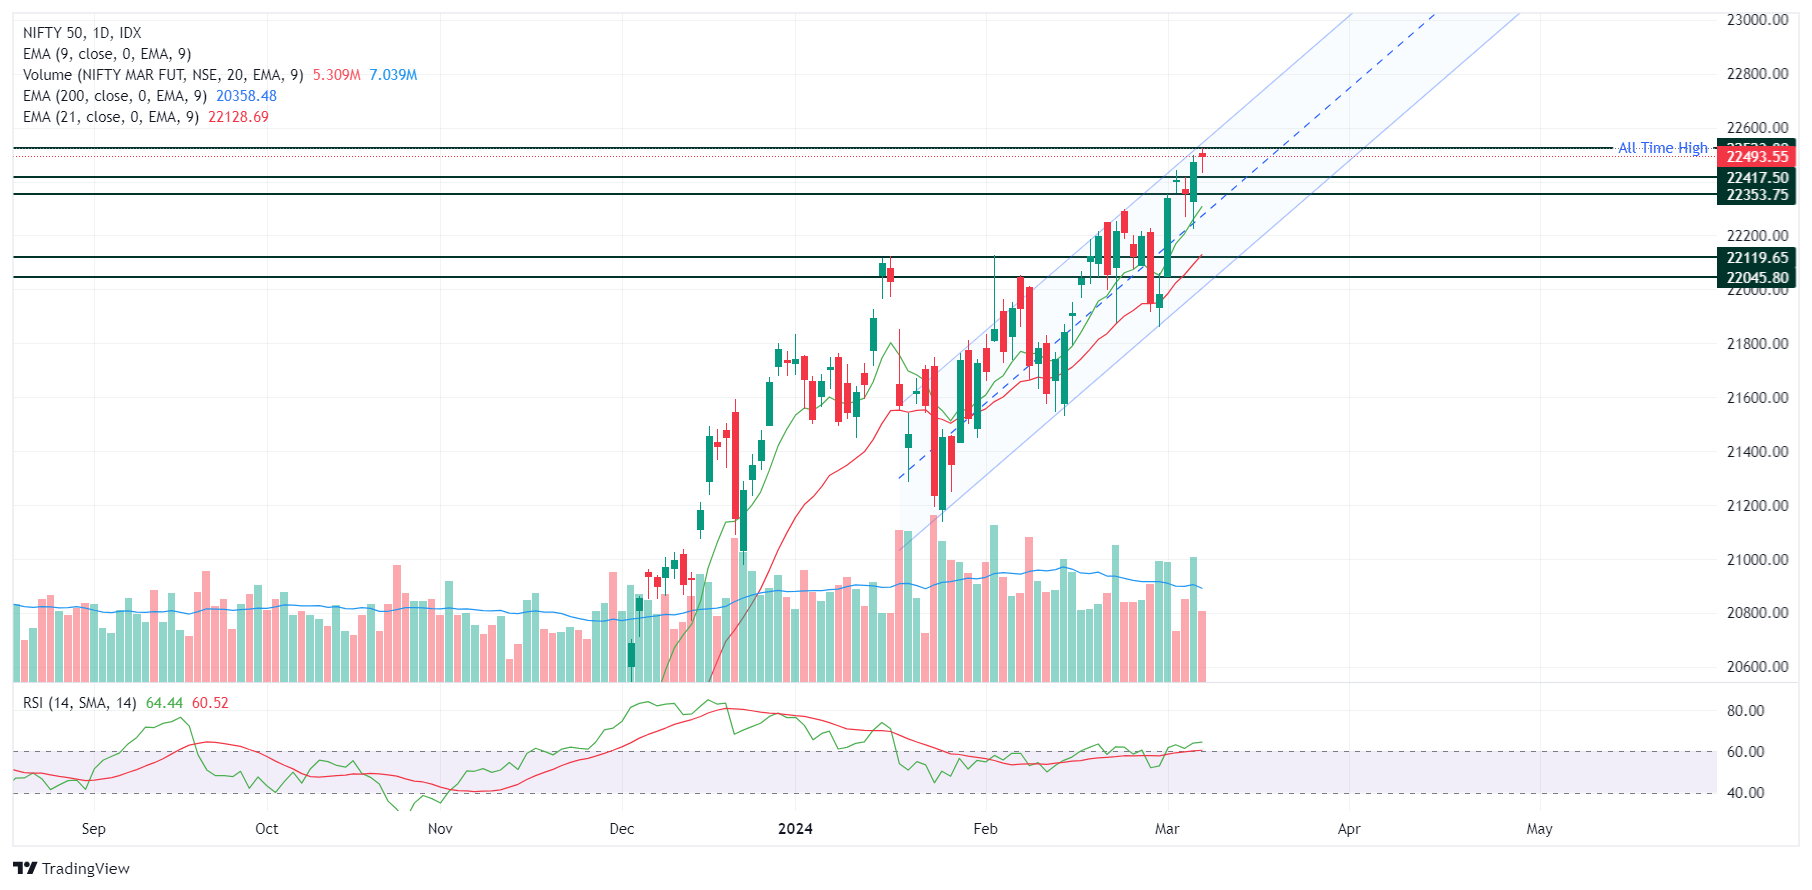
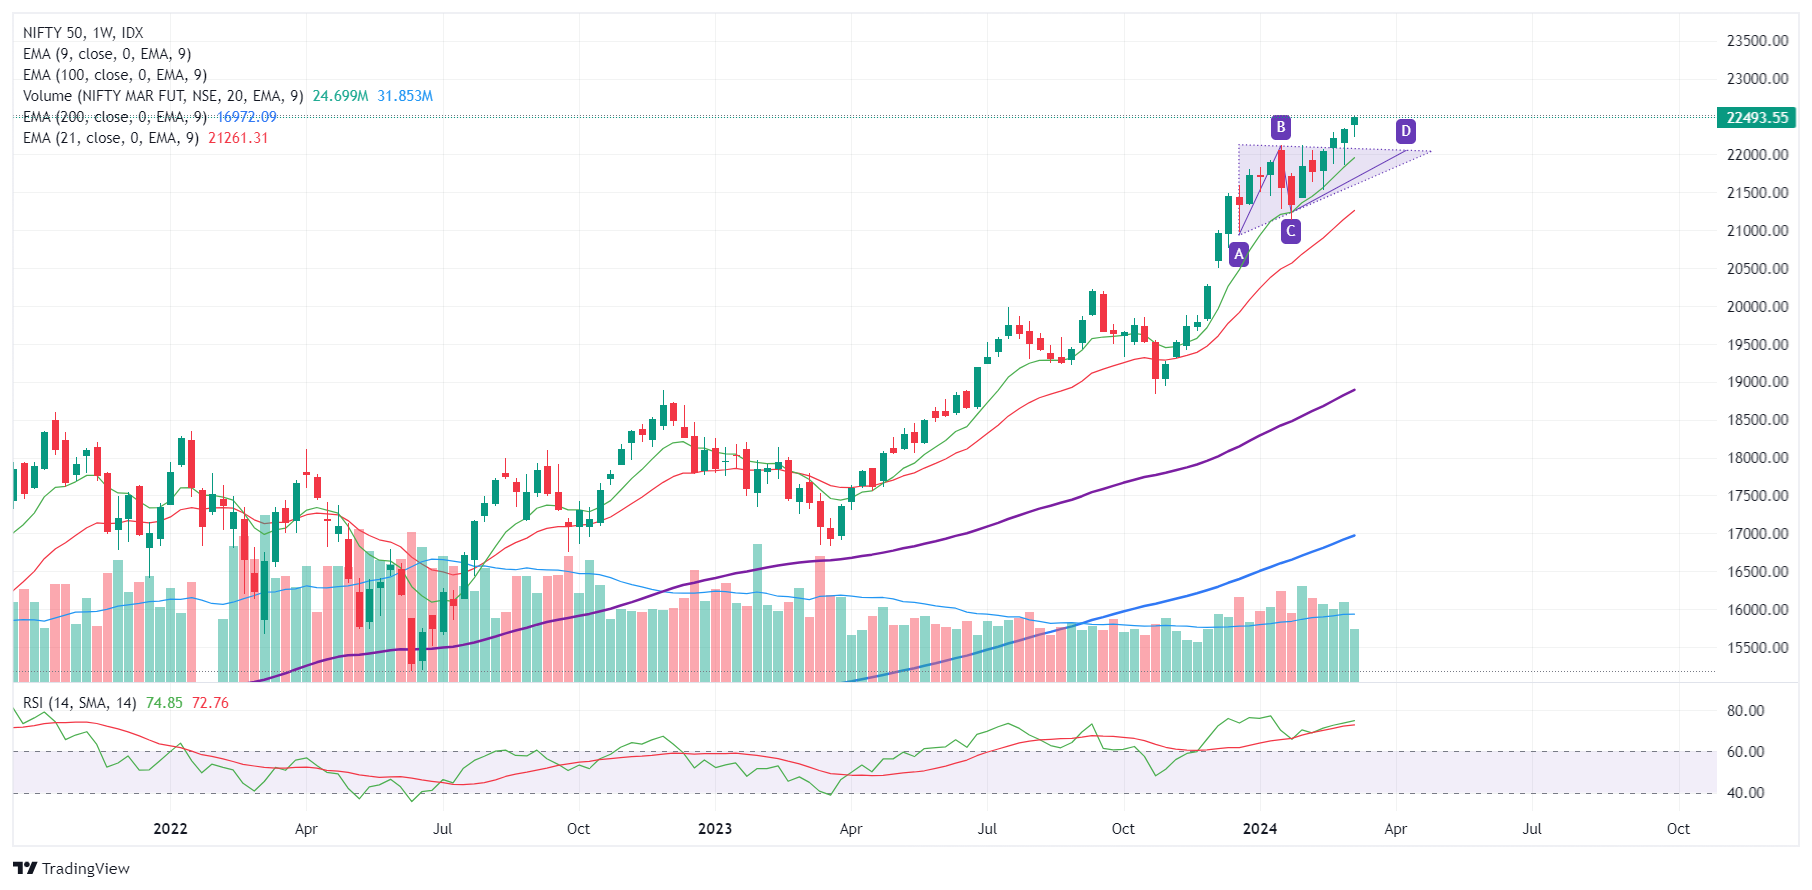
After triangular bullish pattern confirmed, market is continuously moving upwards without. It is best to continue riding with it.
On a daily time frame after a bullish engulfing it is confirmed with Doji like candle, a likely pause, which is good sign to add more momentum to it.
Important Levels
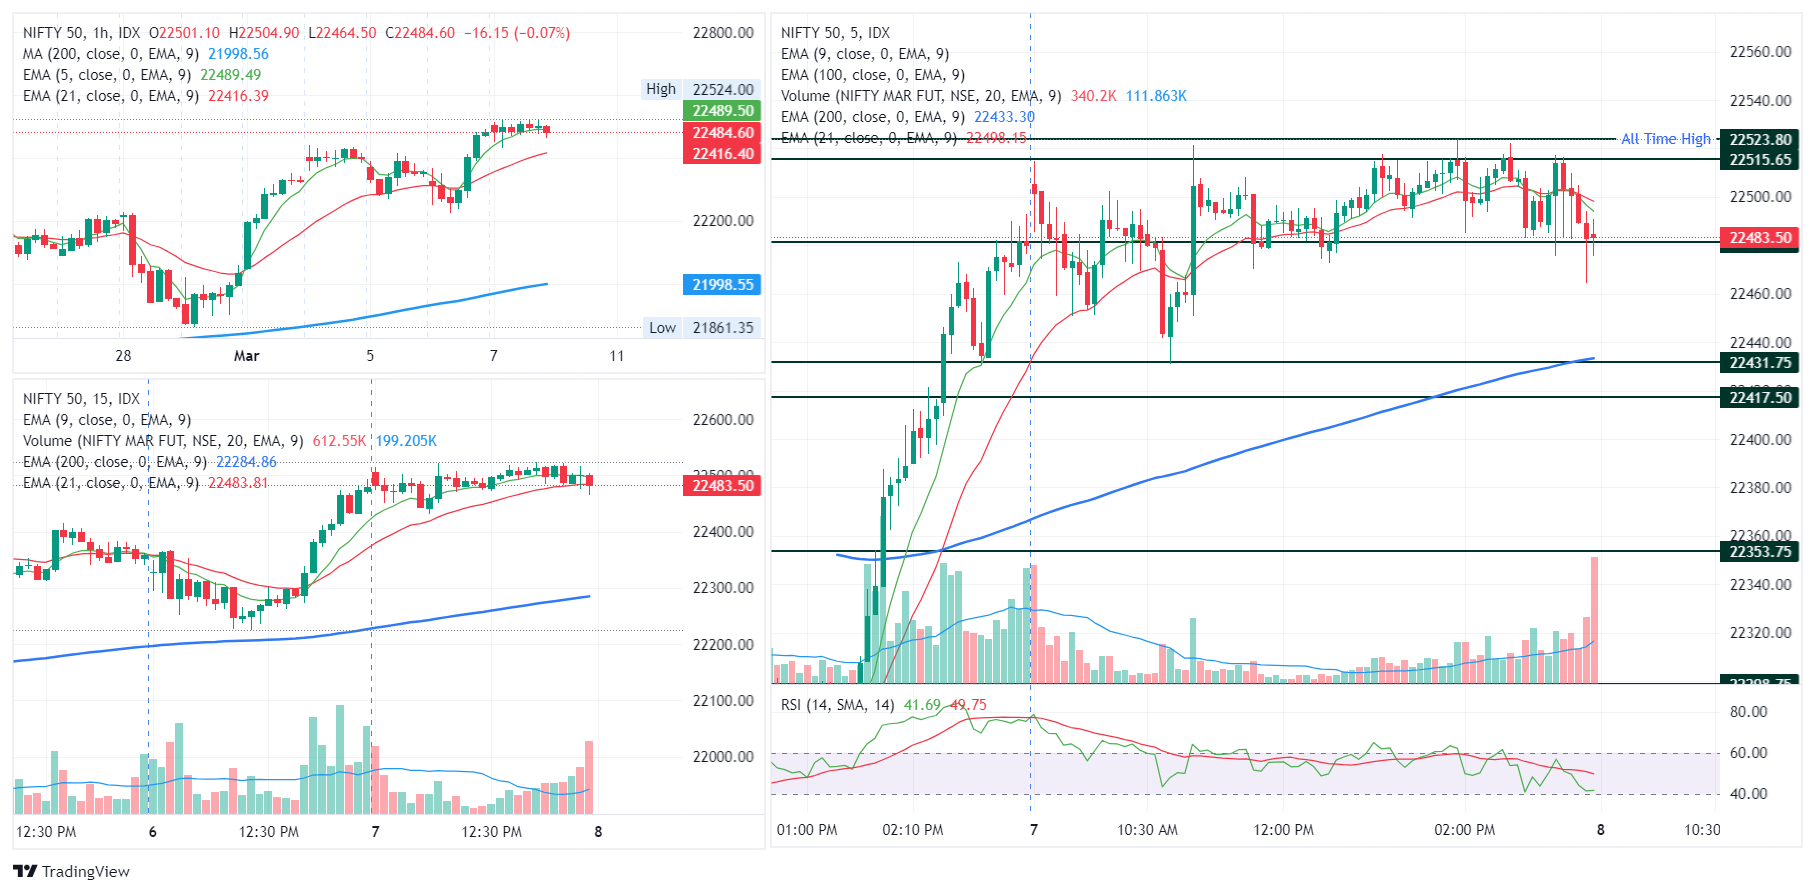
- Resistance – 22,500- 22,800
- Support – 22,300 – 22,400
- No trading Zone – 22,300 – 22,400
BANKNIFTY
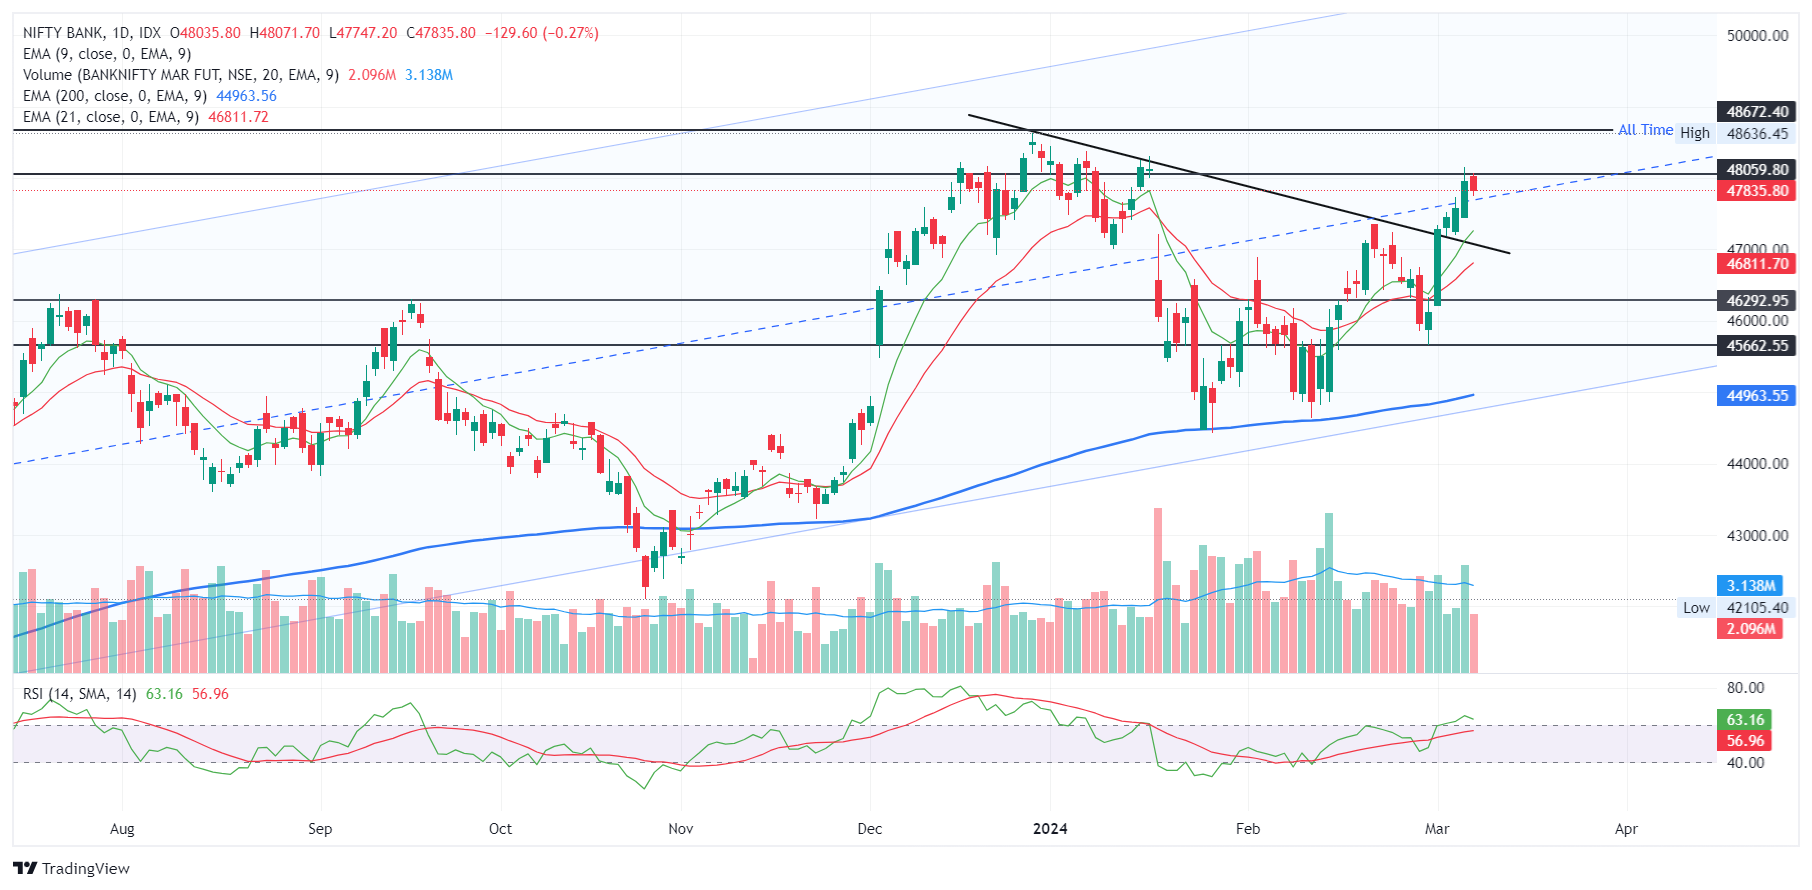
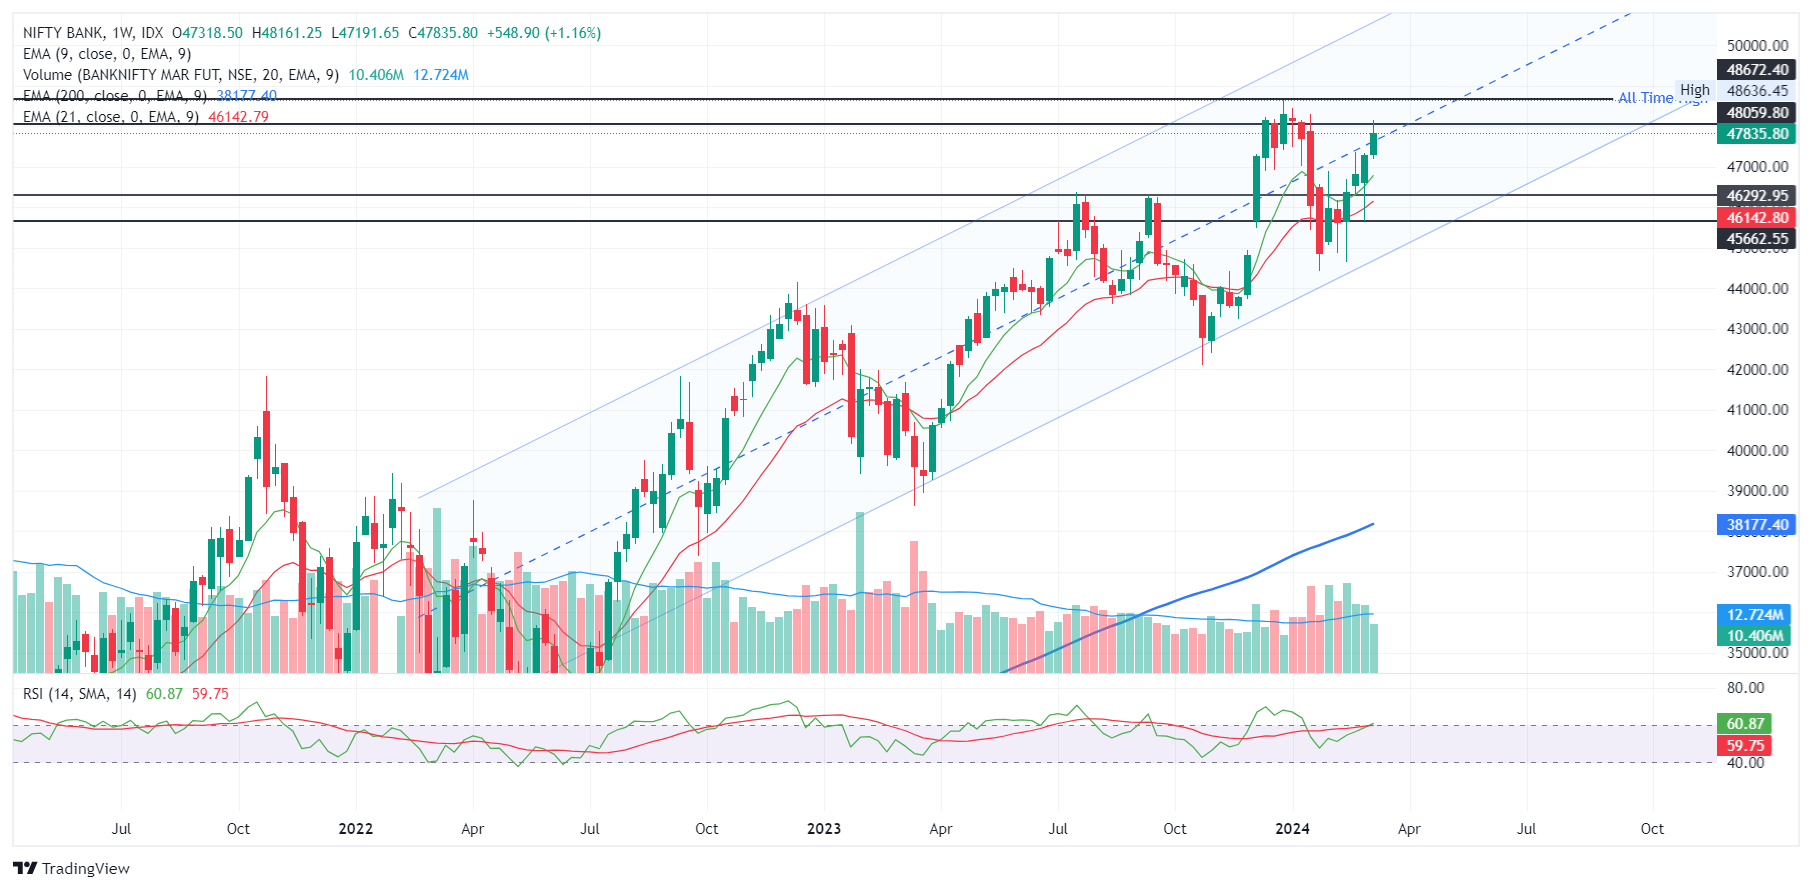
View :
Banknifty has been green for 4(four) back to back weeks. Right now market is near the center line of the Bullish channel, also near a psychological level 48,000. Some exhaustion is expected in BANKNIFTY.
On the daily time frame, an exhaustion is seen near previous neckline of head and shoulder pattern. Looking for some more up move.
Important Levels
- Resistance – 47,900 – 48,000
- Support – 47,000 – 46,500
- No trading – 47,000 – 46,500