Market View – 8th June Expiry
#safebull , Analysis , Educational , Information , Learning , Market
Price action looks very bullish in the daily time frame. After a healthy correction as anticipated, NIFTY 50 corrected about 108 pts on Wednesday and Thursday sessions and closed above 18500 level and price action is pretty bullish…[ Read More ]…
Expectations, Support & Resistances
WARNING !!!:-
- This just a personal opinion & view.
- This is not a trade advice.
- We are not SEBI registered.
- This is just for educational purpose only.
- Please consult your adviser or do your own analysis before taking any trade.
- By no means we shall be responsible for any of your losses or profits, in case trades executed by using these information’s.
- Read the full Disclaimer.
:: How the market turn out last expiry and our view?
Our View last week:
Price action looks very bullish in the daily time frame. After a huge rally on Monday, there was a slight correction on Tuesday & Wednesday session, which were recovered and closed above last week’s high on Friday.
On Monday if the market opens up and sustains above 18500 levels for few hours, market is likely to continue with the trend and face resistance at 18600. But before breaking the all time high, a little pause and correction is expected and will be considered necessary for strong up move.
NIFTY has closed with PCR of 1.0 and put writing of 1.06 Cr each at 18300 & 18400, indicating it as a strong support for the upcoming week. With Lots of positivity around, market is expected to open on Monday, with US debt ceiling nearing a deal and the mixed US CPI data effect has already been absorbed, only event to watch out for is Indian YOY GDP data on 31st May 5:30Pm.
Market Traded or Behave:
In line with our view market opened with a gap up of about 100 Pts on Monday, followed by a strong positive close on Tuesday, a very highly anticipated correction of 108 pts was observed on Wednesday and Thursday sessions. And these corrections were very vital for further uptrend/bullish move to continue. And on Friday it closed higher indicating the bullish trend is still intact.
This week has been a roller costar, with slew of data releases and the US debt ceiling drama. But week ended with a ray of hope with a close above 18500 for the upcoming week.
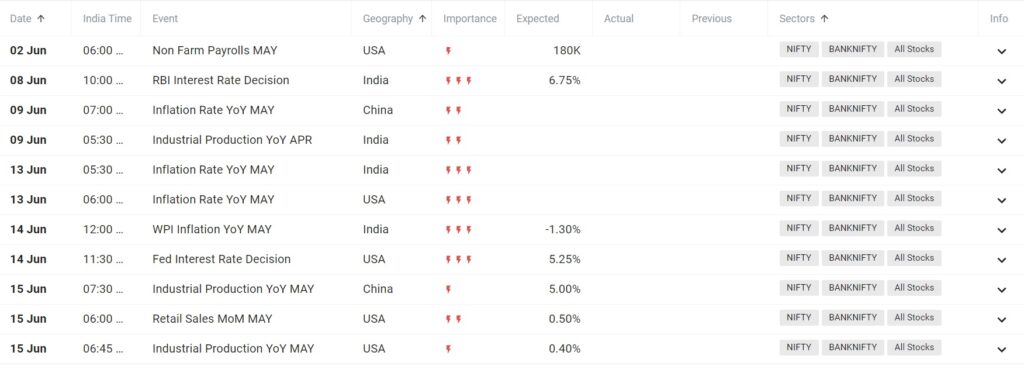
This coming week will be an interesting one with a number of important events lining up. Such as
- 08 Jun 10:00 AM RBI Interest Rate Decision India *** expected 6.75%
- 09 Jun 09 Jun 05:30 PM Industrial Production YoY APR **
:: Technical Analysis
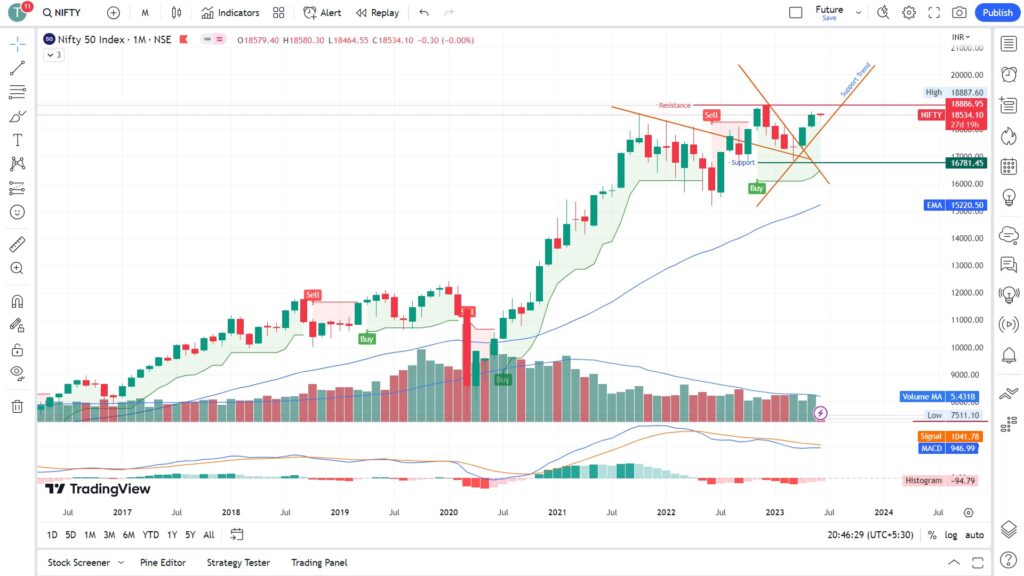
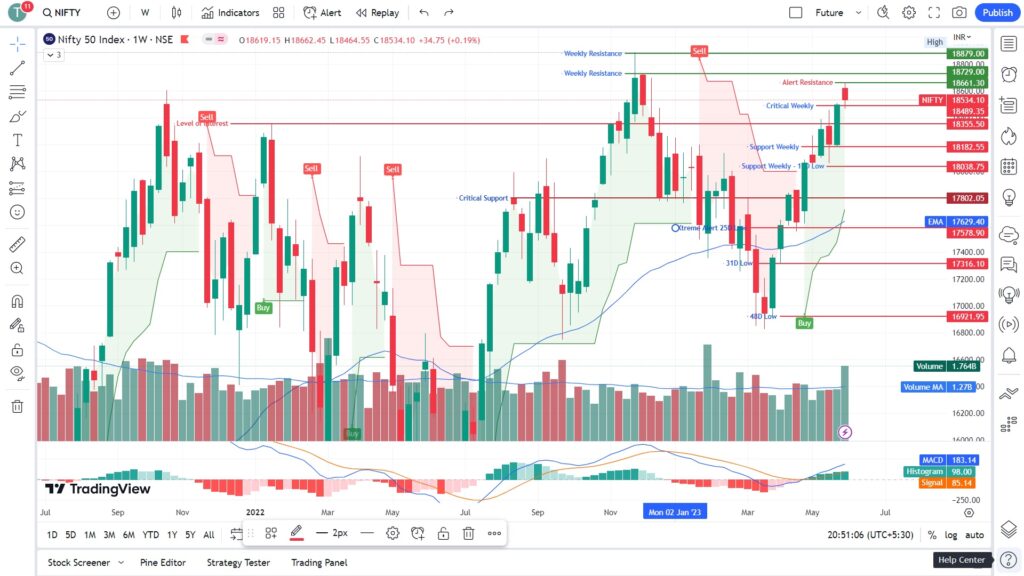
Weekly View– After a long bull run, a correction was highly anticipated, which it did this week, and with a weekly closer above 18500 level, it upholds the bullish trend, and with US debt ceiling drama finally looking to be over, now focus shifts to RBI rate decision & FED rate decision, market is expected to remain volatile this upcoming weeks but I lean more towards to bull side as price action strongly indicates and suggests so on weekly chart. Refer the Fig. 2
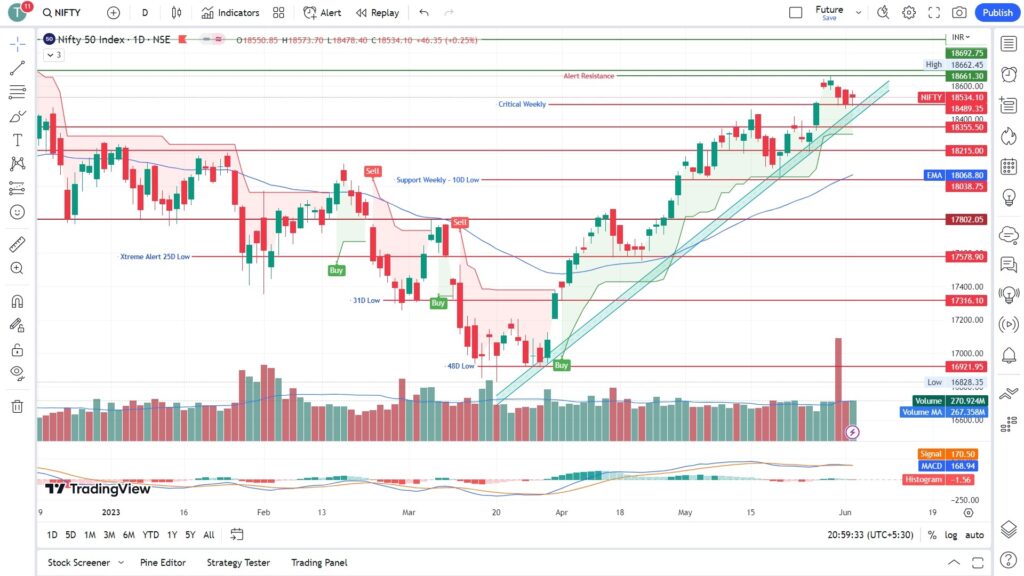
Daily View- Price action looks very bullish in the daily time frame too. After a healthy correction as anticipated, NIFTY 50 corrected about 108 pts on Wednesday and Thursday sessions and closed above 18500 level and price action as of now is pretty bullish.
On Monday if the market opens up and sustains above 18500 levels for few hours, market is likely to continue with the trend and face resistance at 18600. And with US market trading higher today with the cheers of US debt ceiling bill and FED positive vibe on possible rate hike pause hint.
Market very likely to move higher, if no negative news plays spoilt sport, but volatility can be expected with RBI rate hike decision on 8th June 2023.
Refer the Fig. 3
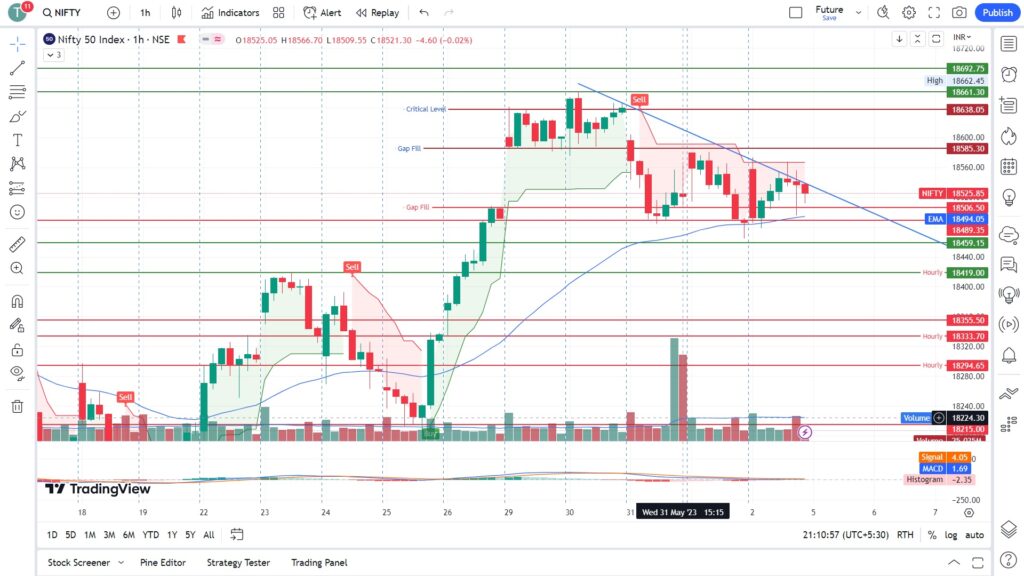
The price action on hourly chart market, looks like it is forming a triangular pattern with multiple rejection from the falling trend line, hence break out on any direction could give a strong convincing move. If it opens gap up, it could suggest a break out but we need watch 18600 level as it has been rejecting multiple time from this level. Even OI data also indicates a strong call writing at this level.
Important Levels:
Resistance – 18550 – 18600
Support – 18450 -18500
No trading Zone- 18500 -18600
Previous Day – Positive
Previous Week – Negative
NOTEWORTHY:-
Price action looks very bullish in the daily time frame. After a healthy correction as anticipated, NIFTY 50 corrected about 108 pts on Wednesday and Thursday sessions and closed above 18500 level and price action is pretty bullish.
On Monday if the market opens up and sustains above 18500 levels for few hours, market is likely to continue with the trend and face resistance at 18600. And with US market trading higher today with the cheers of US debt ceiling bill and FED positive vibe on possible rate hike pause hint.
Market very likely to move higher, if no negative news plays spoilt sport, but volatility can be expected with RBI rate hike decision on 8th June 2023.
The price action on hourly chart market, looks like it is forming a triangular pattern with multiple rejection from the falling trend line, hence break out on any direction could give a strong convincing move. If it opens gap up, it could suggest a break out but we need watch 18600 level as it has been rejecting multiple time from this level. Even OI data also indicates a strong call writing at this level.
:: Data Analysis
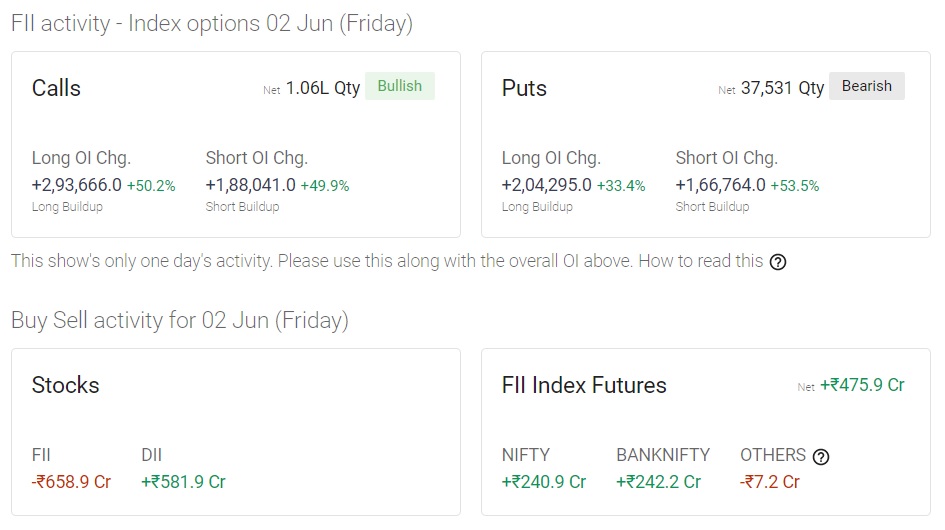
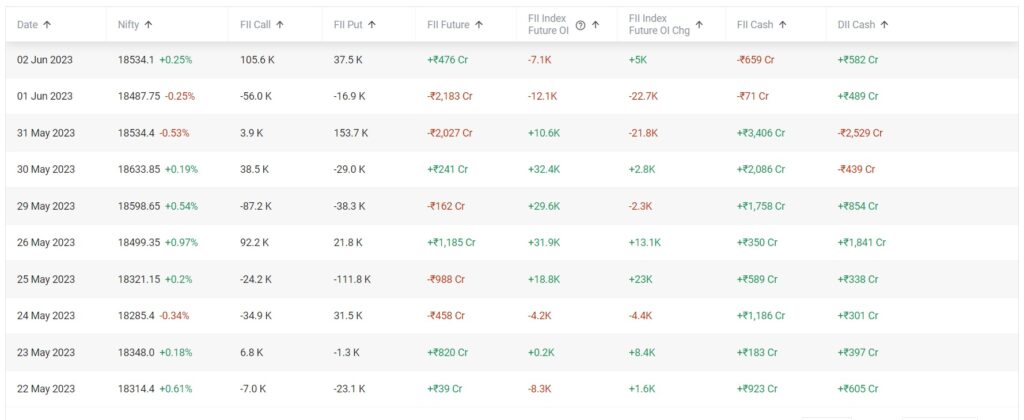
FII & DII Activity-
FII buying observed in all segments.
FII Cash :: ▼ -₹658.9 Cr
FII Futures :: ▲ +₹475.9 Cr
DII Cash :: ▲ +₹581.9 Cr
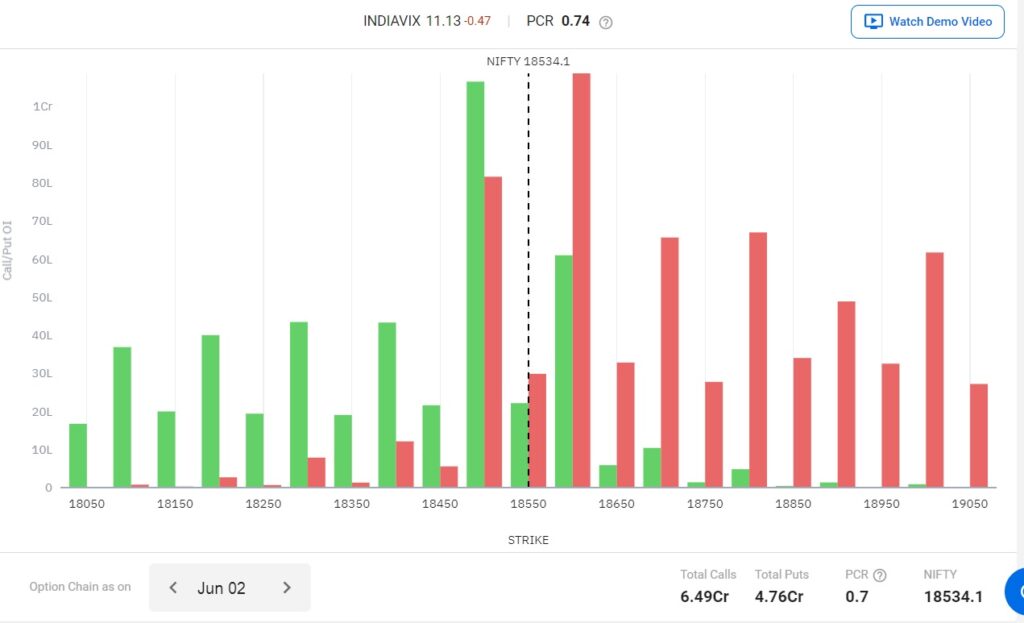
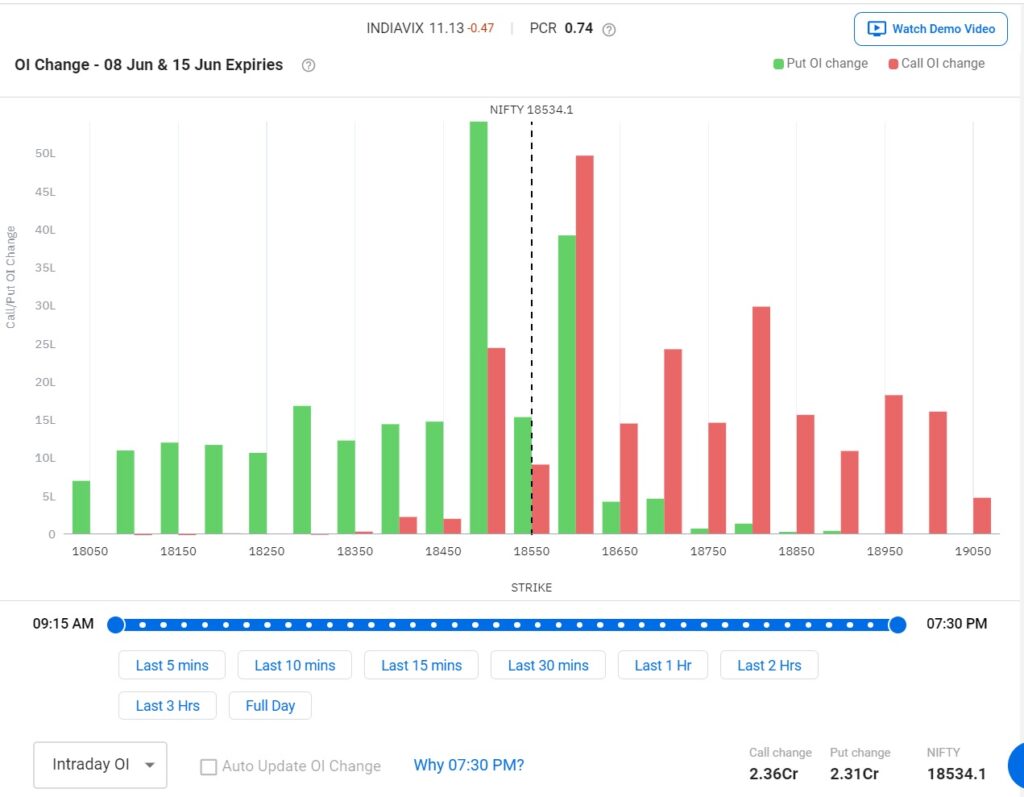
Open Interest (OI)-
Lots of put writing of about 1.07Cr observed at 18500, and call writing of about 1.09Cr at 18600 level, these levels could be crucial this week
PCR – 0.7 (-) Mildly Bearish.
:: Market Sentiments
World Markets – World market traded positively. And US market rose with debt ceiling bill nearing a closure.
SGX N50 – Closed around 18720 at 9:24pm 02-06-2022
:: Events this Expiry/week
Quick links::
- #safebull (14)
- Analysis (6)
- Calendar (1)
- Educational (9)
- Information (10)
- Learning (27)
- Market (3)
- News (6)
- Strategy (17)
- Taxes (1)
The above analysis is solely the opinion of the author, no way an assured tips/direction to trade, they are solely for educational purposes. Please do not trade with out a proper study and analysis, we will not be responsible for your loss. We are not SEBI registered.
#SafeBull