Market View – 25th May 2023 Expiry, Expectations, Support & Resistances
#safebull , Analysis , Educational , Information , Learning , Market
How the market turn out previous expiry and what we can expect the next expiry. Broader view is shared below for the next week expiry, on the basis of Technical and Data Analysis. WARNING !!!:- How the market turn out last expiry? As highlighted in our analysis last week after a strong bull run of […]
How the market turn out previous expiry and what we can expect the next expiry. Broader view is shared below for the next week expiry, on the basis of Technical and Data Analysis.
WARNING !!!:-
- Read the Disclaimer.
- For intraday follow price action in shorter time frame.
- This just a personal opinion.
How the market turn out last expiry?
As highlighted in our analysis last week after a strong bull run of about 1500pts, a slight correction or pause was expected and anticipated, and it did correct and the market still holds 18100 level therefore bull run is expected to continue and this time it may further shoot to new higher highs and may be a new all time also is achievable.
Lots of call writing in levels above 18400 level and puts writing below 18100 levels, hence expected range is 18100 to 18400 in coming week.
Technical Analysis
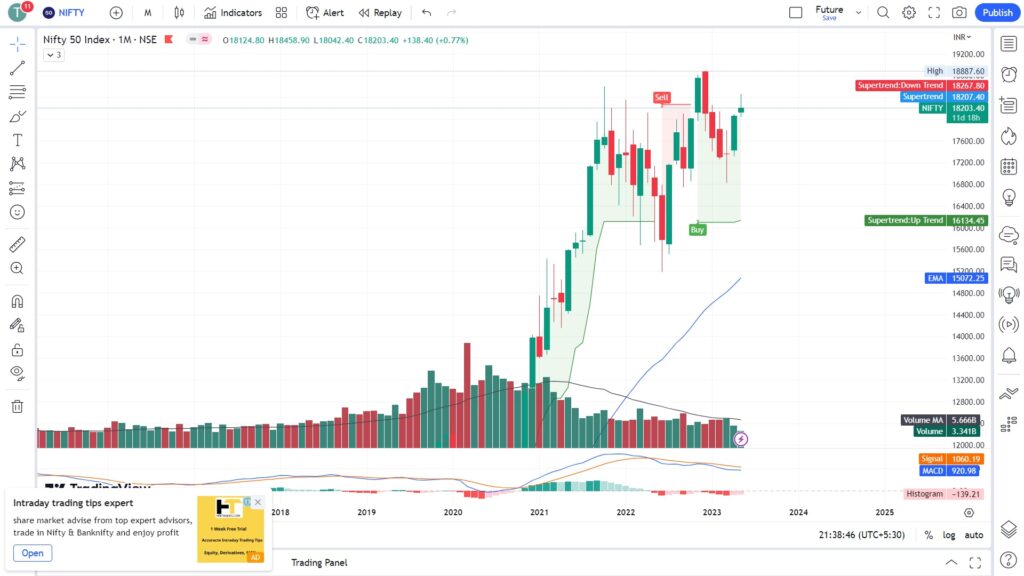
Monthly View- No Change in view
On the monthly chart, it has broken out from the bearish channel and closed on a very strong bullish note, after a trend reversal confirmation a bullish candle is developing, last Friday gave a gain of 245 pts adding to the bullishness, and overall bullish trend is still intact. Refer the Fig. 1
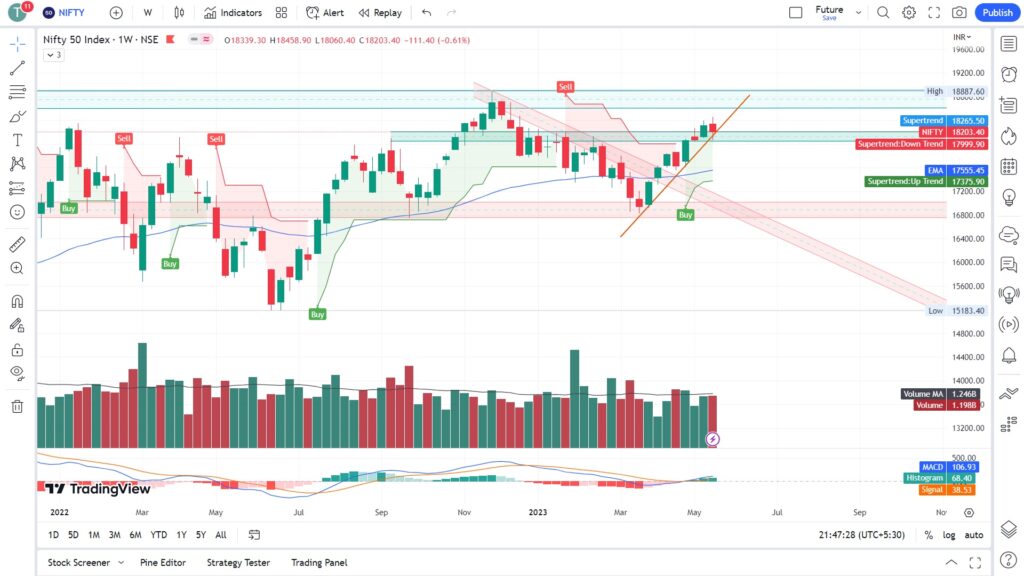
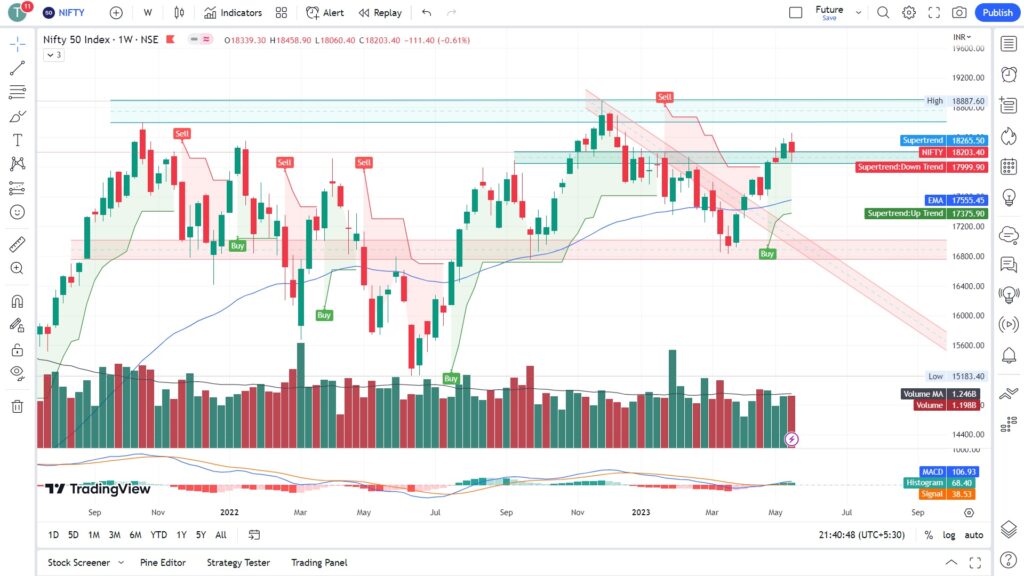
Weekly View- Follow up to a strong move of about 1500 pts in last few sessions, a healthy correction or pause was expected and it did pause this week, but closed strongly above 18200 level. With this no negative news insight and in tandem with world markets NIFTY is ready for another jump, may be a new all time high in near future. Refer the Fig. 2
Daily View- After making a new swing high, and strong 1500 pts moves, finally a healthy retracements of around 200pts was seen in last 3 sessions, but with weekly closing today above 18200 level, the price action is highly bullish.
Also the chart pattern formed a hammer at the bottom of the swing, indicating the trend reversal from bearish to Bullish on daily time frame, that too with good volume.
A good up move is anticipated on Monday with all other markets closing positively with no events and negative news so far.
On the hourly chart a strong buying is observed in the last few hours of the last session of the week. Refer the Fig. 3
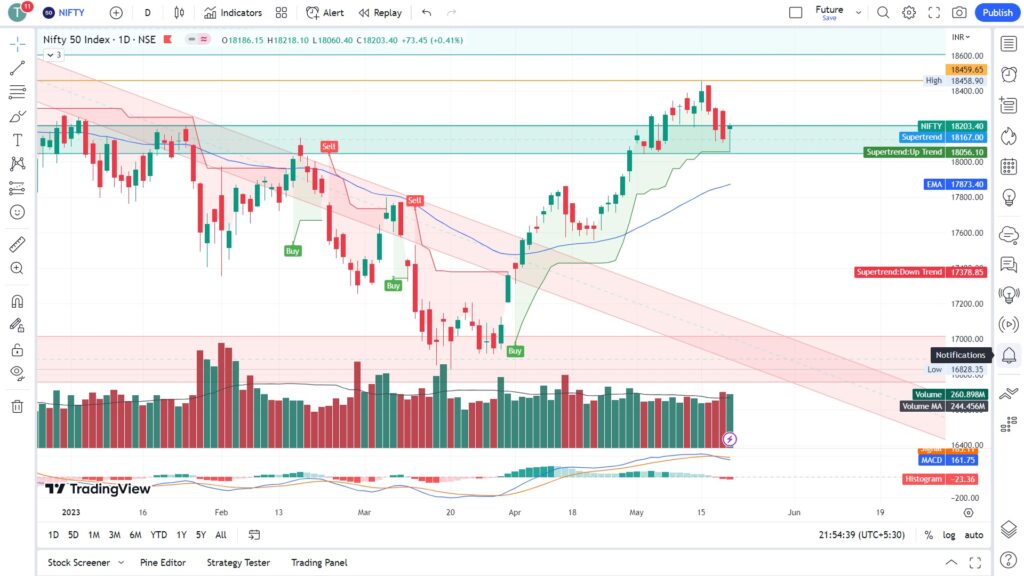
Important Levels from hourly Chart:-
Resistance levels are – 18350 – 18400
Support levels are – 18000 – 18100
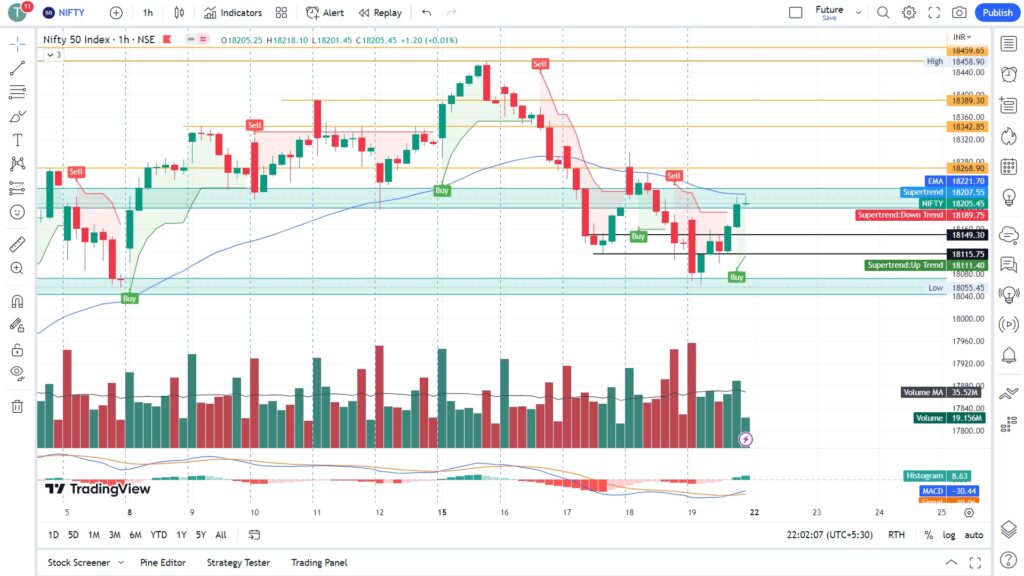
No trading Zone- 18200 – 18300
Previous Day – Postive
Previous Week – Negative
NOTEWORTHY:-
After making a new swing high, and strong 1500 pts moves, finally a healthy retracements of around 200pts was seen in last 3 sessions, but with weekly closing today above 18200 level, the price action is highly bullish.
Also the chart pattern formed a hammer at the bottom of the swing, indicating the trend reversal from bearish to Bullish on daily time frame, that too with good volume.
A good up move is anticipated on Monday with all other markets closing positively with no events and negative news so far.
On the hourly chart a strong buying is observed in the last few hours of the last session of the week.Data Analysis
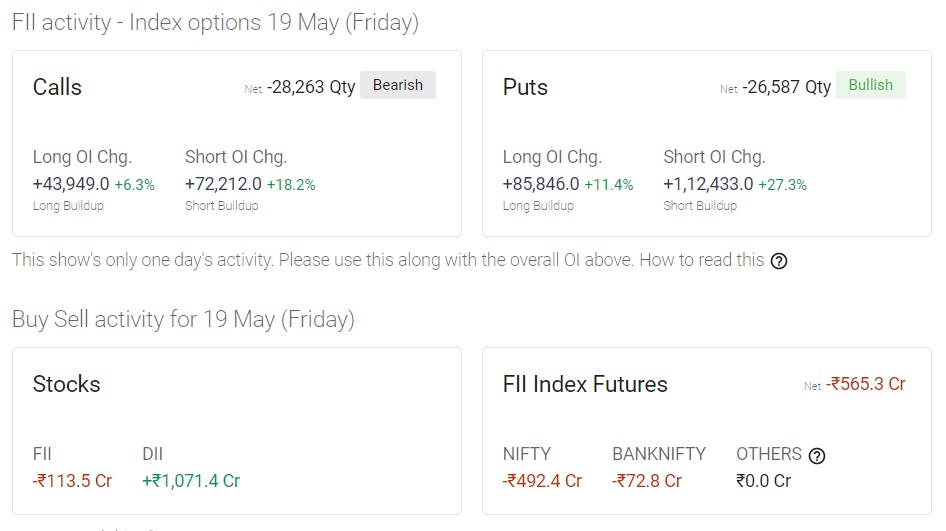
FII & DII Activity-
Finally after continuous buying by FII a negligible selling observed by FII in cash segments, but selling in futures segment indicating a mixed signal.
FII Cash :: ▼ -₹113.5 Cr
FII Futures :: ▼ -₹565.3 Cr
DII Cash :: ▲ +₹1,071.4 Cr
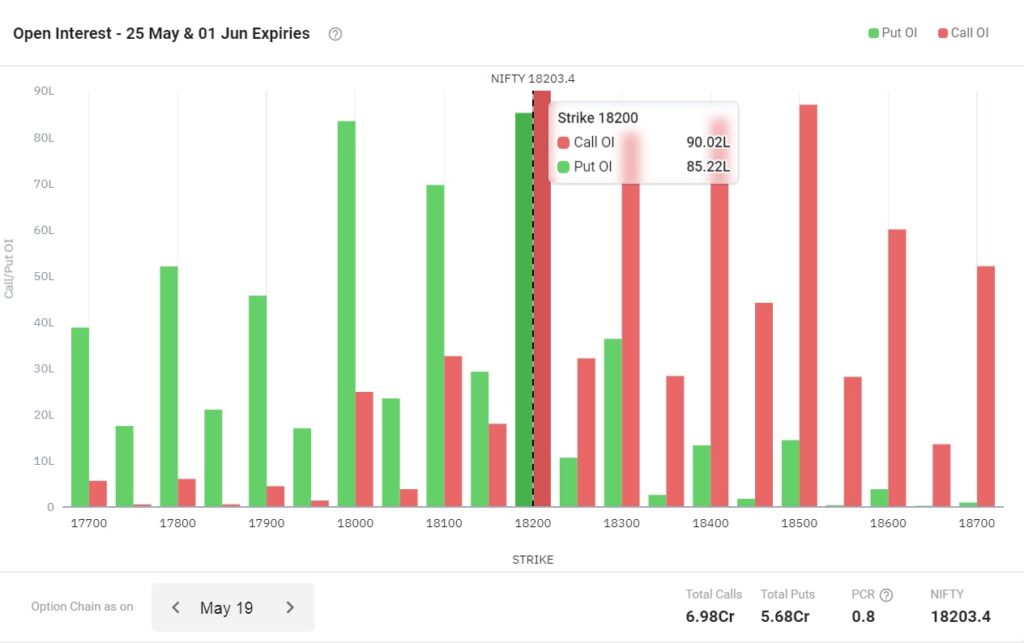
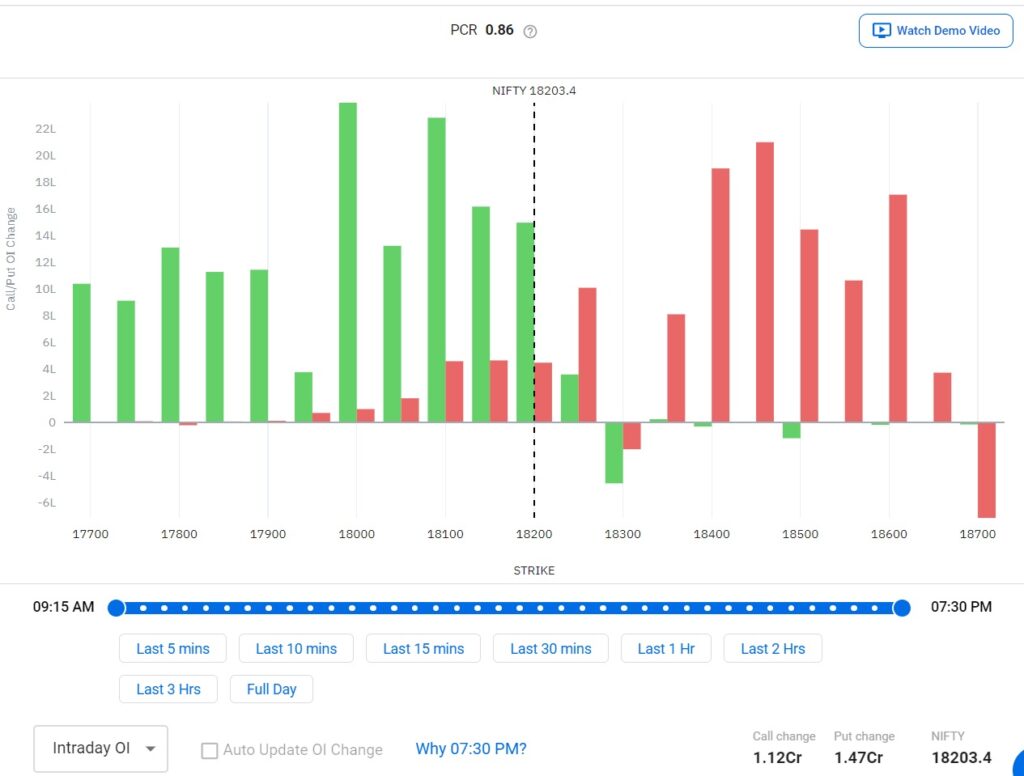
Open Interest (OI)-
Nominally more puts written than calls with maximum at18200 and puts at 18200 as well. Lots of call writing in levels above 18400 level and puts writing below 18100 levels, hence expected range is 18100 to 18400 in coming week.
PCR – 0.8 (-) Flat.
Market Sentiments
World Markets – World market mostly traded positively. But US market after a positive opening, they closed in negative territory after the news of Debt Ceiling talk been on halt.
SGX N50 – Closed around 18195 at 22:00pm 19-05-2022
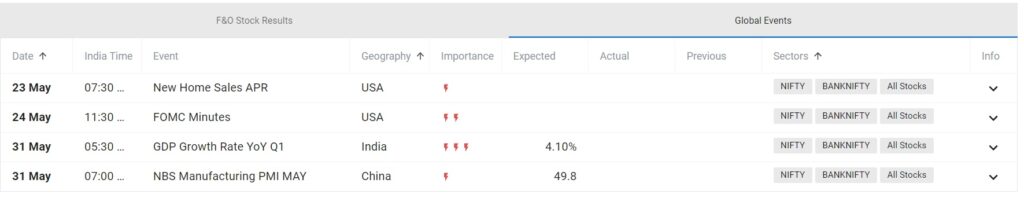
Events this Expiry/week
Quick links::
- #safebull (14)
- Analysis (6)
- Calendar (1)
- Educational (9)
- Information (10)
- Learning (27)
- Market (3)
- News (6)
- Strategy (17)
- Taxes (1)
The above analysis is solely the opinion of the author, no way an assured tips/direction to trade, they are solely for educational purposes. Please do not trade with out a proper study and analysis, we will not be responsible for your loss. We are not SEBI registered.
#SafeBull