Market at the Pinnacle
Analysis , Educational , Weekly
At a new all time high, and highest ever close. Reclaimed 20,000 level once again. Very positive… [ Read More ] …
Last Expiry – How the market traded.
NIFTY 50
Previous week closed on a very bullish note, with back to back green closing. Nifty has created a new all time high, and a highest ever close on daily time frame.
BANK NIFTY
Previous week remained highly volatile but closed on a very positive note, forming a very strong and clear bullish price action.
…….
Market at the pinnacle, technically where’s next?
NIFTY 50
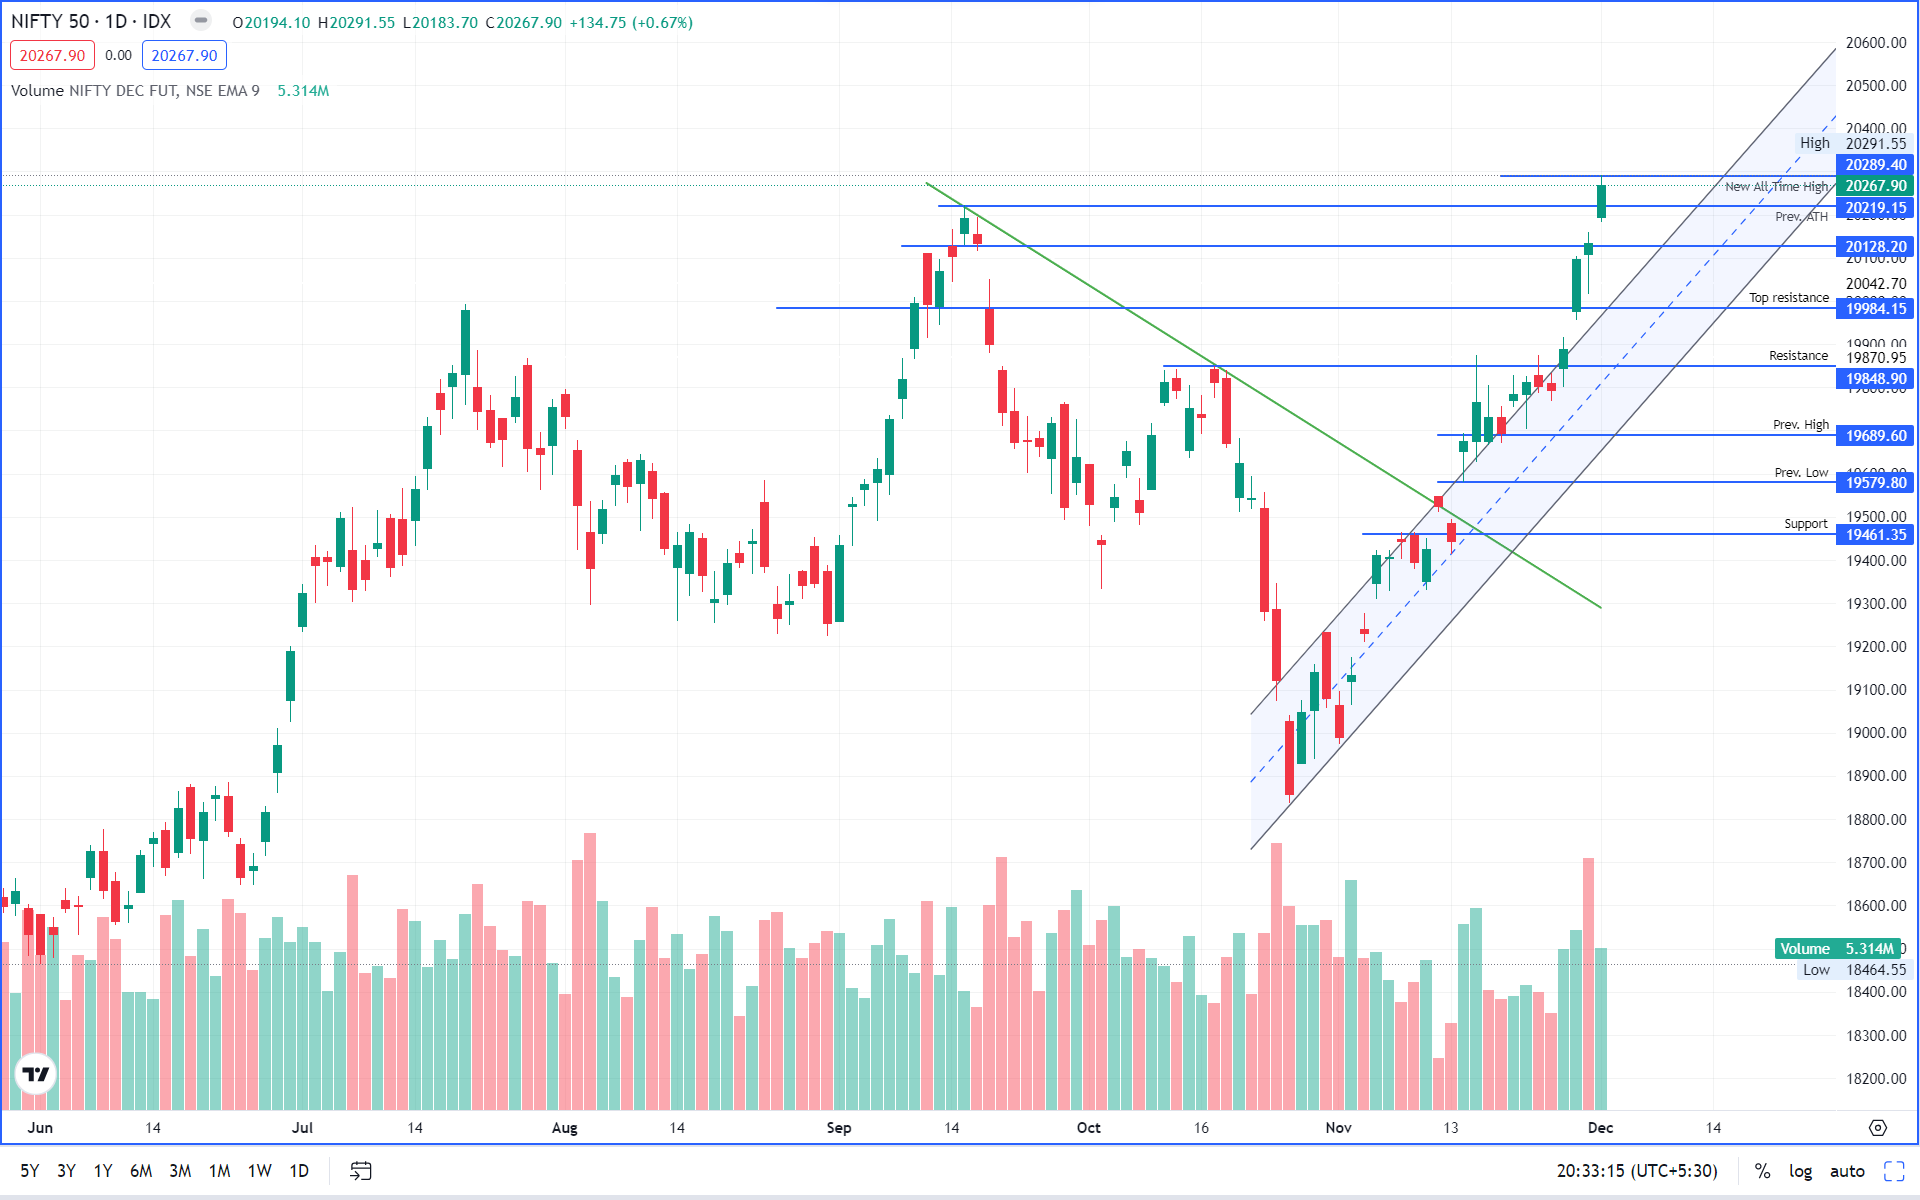
View :
At a new all time high, and highest ever close. Reclaimed 20,000 level once again. Very positive.
Price action on daily time frame looks positive avoid shorting at all cost.
At an unknown horizon, volatility is expected to remain.
Important Levels
- Resistance – 20,400 -20,500
- Support – 20,000 – 20,200
- No trading Zone – 20,000 – 20,200
Please follow the link to see the detail chart analysis.
–Click Here :Charts for 30th November, 2023 Expiry
……
BANKNIFTY
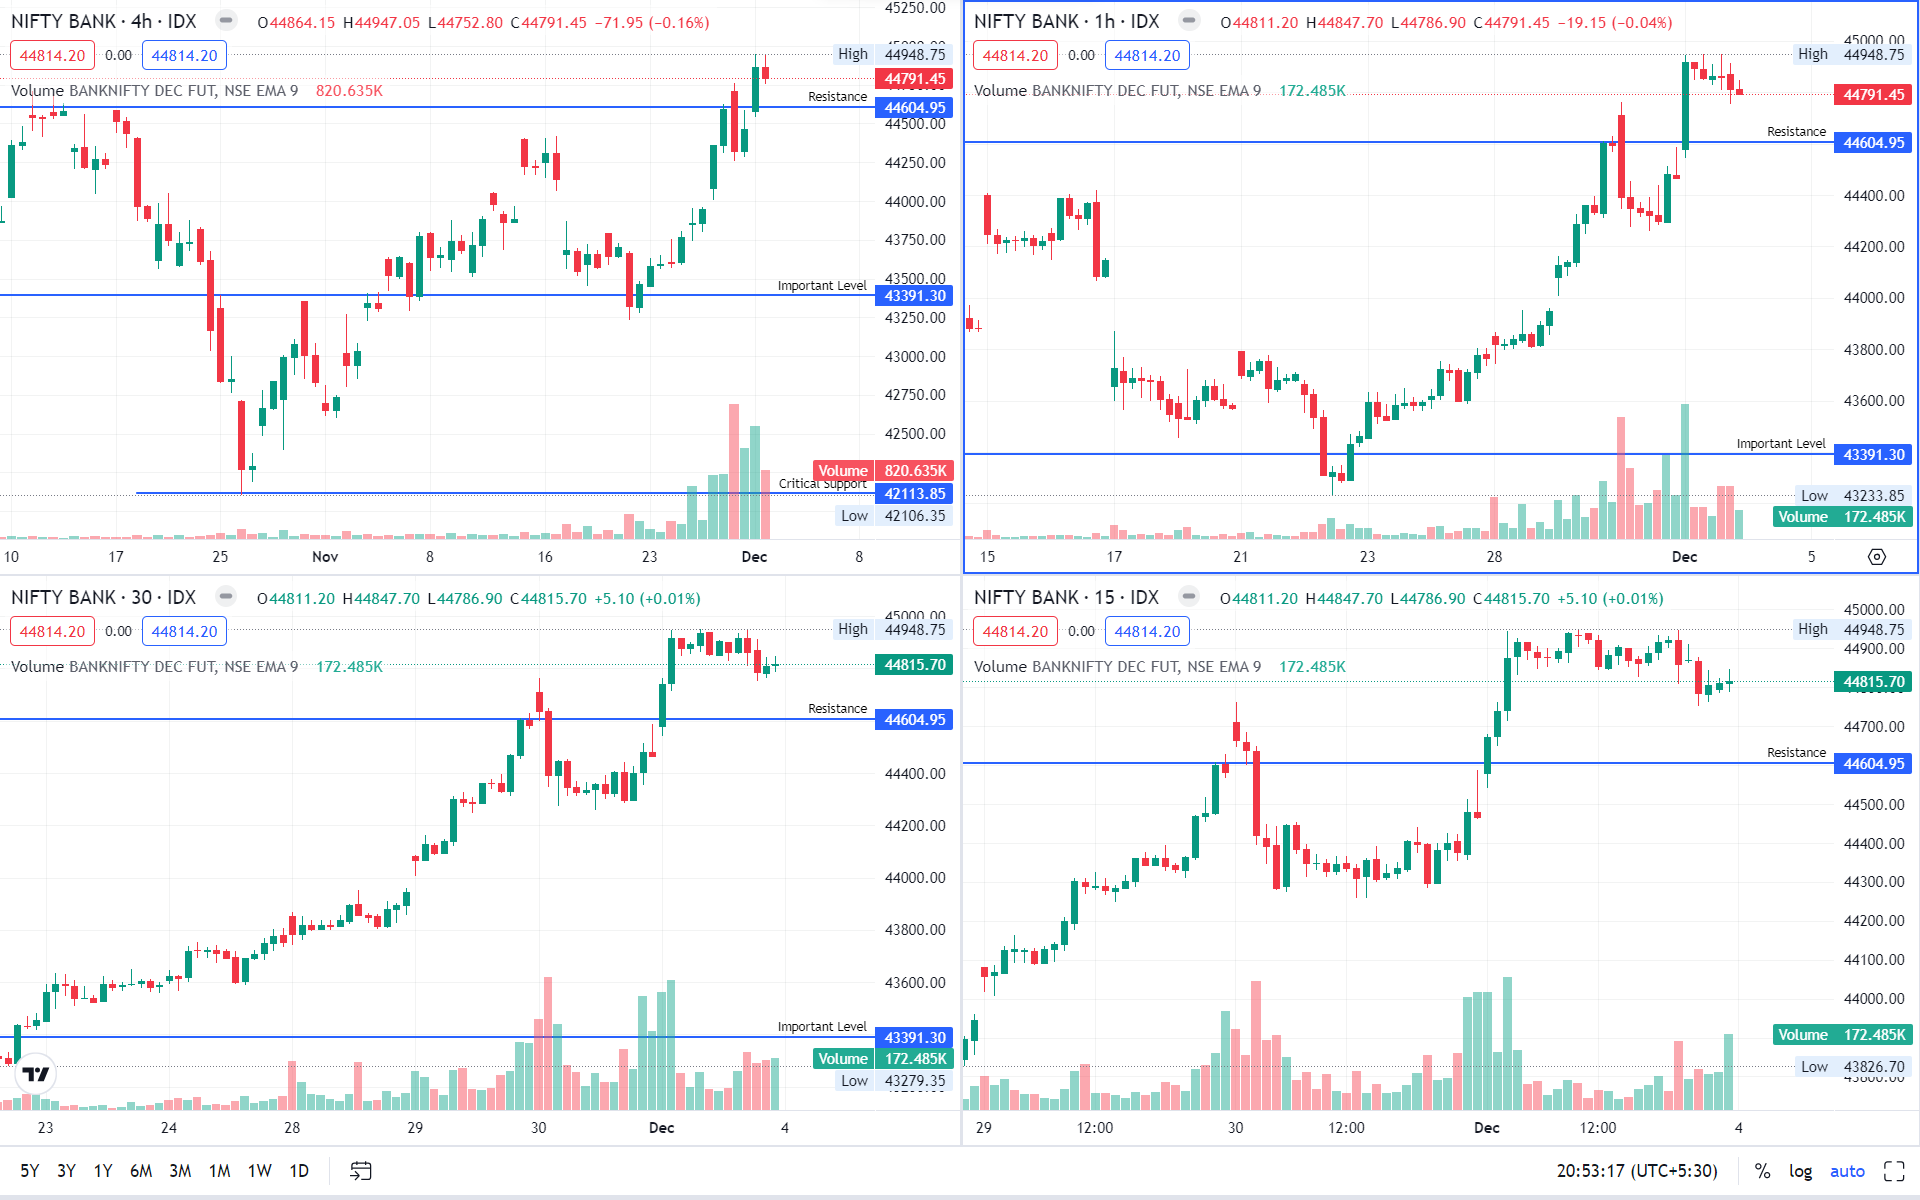
View :
Price action is settling strongly at a very bullish zone. Closed above 44,600 and it is expected for further up move.
On daily time frame, there has been a strong buying after a dip.
On a shorter time BANKNIFTY is a buy on dip.
Important Levels
- Resistance – 45,000 – 45,200
- Support – 44,400 – 44,500
- No trading – 44,400 – 44,500
Please follow the link to see the detail chart analysis.
……
Will data drive the market beyond the pinnacle?
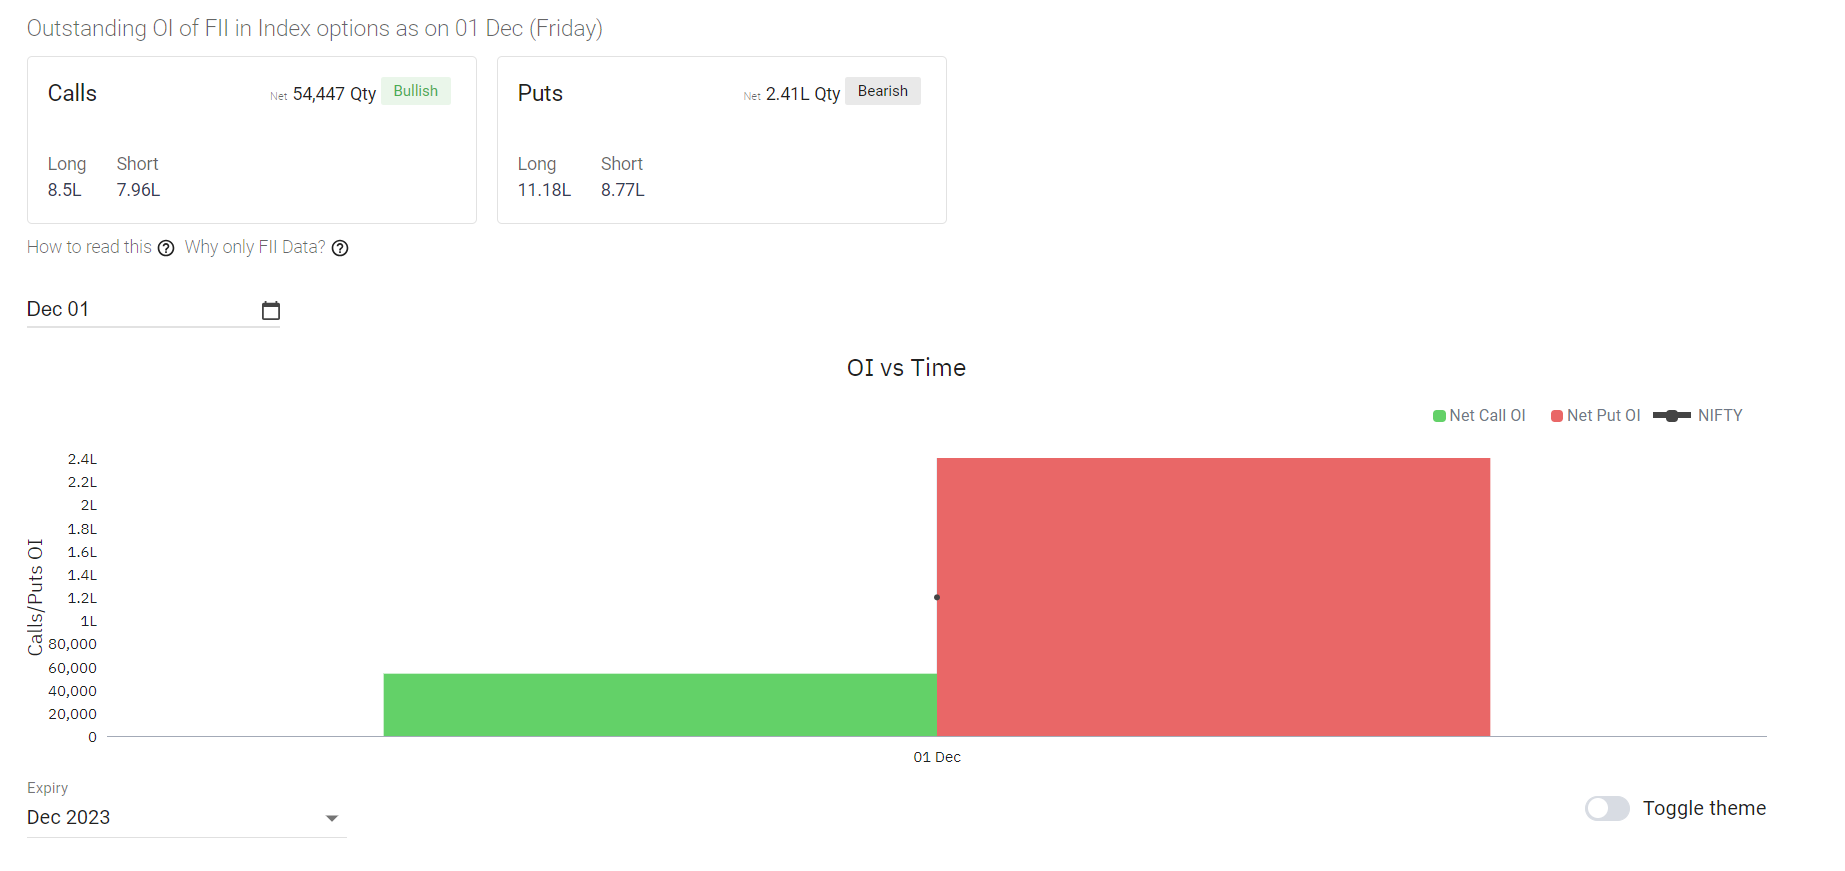
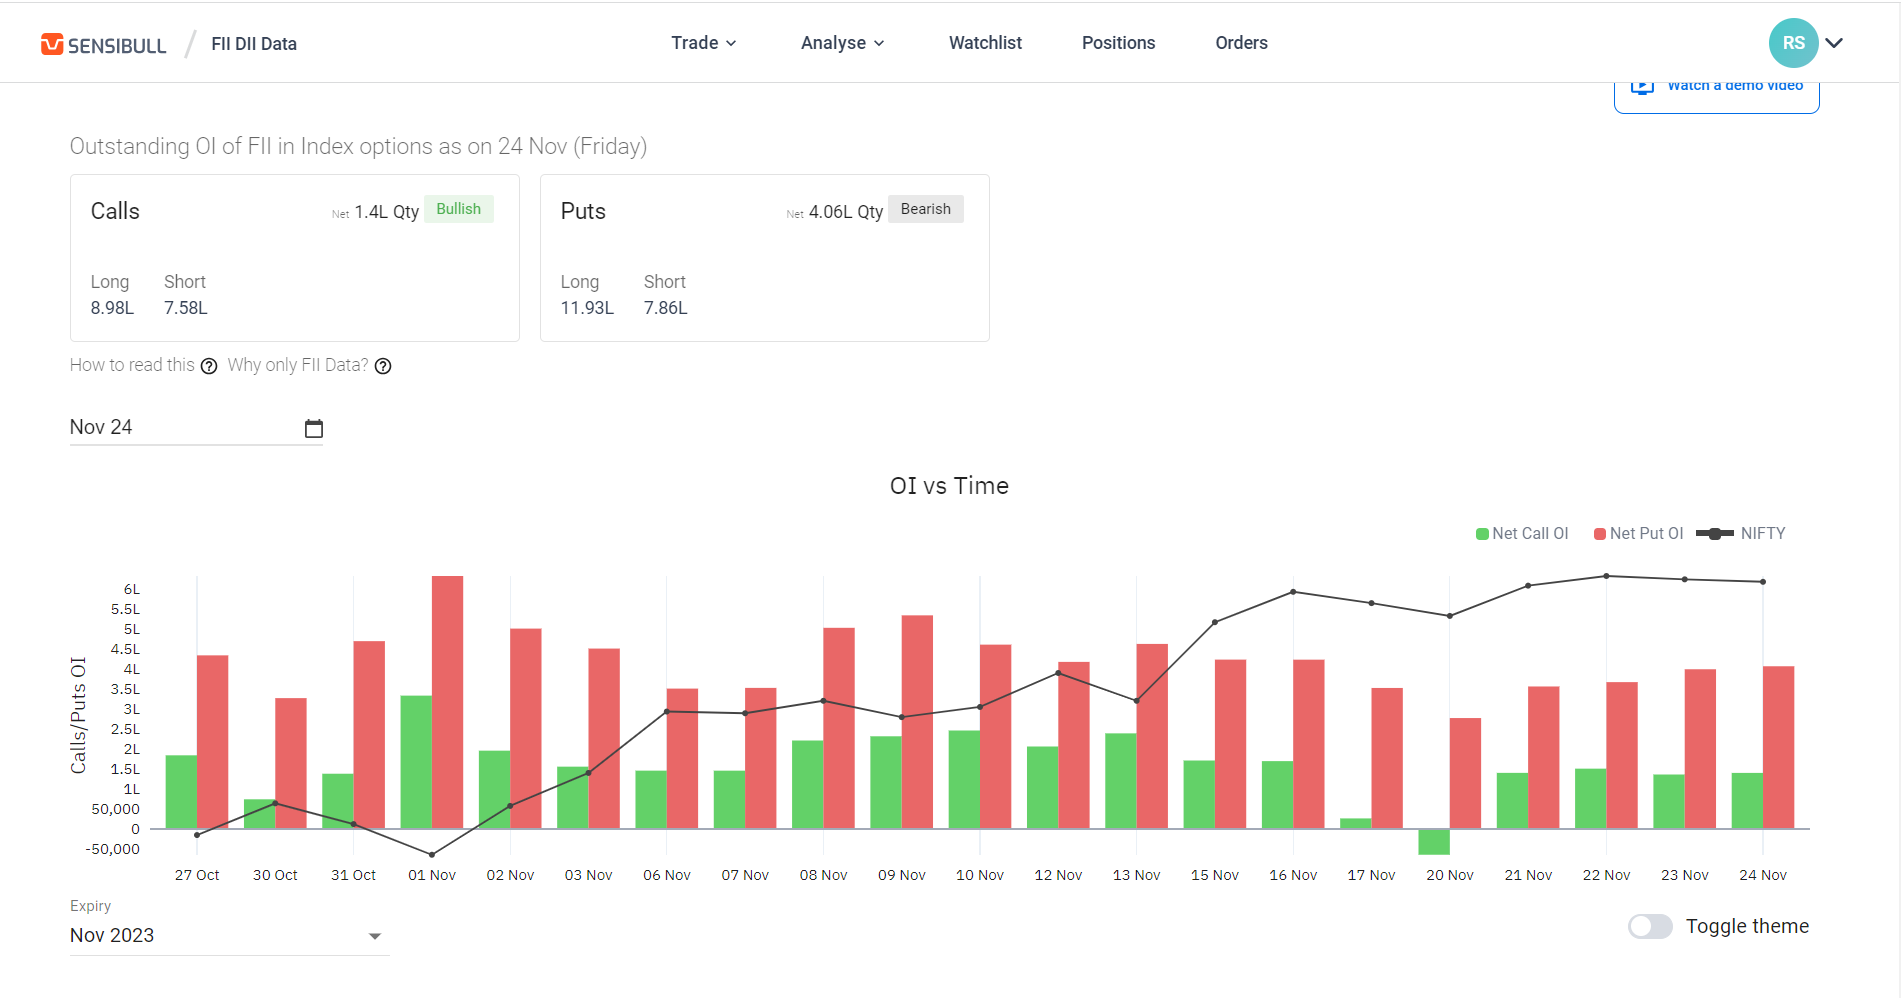
FII & DII Activity
Observations:
FII & DII data suggest market to remain volatile, but heavier on negative side even though its too early to say.
- Outstanding puts is 2.4L against 50k calls – Looks Bearish.
- Last session FII futures activity – Decently on positive.
- FII stocks is 1.5K cr – Does not hold relevance for intraday but swing wise positive.
- Net Future OI change = +9.8K, Looks positive.
Open Interest (OI)-
OI data suggest market to remain volatile, but heavier on negative side at high levels.
Nifty OI
- Max OI Calls:: 20,400 , 0.59 Cr
- Max OI Puts:: 20,000 , 0.75 Cr
- PCR:: 0.9, Flat to Bullish
Note:: OI suggests support at 20000 , but strong Resistance at 20400.
Banknifty OI
- Max OI Calls:: 45,000 , 0.30 Cr
- Max OI Puts:: 44,500 , 0.24 Cr
- PCR:: 0.8
Note:: OI suggests nominal support at 44500 , but strong Resistance at 45000.
Please follow the link to see the detail chart analysis.
–Click Here :Data for 30th November, 2023 Expiry
……
Market Sentiments
World Markets – World market traded flat.
GIFT NIFTY FUTURES – Closed around 20,353.00 at 01:15am 01-12-2023.
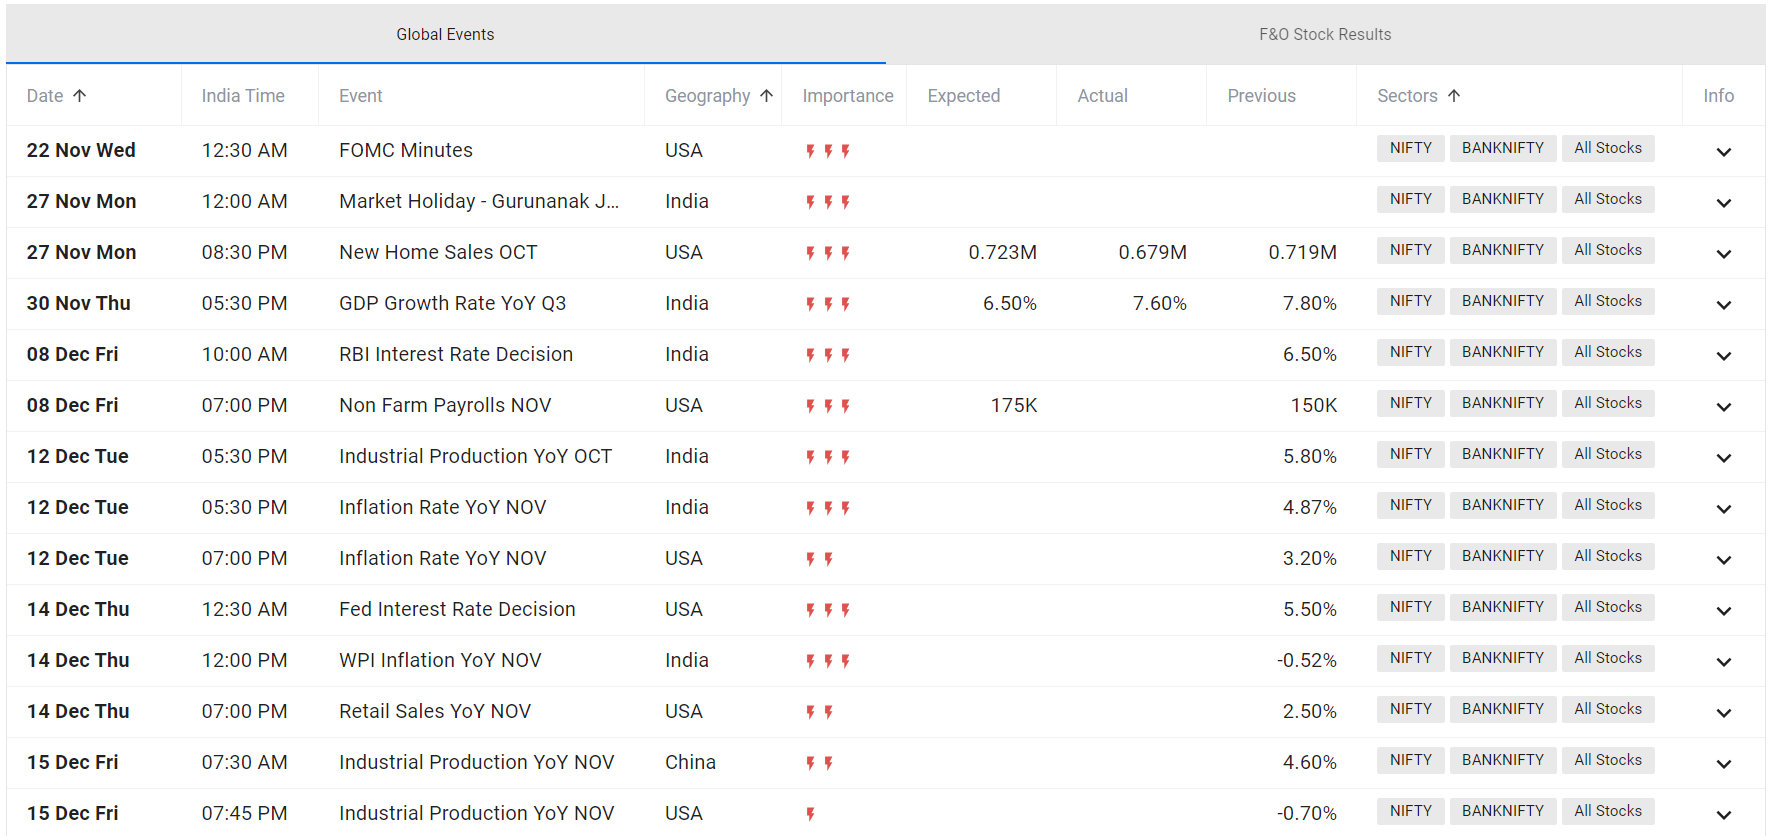
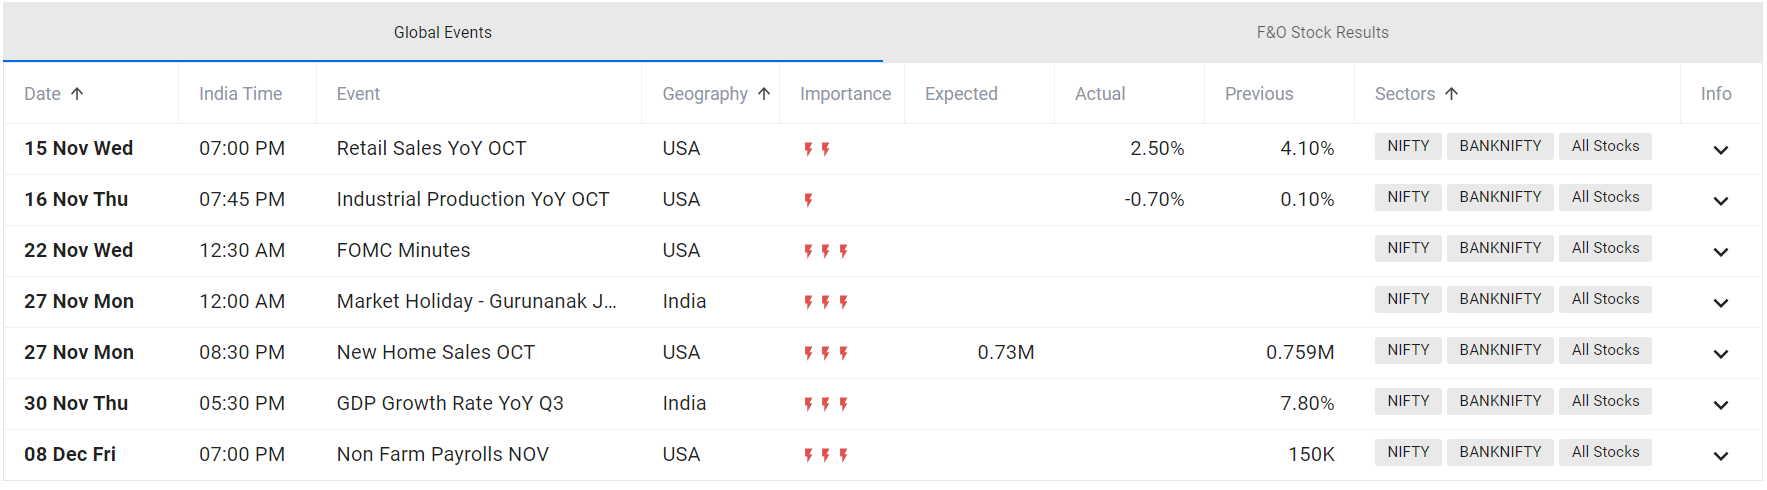
Events Upcoming
……
The above analysis is solely the opinion of the author, no way an assured tips/direction to trade, they are solely for educational purposes. Please do not trade with out a proper study and analysis, we will not be responsible for your loss. We are not SEBI registered.
#SafeBull, #pixarts.Trade
Nice bro, keep it going. 👍
Thanks mate