Market at a pause
Analysis , Educational , Information , Learning
Previous week closed on a weak note, and the whole week remained volatile and range bound near a very important resistance area… [ Read More ] …
Last Expiry – How the market traded.
NIFTY 50
Previous week closed on a weak note, and the whole week remained volatile and range bound near a very important resistance area.
BANK NIFTY
Previous week remained highly volatile and opened on negative note but was able to hold at the important level. Week closed on slightly positive note.
…….
Technically, Can we see a trending market after a pause?
NIFTY 50
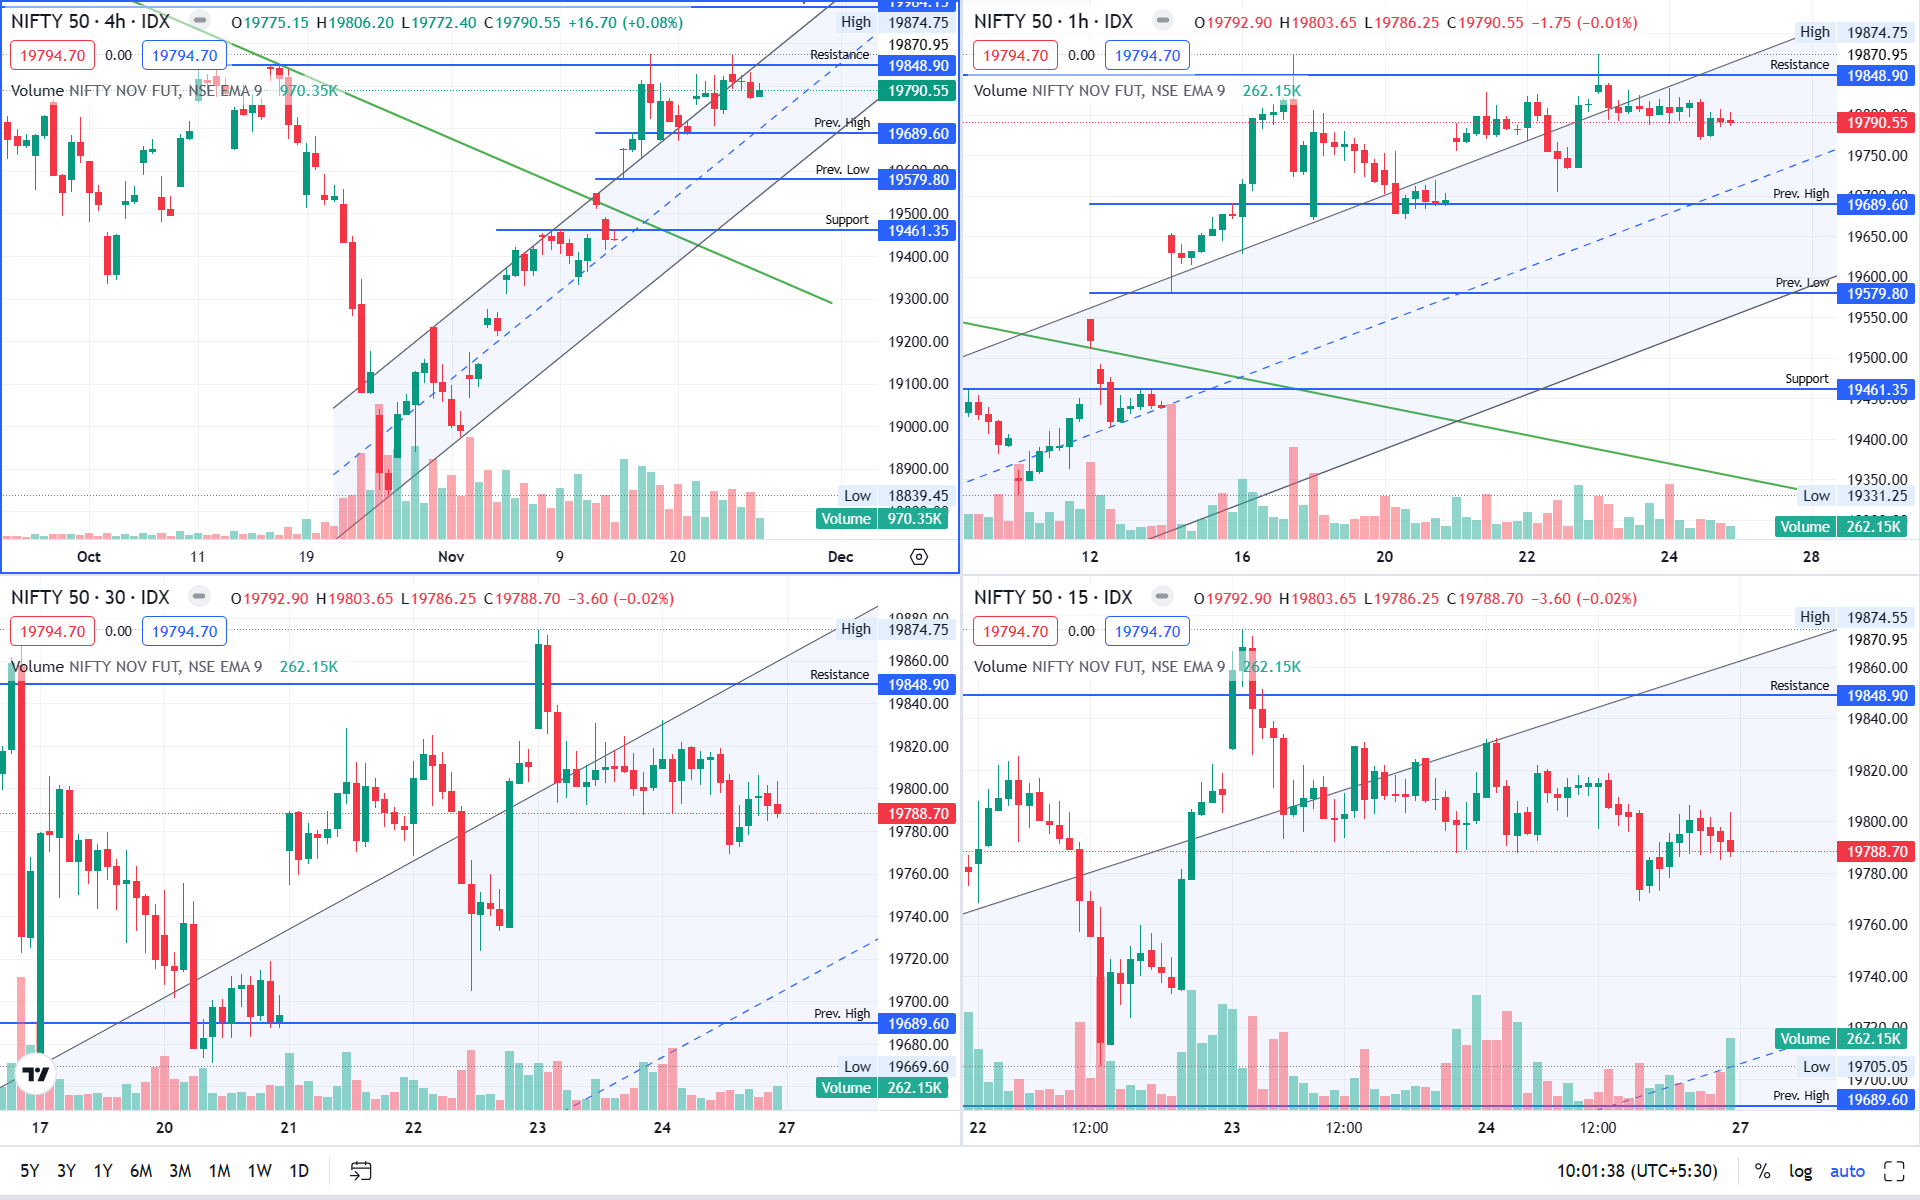
View :
After a gain, last week remained highly volatile and range bound. Seems like NIFTY is preparing for breaking a very important resistance zone 19850 – 19900.
Price action on daily time frame looks positive but it is testing 19850 – 19900 levels, so watch out.
On shorter time frame, there is some rejection from top but as long as 19450 -19500 level holds, it will still be a buy on dip for now.
Important Levels
- Resistance – 19850 – 19900
- Support – 19400 – 19500
- No trading Zone – 19700 – 19800
Please follow the link to see the detail chart analysis.
–Click Here :Charts for 30th November, 2023 Expiry
……
BANKNIFTY
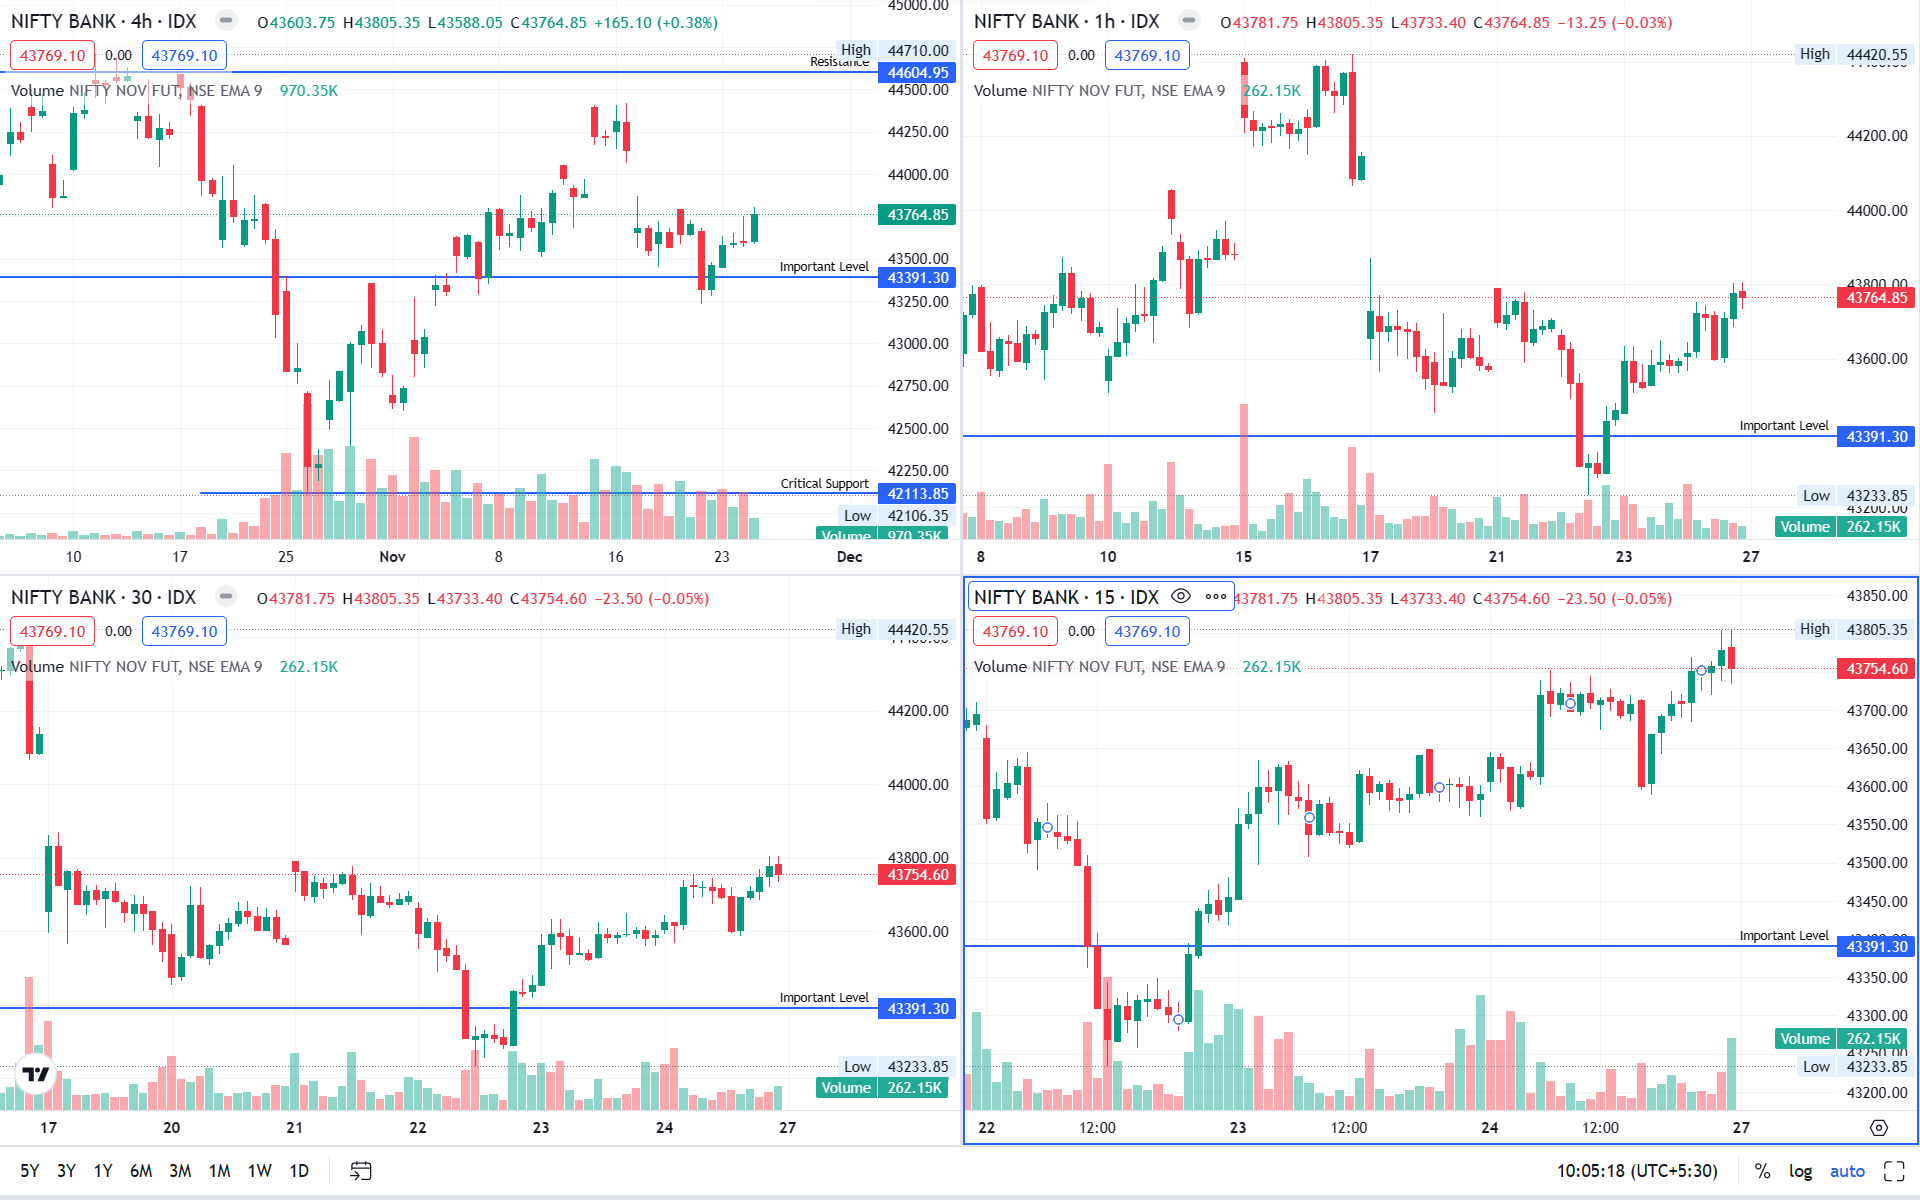
View :
After opening the week on negative note, whole week remained volatile and rangebound near the support zone 43400 – 43500.
On daily time frame, there has been some buying seen on the last 2 sessions, hopefully it is not a selling on rise.
On a shorter time BANKNIFTY is trading near a critical support zone 43400 -43500, if this holds then it should be a buy on dip.
Important Levels
- Resistance – 43800 – 44000
- Support – 43400 – 43500
- No trading 43600 – 43800
Please follow the link to see the detail chart analysis.
–Click Here :Charts for 30th November, 2023 Expiry
……
What does Data say, will there be trending market after a pause?
FII & DII Activity
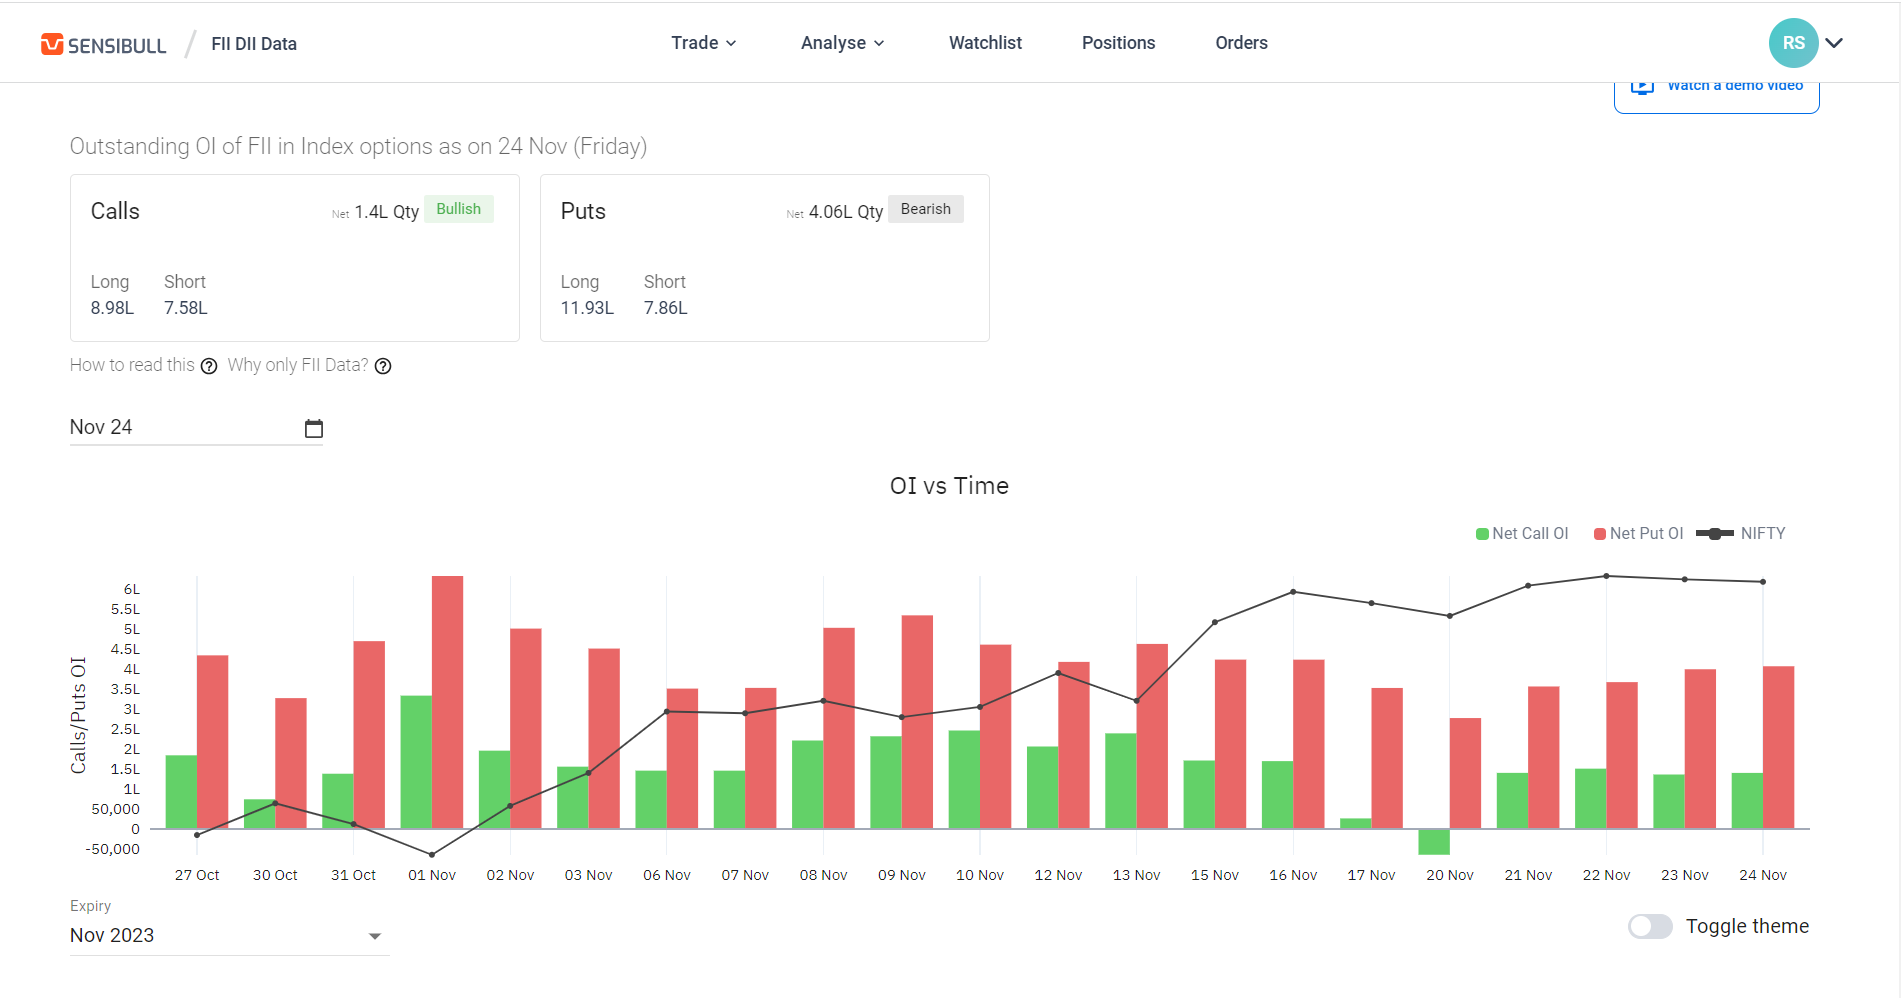
Observations:
FII & DII data suggest market to remain volatile, but heavier on negative side.
Open Interest (OI)-
OI data suggest market to remain volatile, but heavier on negative side.
- Max OI Calls:: 20,000 , 0.91 Cr
- Max OI Puts:: 19800 , 0.89 Cr
- PCR – 0.8 (-) Flat to Bullish
Note:: OI suggests Support at 19800, and but key Resistances at 19800, 19900 & 20000 and above.
Please follow the link to see the detail chart analysis.
–Click Here :Data for 30th November, 2023 Expiry
……
Market Sentiments
World Markets – World market traded flat.
GIFT NIFTY FUTURES – Closed around 19829.0 at 01:15am 25-11-2023.
Events Upcoming
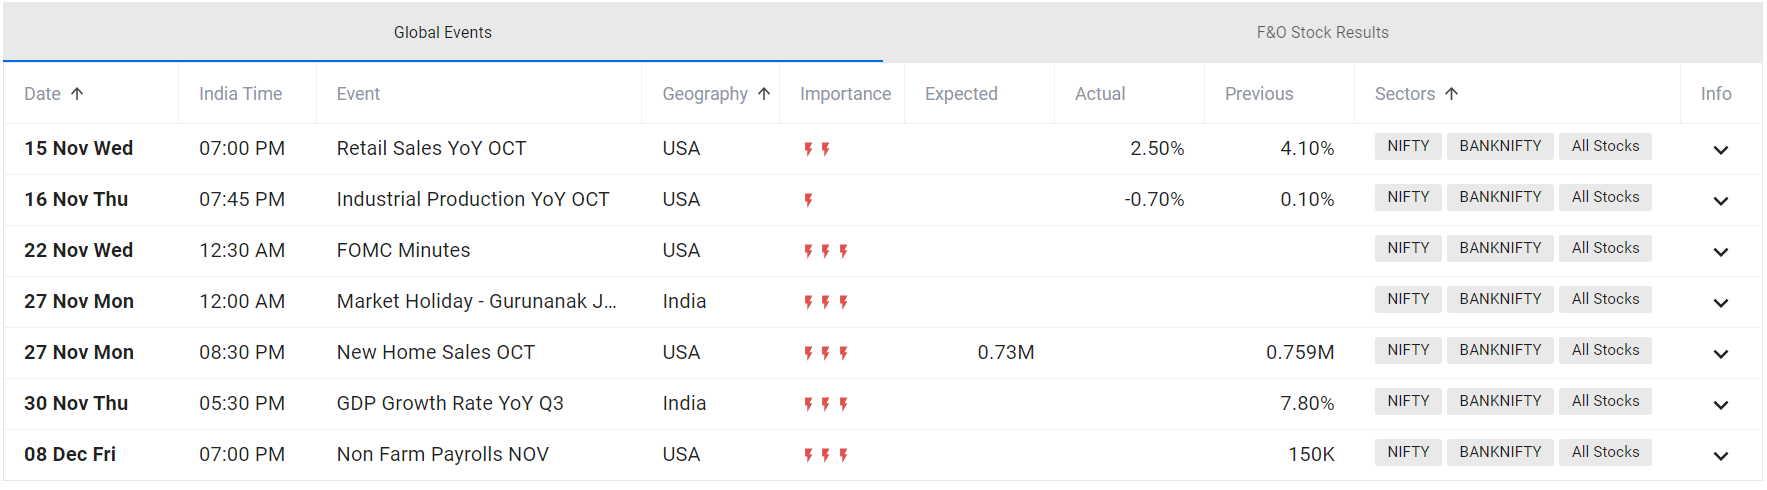
……
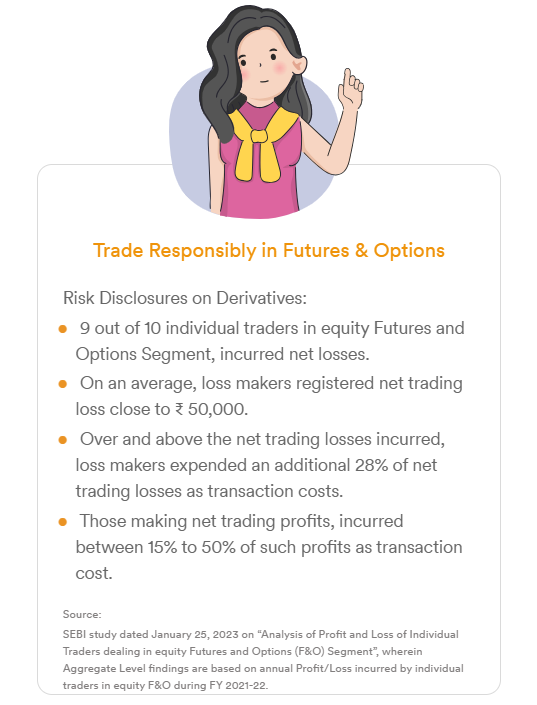
The above analysis is solely the opinion of the author, no way an assured tips/direction to trade, they are solely for educational purposes. Please do not trade with out a proper study and analysis, we will not be responsible for your loss. We are not SEBI registered.
#SafeBull, #pixarts.Trade
Excellent observation.
Thank you for your feedback.