Finally!! 20000, What’s Next.
#safebull , Analysis , Educational , Learning
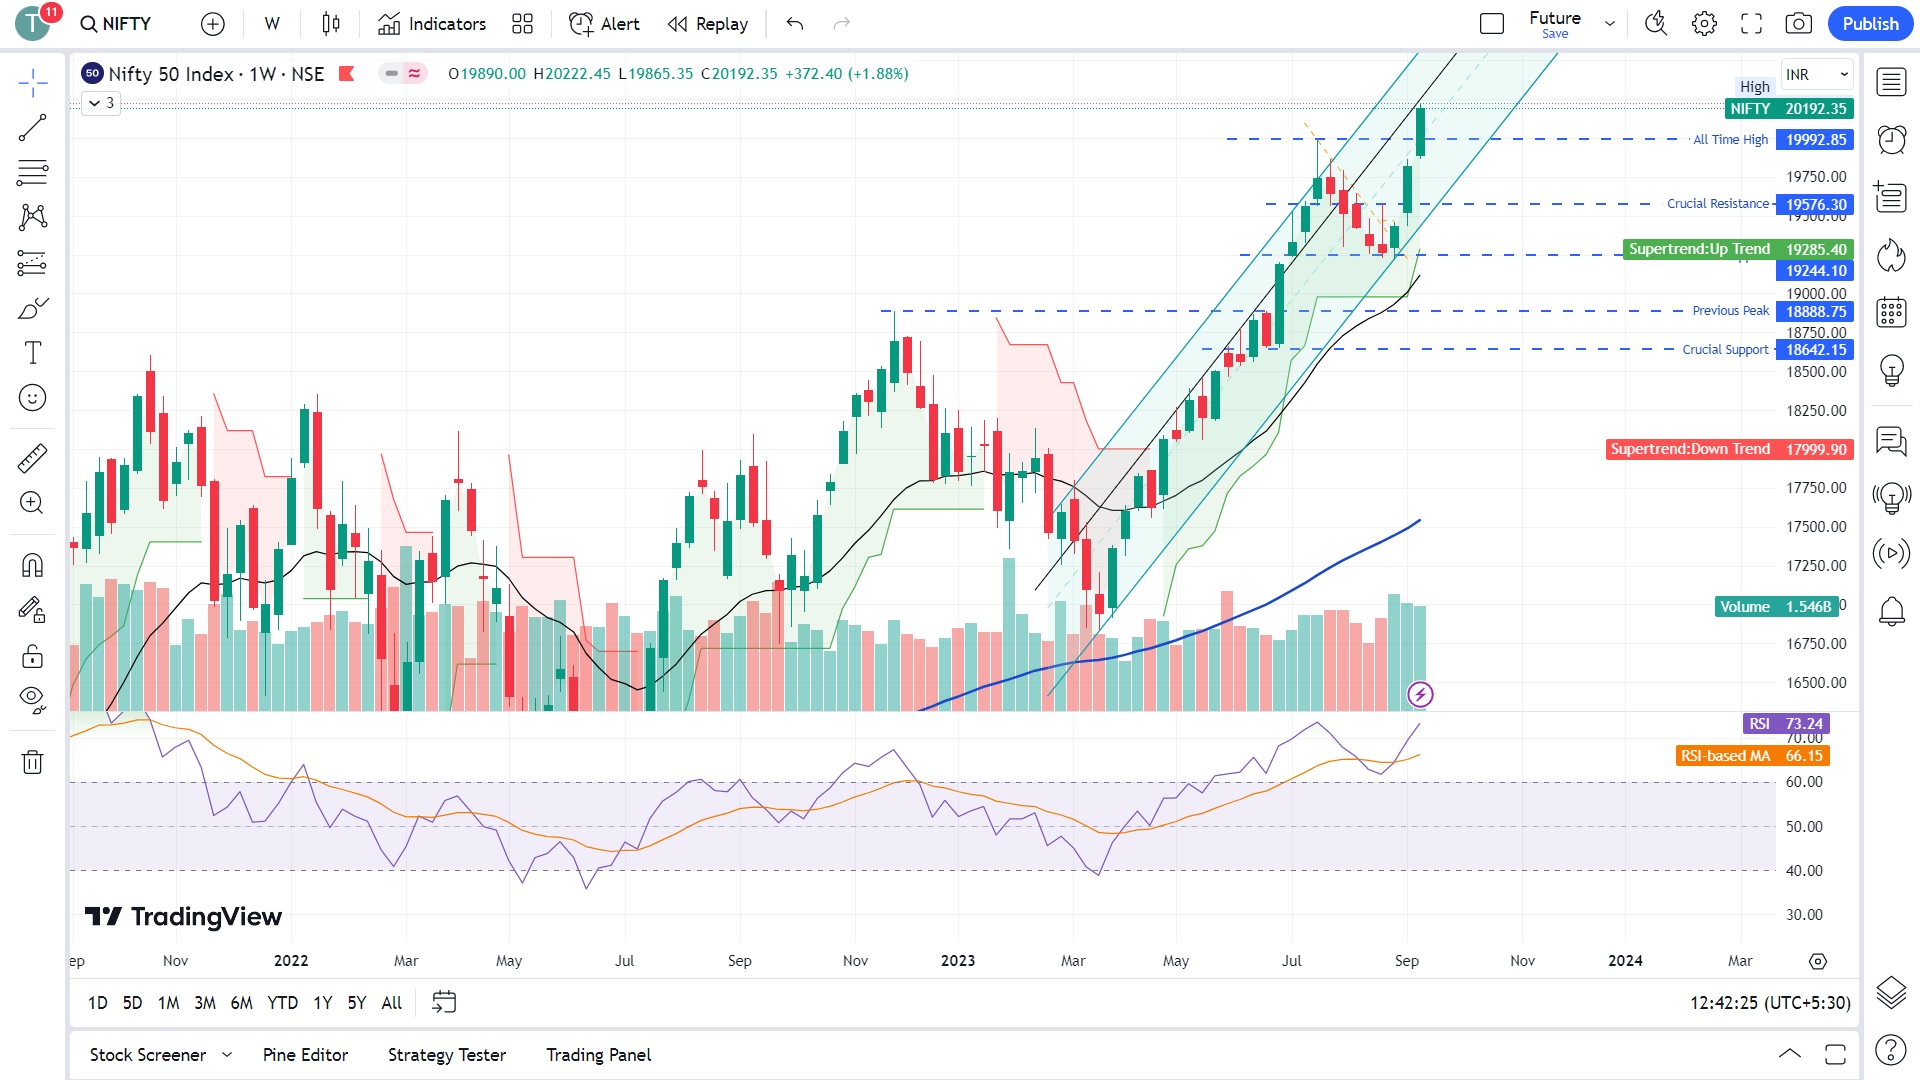
Weekly chart of NIFTY is very bullish, and through out the week it gained about 400 pts. 3rd consecutive week it consecutive week it formed a bullish Marabuzo. Buy on dips…[ Read More ]…
Our view about last expiry:
NIFTY 50
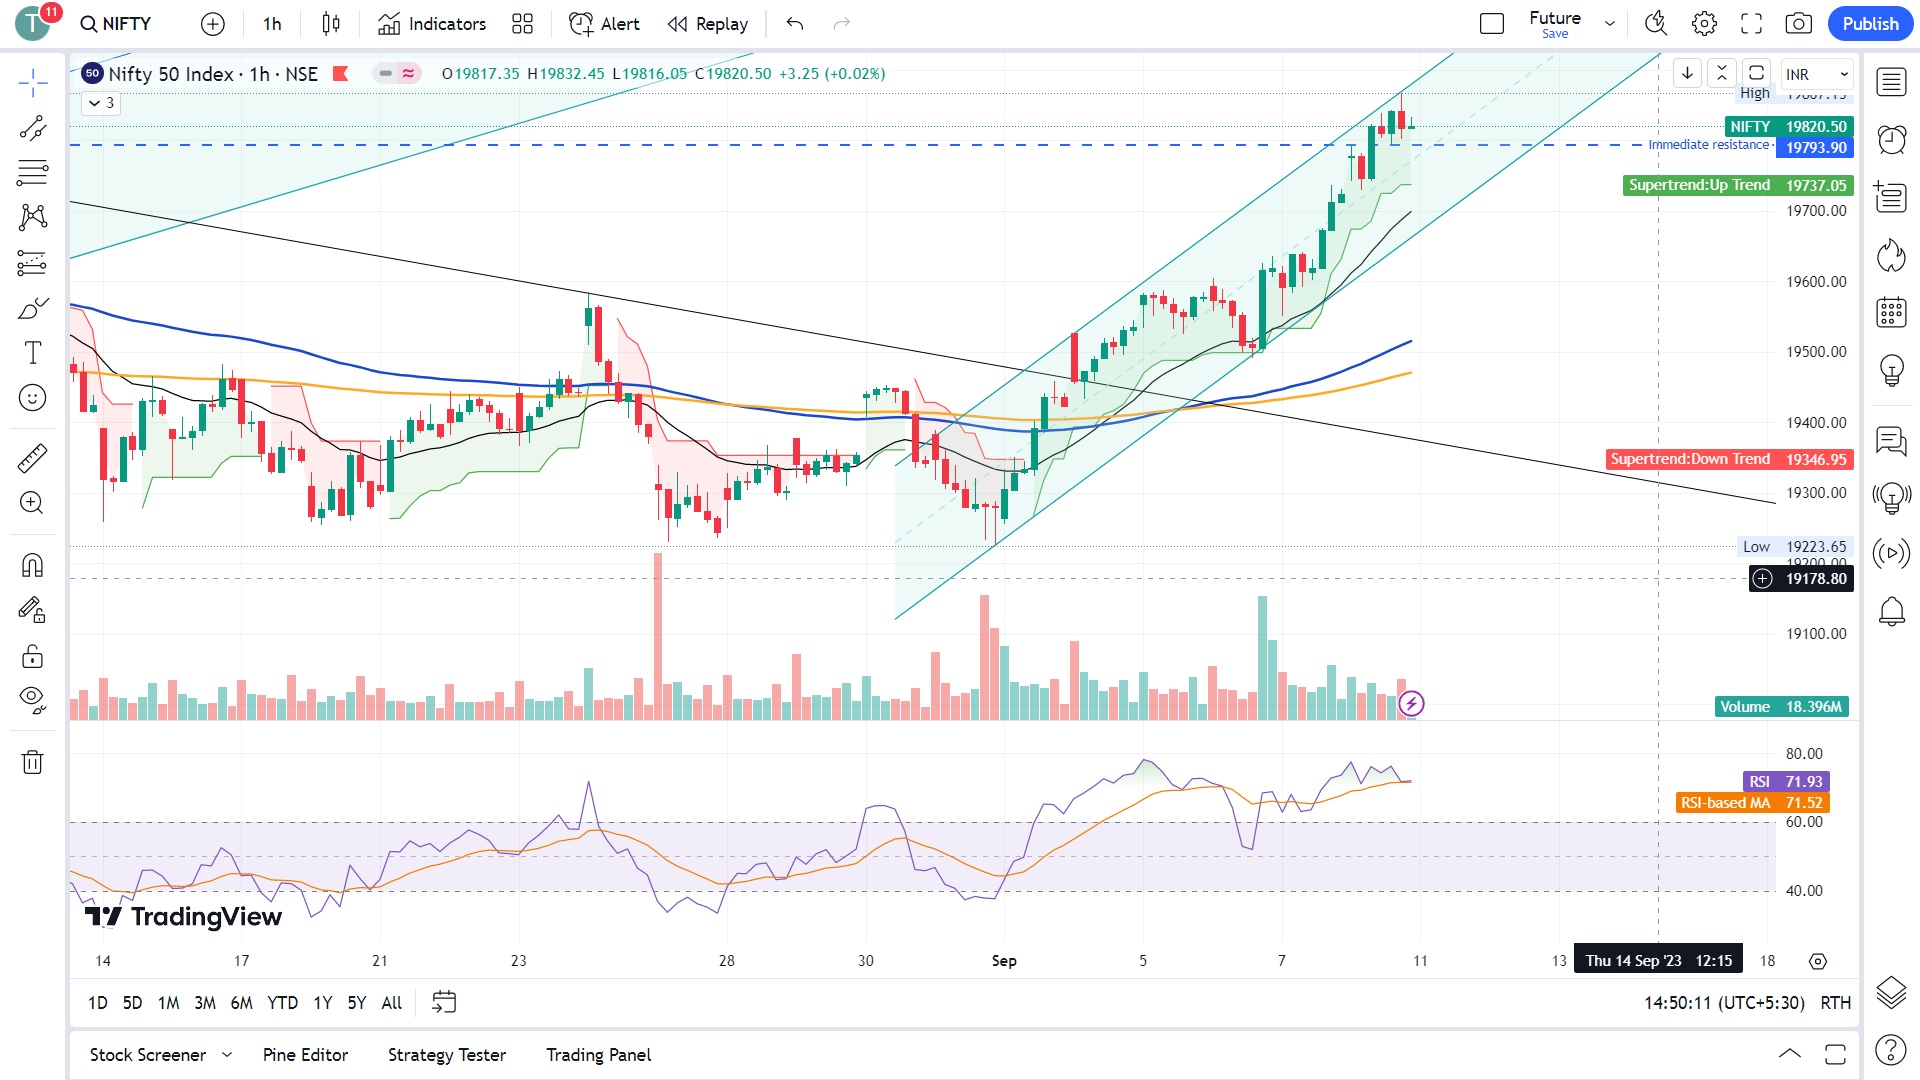
Another green week, closed positively and gained 435 pts with a good volume. Looks bullish. May be a new all time high.
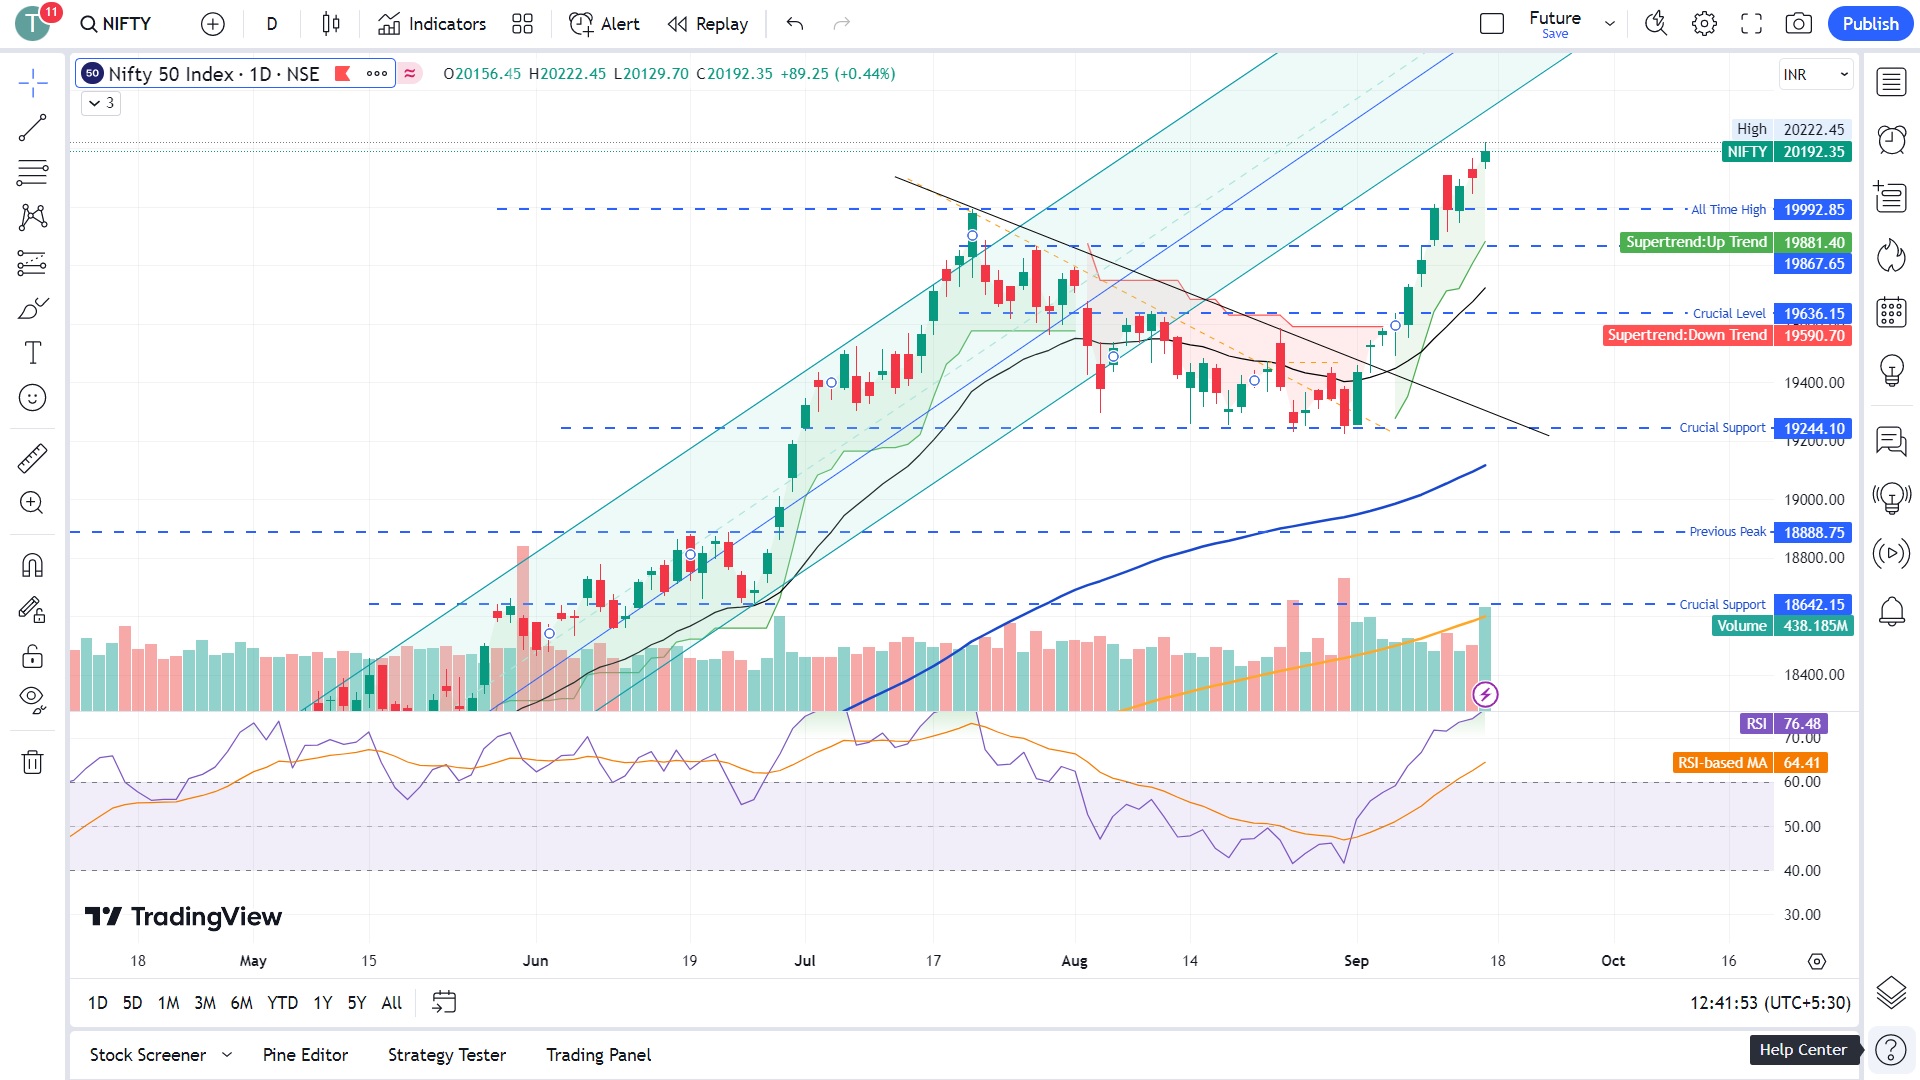
On daily chart it made 6 consecutive bullish sessions. Looks very Bullish. Buy on dip, is the way to participate on NIFTY.
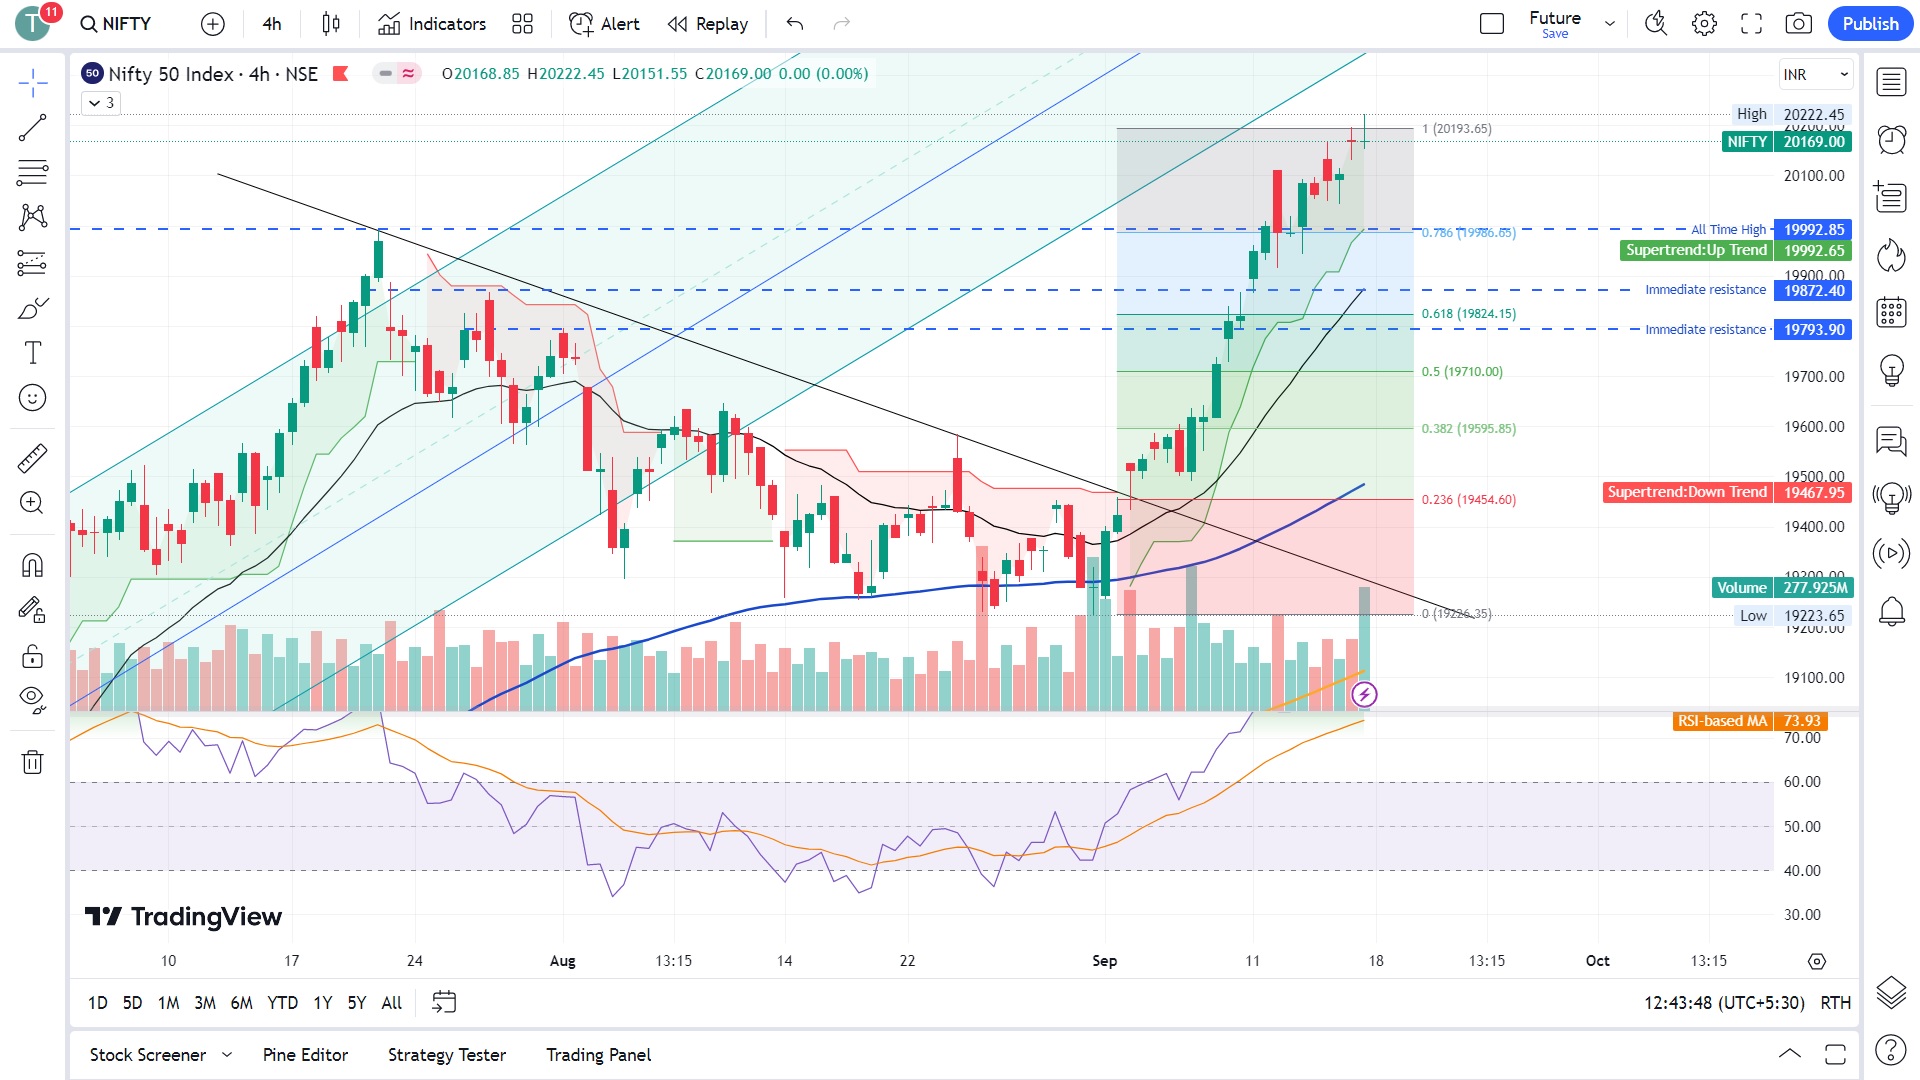
NIFTY 50, in hourly market is consolidating or forming a base at 19800 level. 20,000, is reachable.
RISK DISCLOSURE!!!
- 9 out of 10 individual traders in equity Futures and Options Segment, incurred net losses.
- On an average, loss makers registered net trading loss close to ₹ 50,000.
- Over and above the net trading losses incurred, loss makers expended an additional 28% of net trading losses as transaction costs.
- Those making net trading profits, incurred between 15% to 50% of such profits as transaction cost.
BANKNIFTY
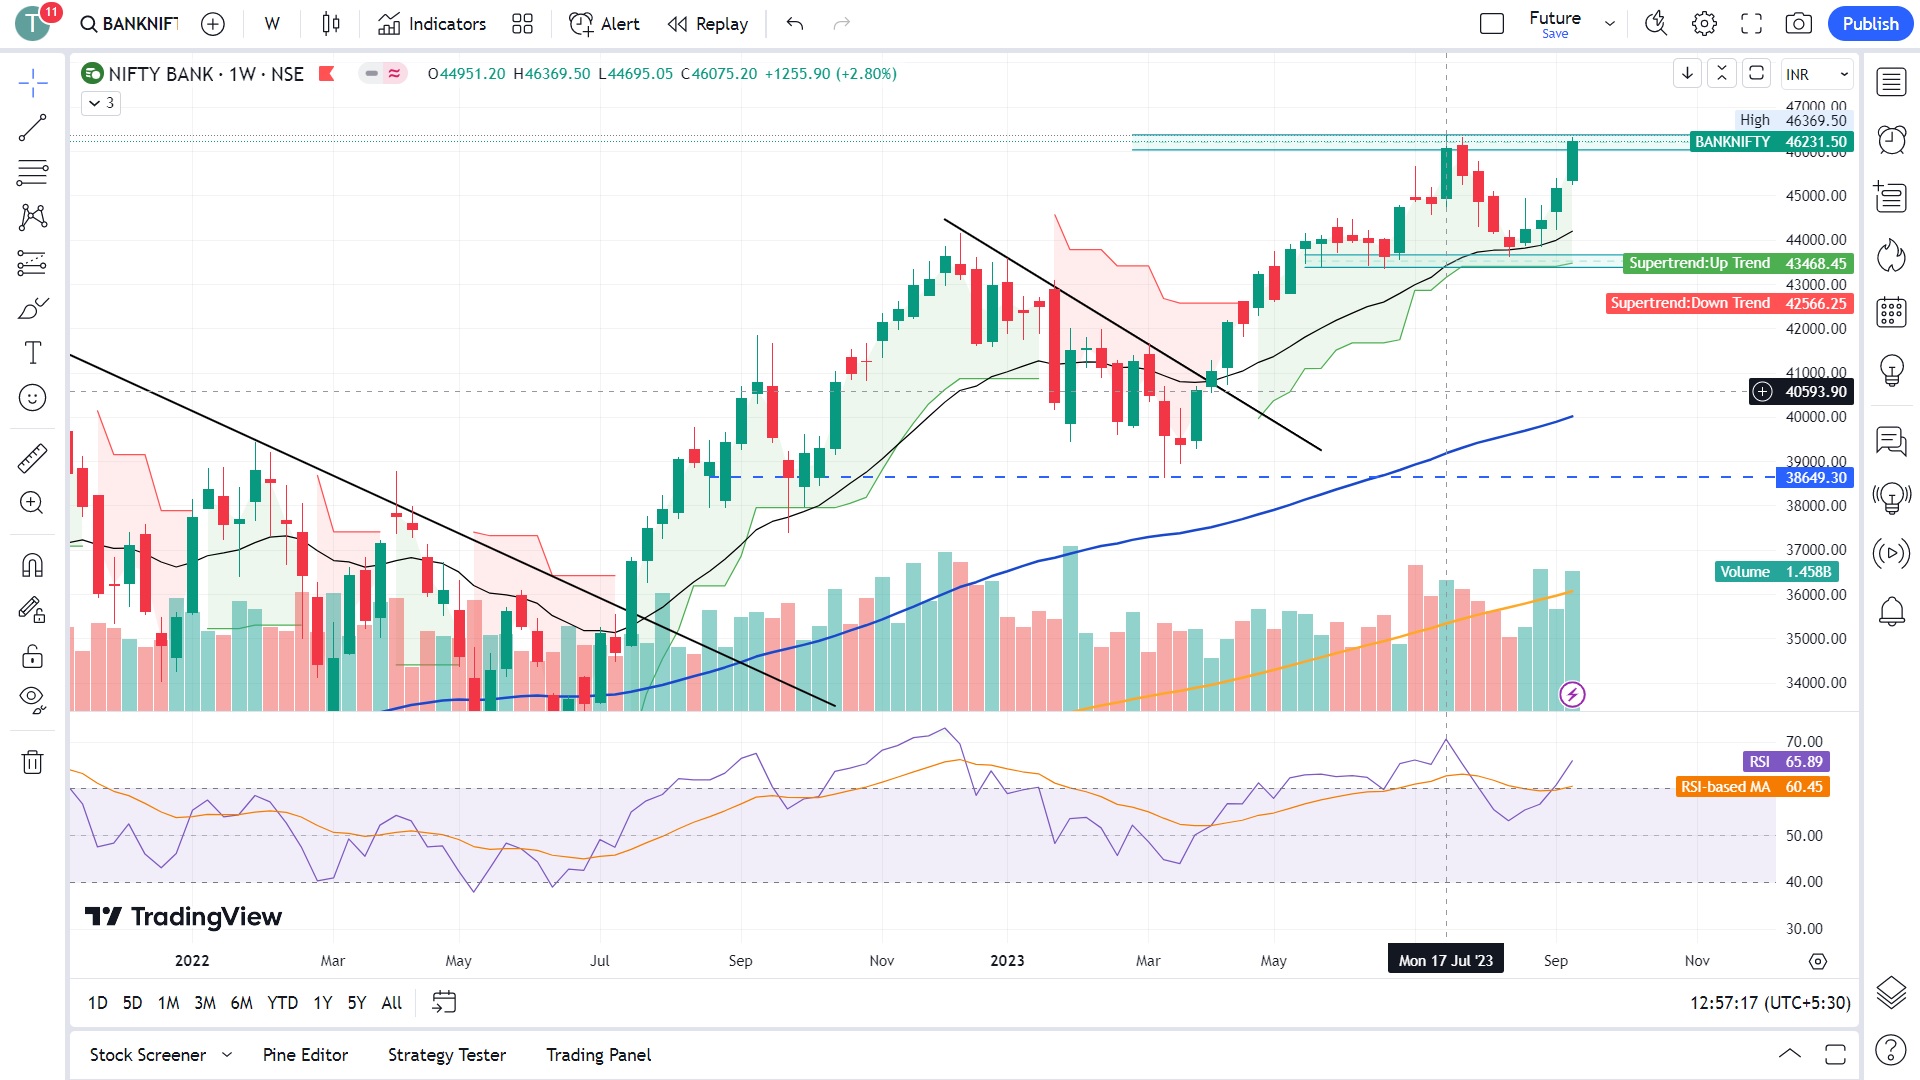
3 Consecutive weeks closed strongly on bullish note. Looks very bullish.
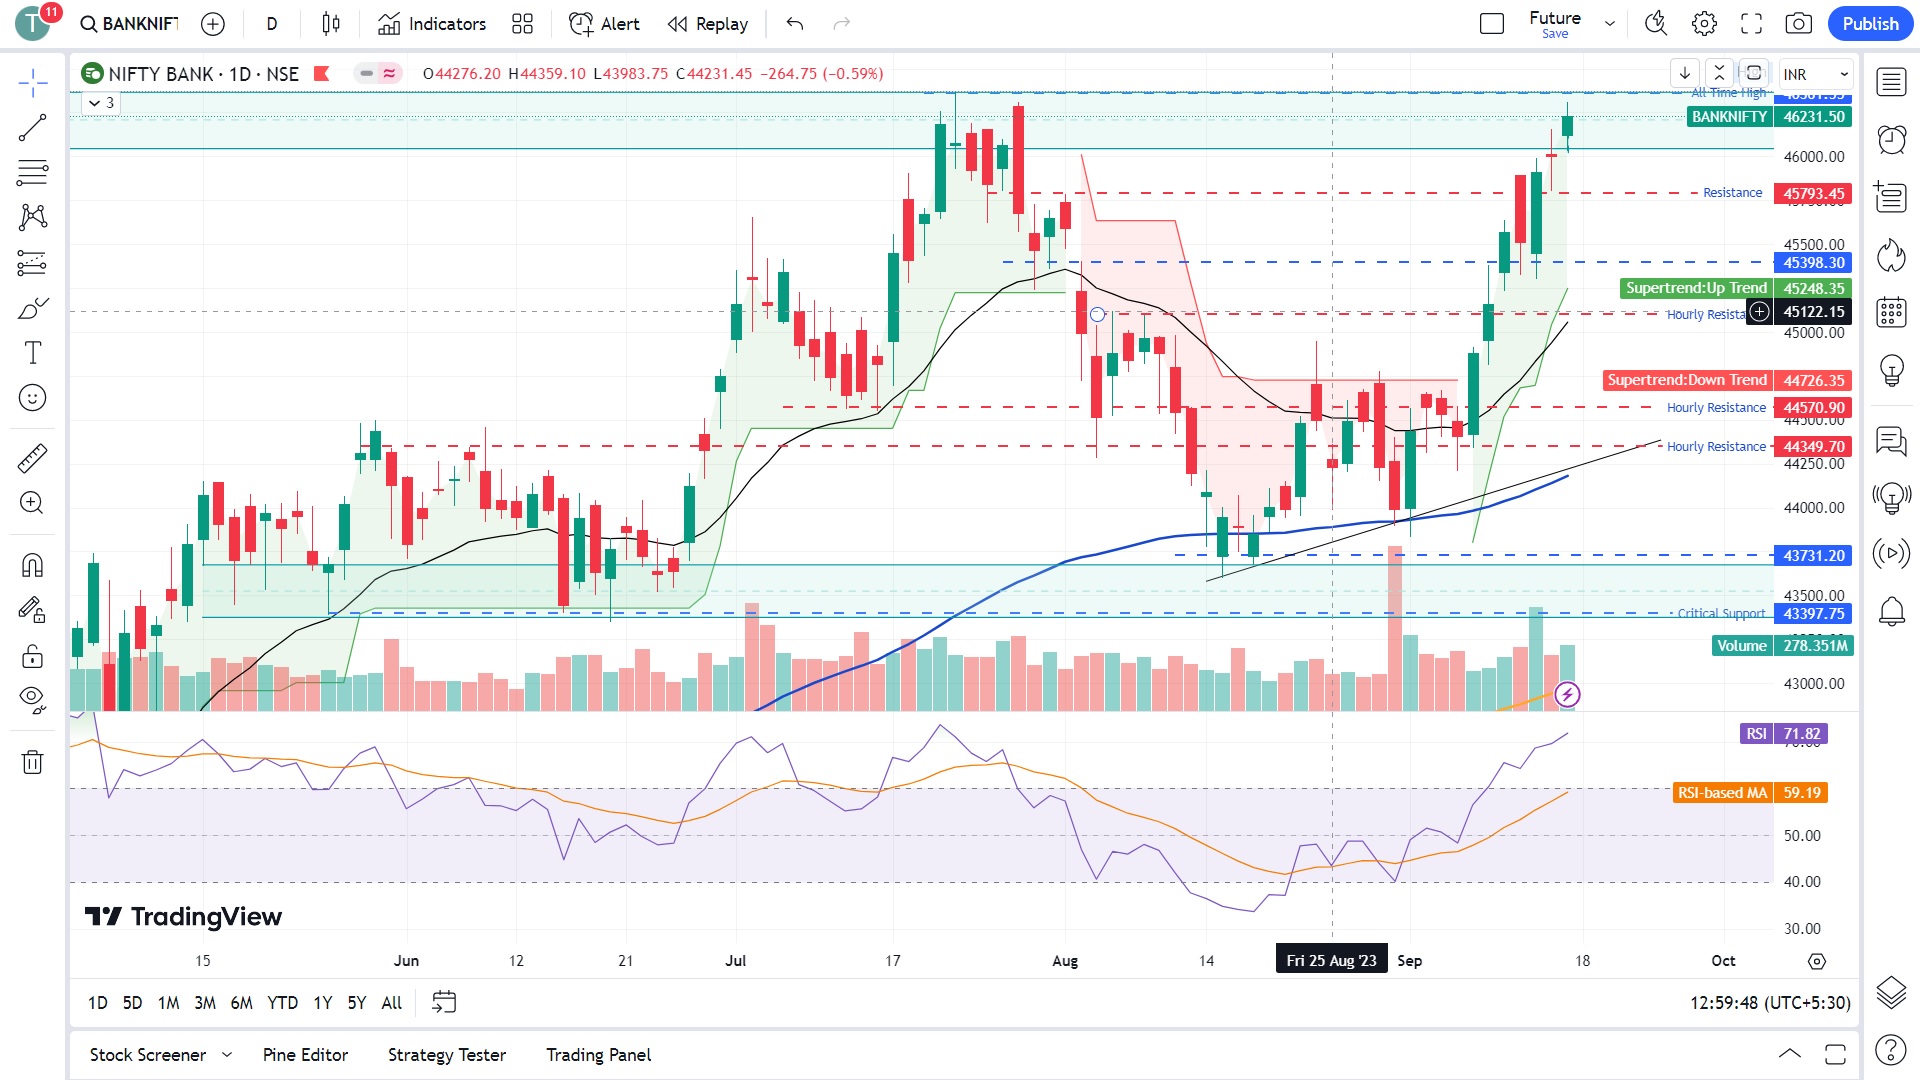
On daily chart, it has broken out from the trend line resistance. Looks bullish and more upside is expected.
On hourly time frame, after a bullish move, it is forming a base at 45000-45200 level, more upside is expected. Buy on dip.
The Market Traded – Finally!! 20000.
NIFTY continued to move strongly ahead, touched a new all time high and market closed above 20,100 level.
BANKNIFTY also move strongly on bullish side, and nearing the previous all time high at 46,366.
……
What does the technical say about next week, NIFTY at 20000, and beyond.
NIFTY 50
Weekly chart of NIFTY is very bullish, and through out the week it gained about 400 pts. 3rd consecutive week it consecutive week it formed a bullish Marabuzo. Buy on dips for swing.
On daily chart, NIFTY 50 is moving into uncharted territory, New all Time, yet again on previous session. Buy on Dips.
On shorter time frame, NIFTY seems to be consolidating, which is a good sign. It is forming a base for another leap.
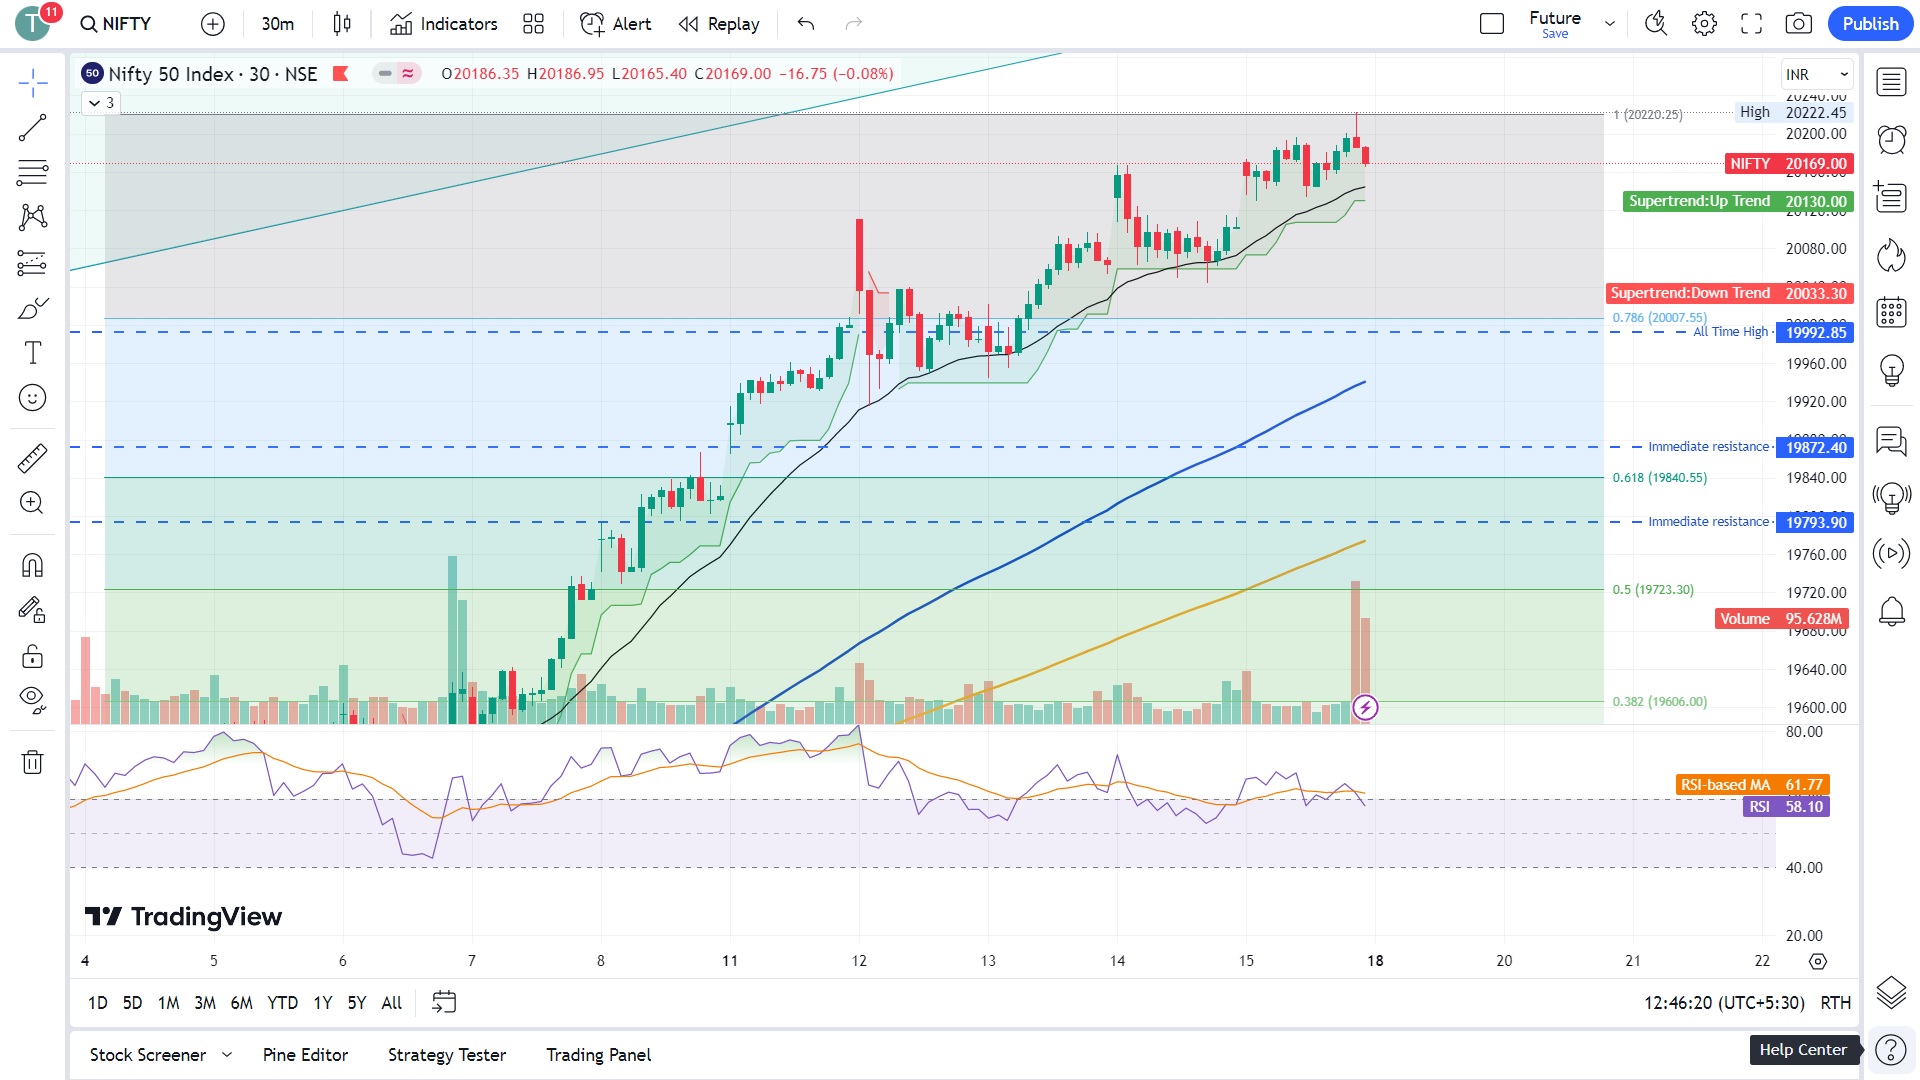
Important Levels:
- Resistance – 20200 – 20300
- Support – 20000 – 20100
- No trading Zone – 19900 – 20000
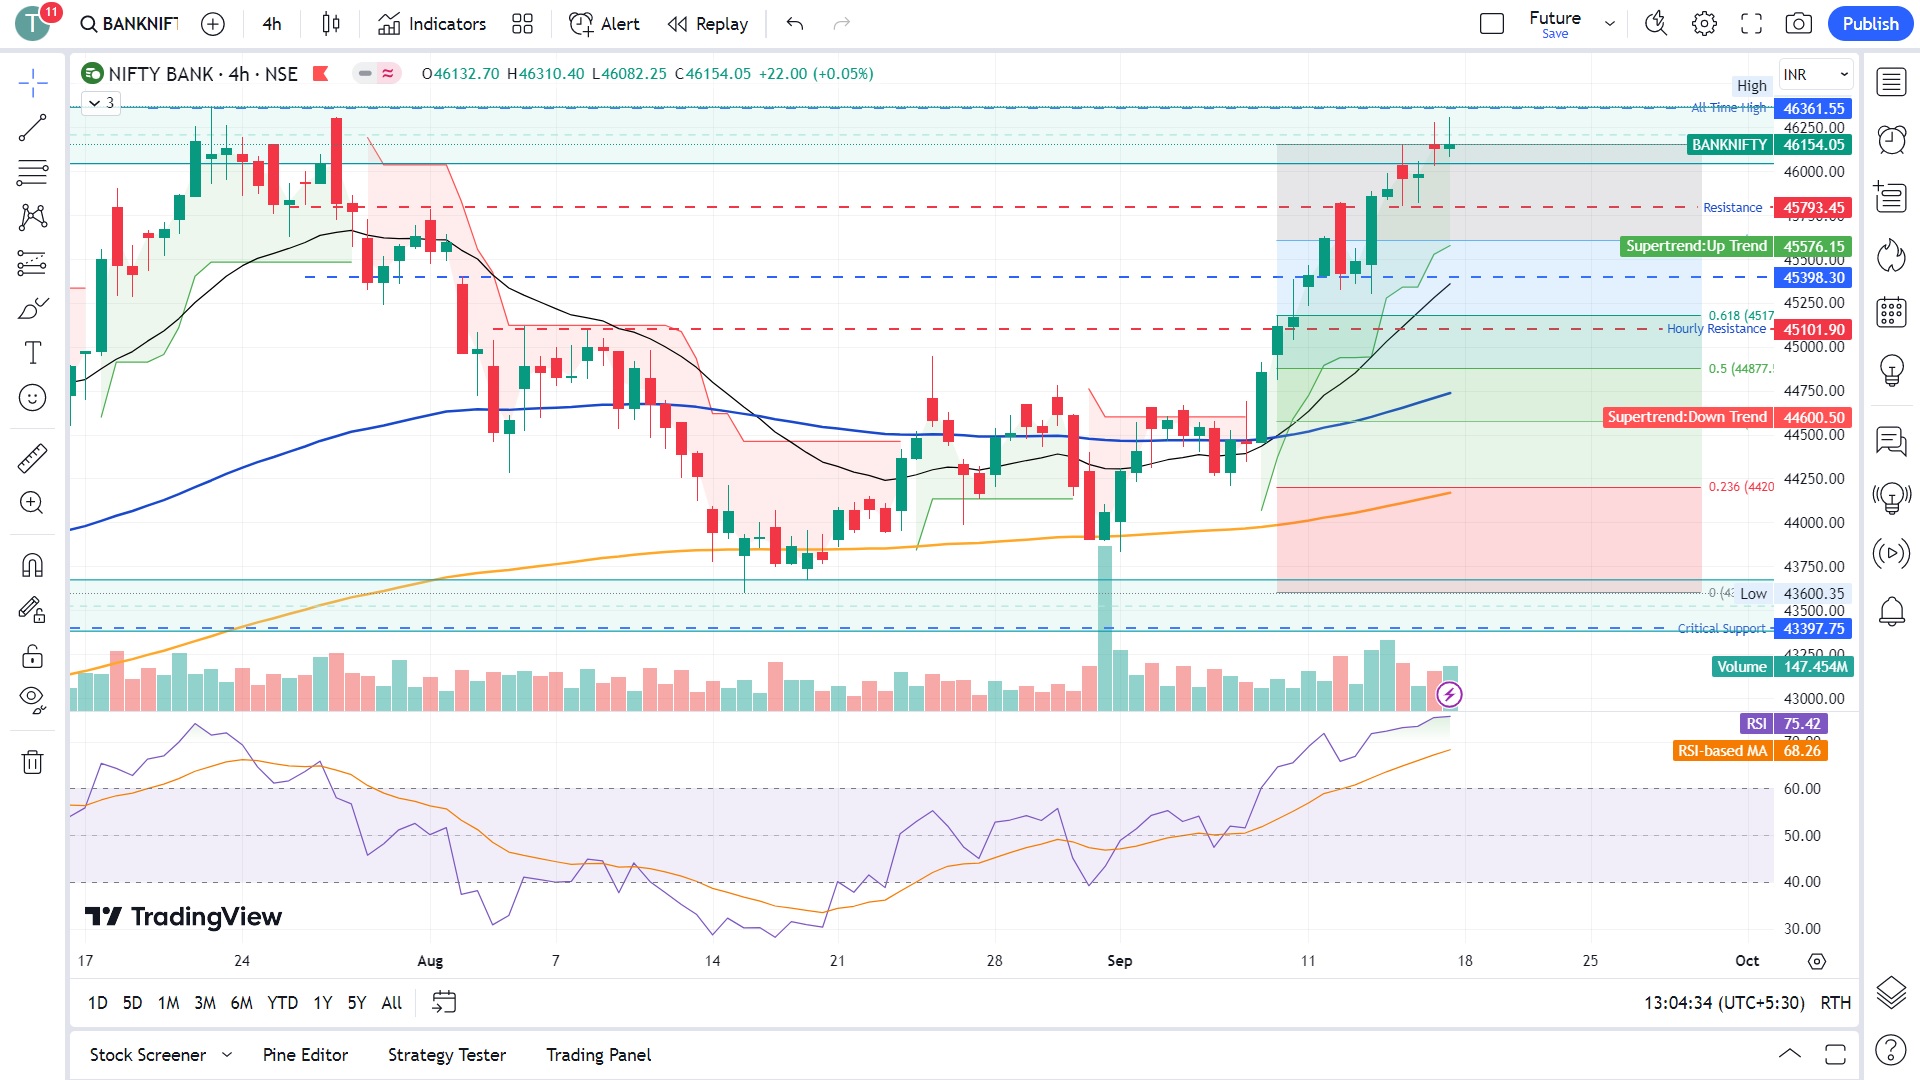
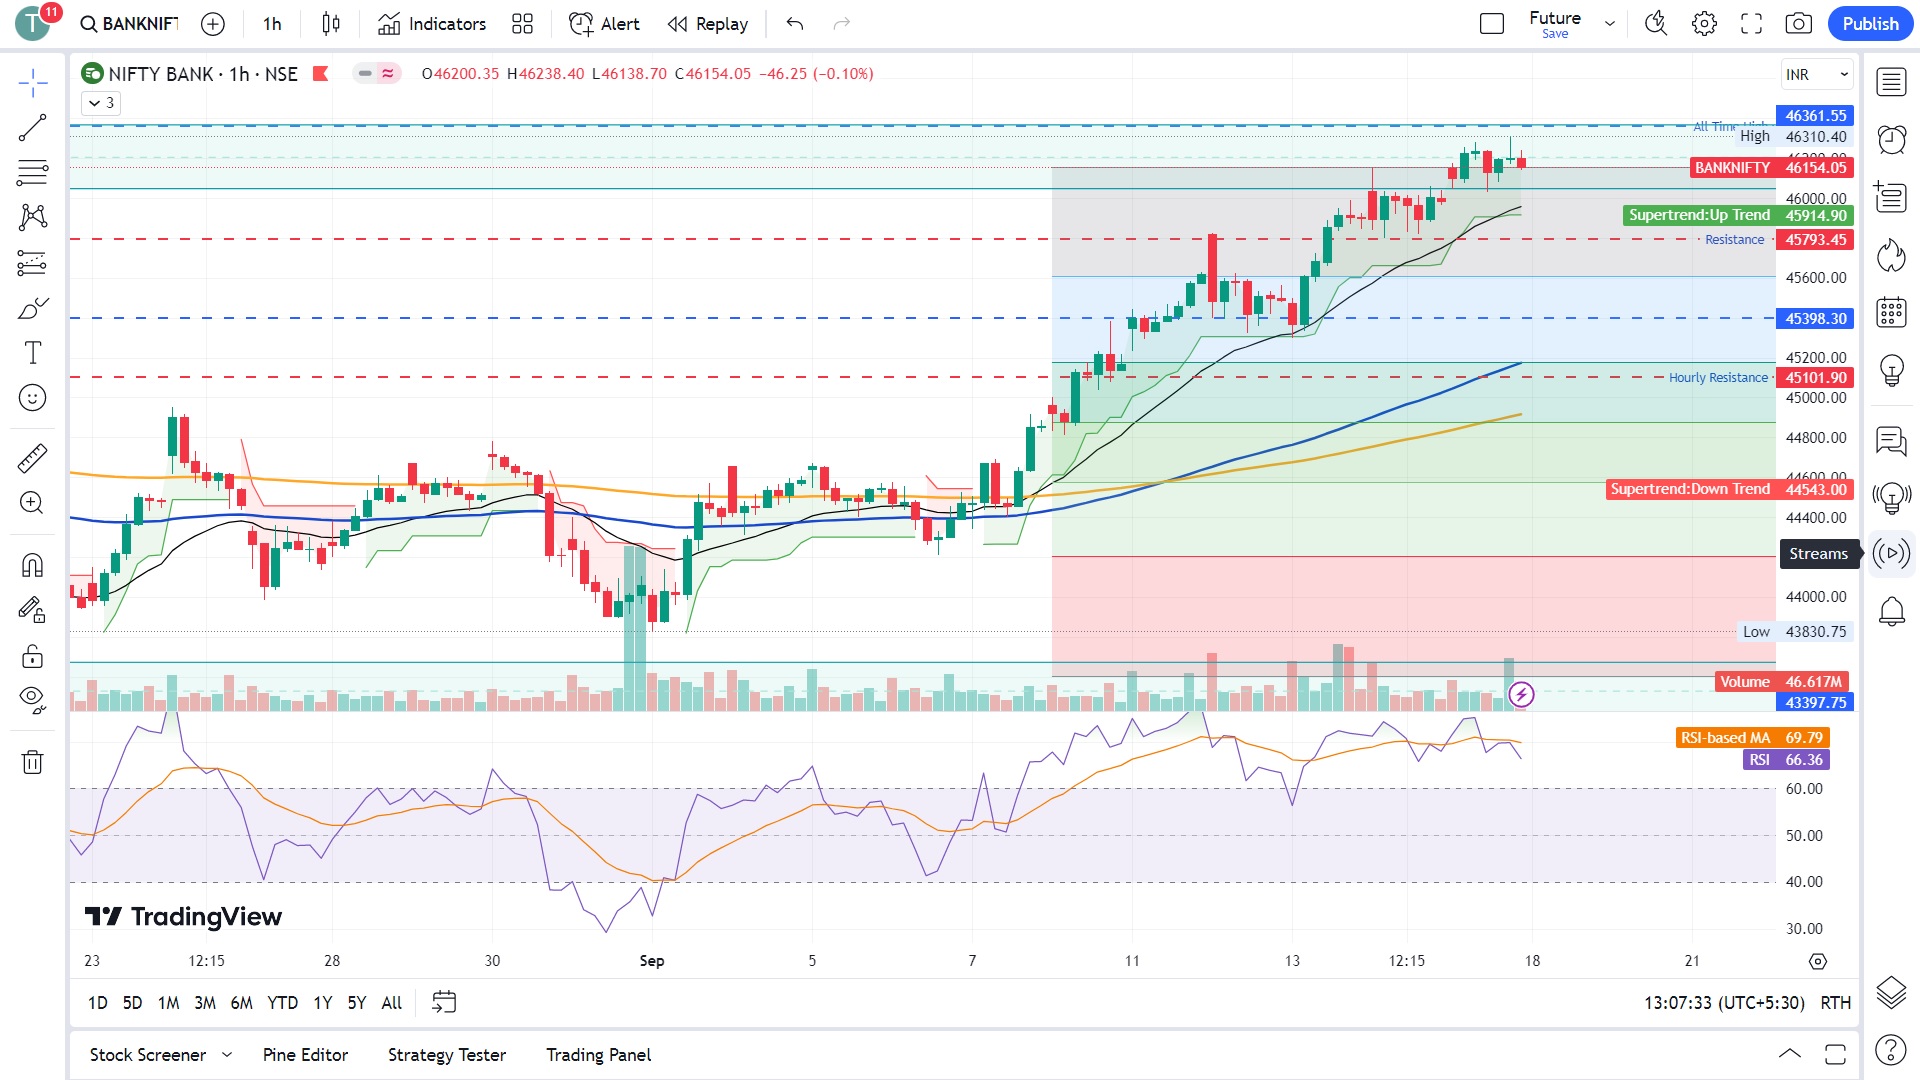
BANKNIFTY
BANKNIFTY
4th Consecutive week closed in green, last week alone it gained 950 pts. And a strong Marabuzo formed. Trading near the all time high. Buy on dip.
On Daily time frame, formed a bullish candle after a Doji. Trading near a point from where it experienced a strong selling last time. Needs to be cautious.
On shorter time BANKNIFTY is consolidating new a critical level and previous all time high. Time to play cautious.
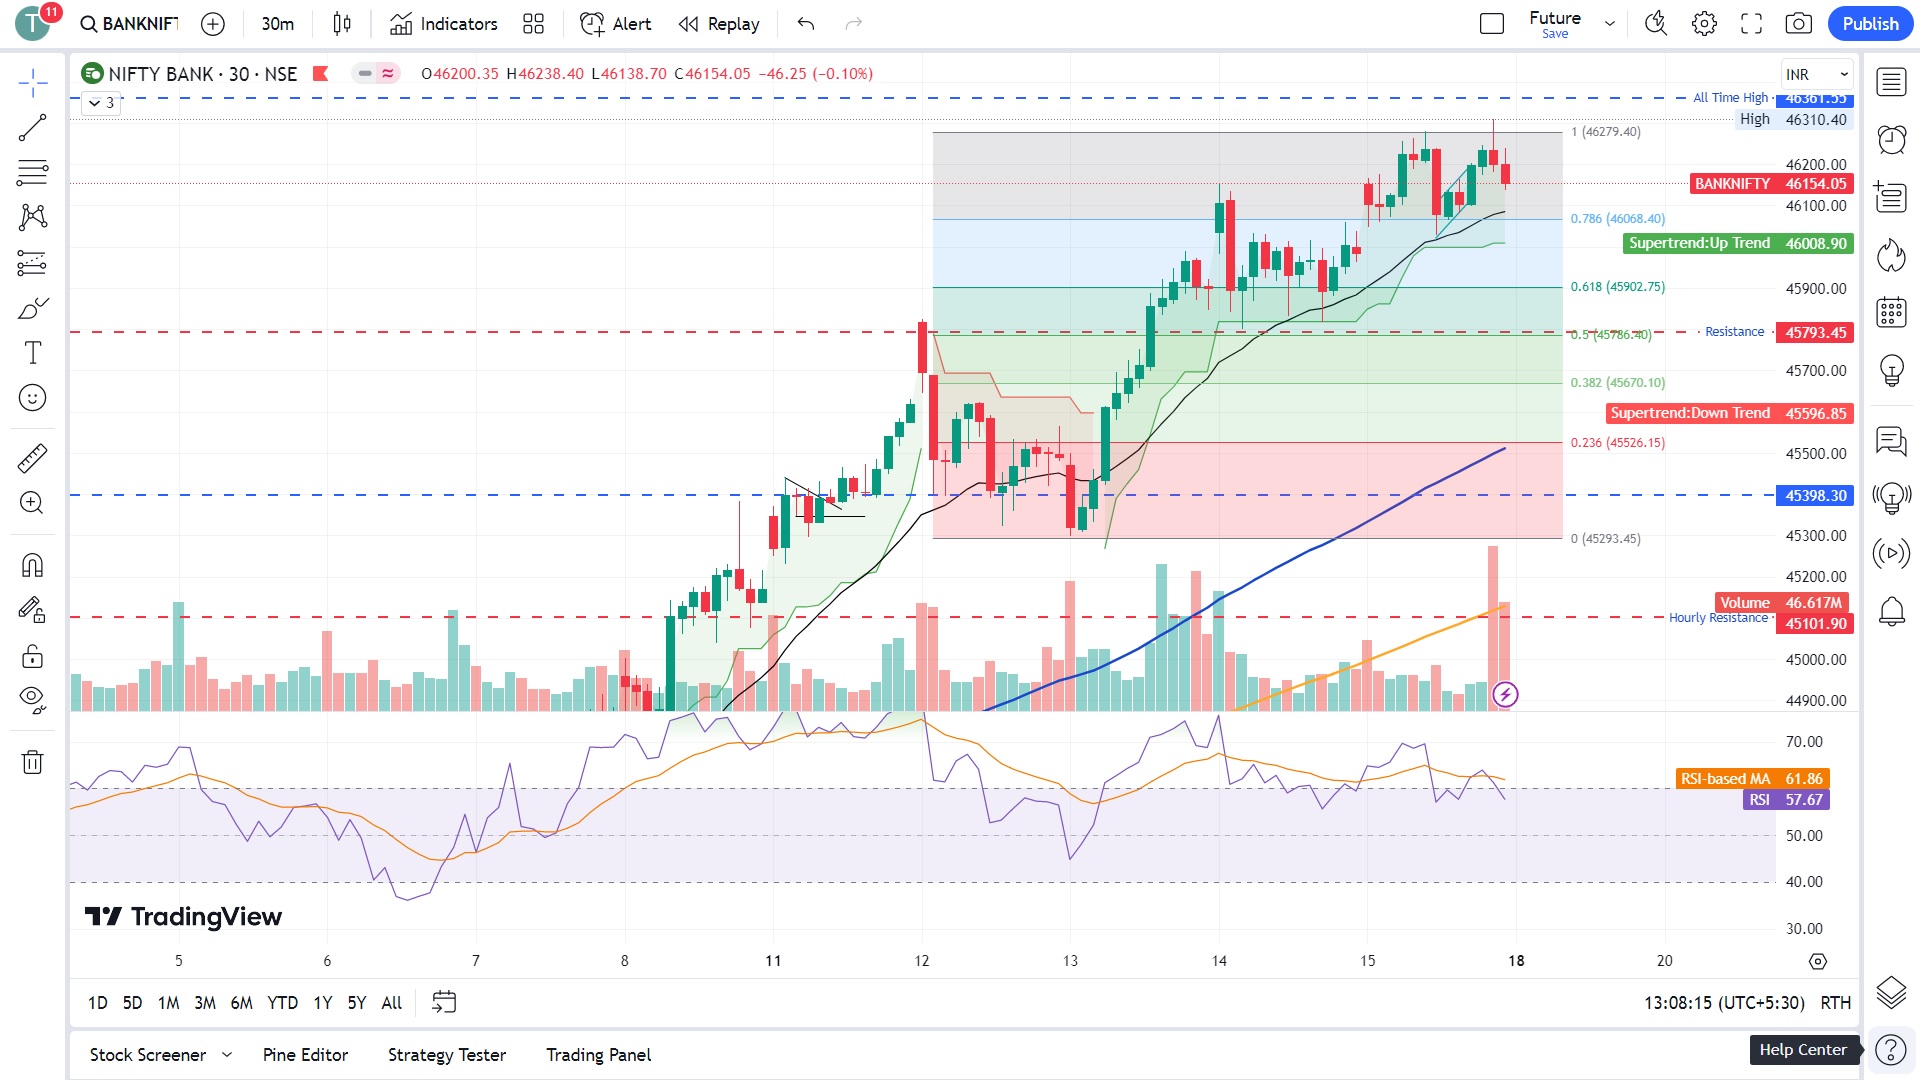
Important Levels:
- Resistance – 46400- 46500
- Support – 45900 – 46000
- No trading Zone – 45900 – 46000.
……
What does Data say, Finally 20000!!, What’s Next?
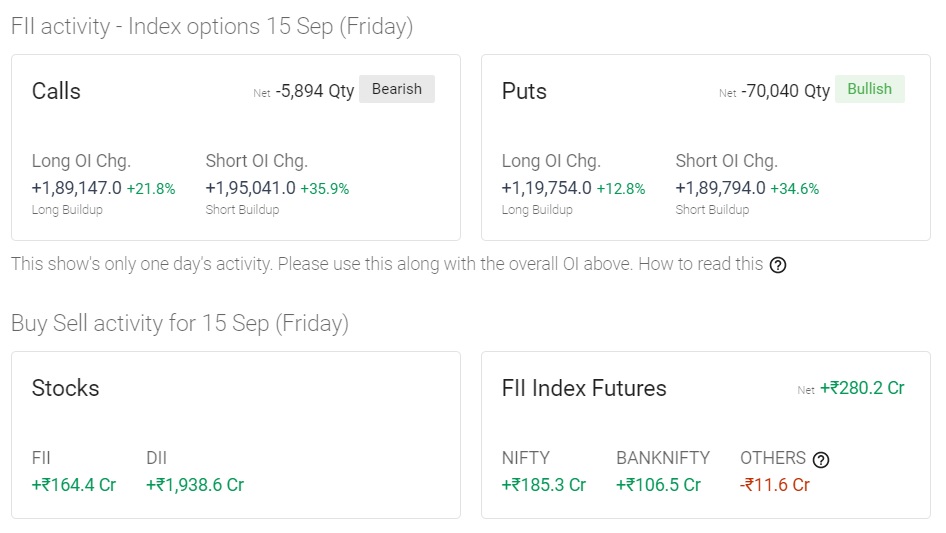
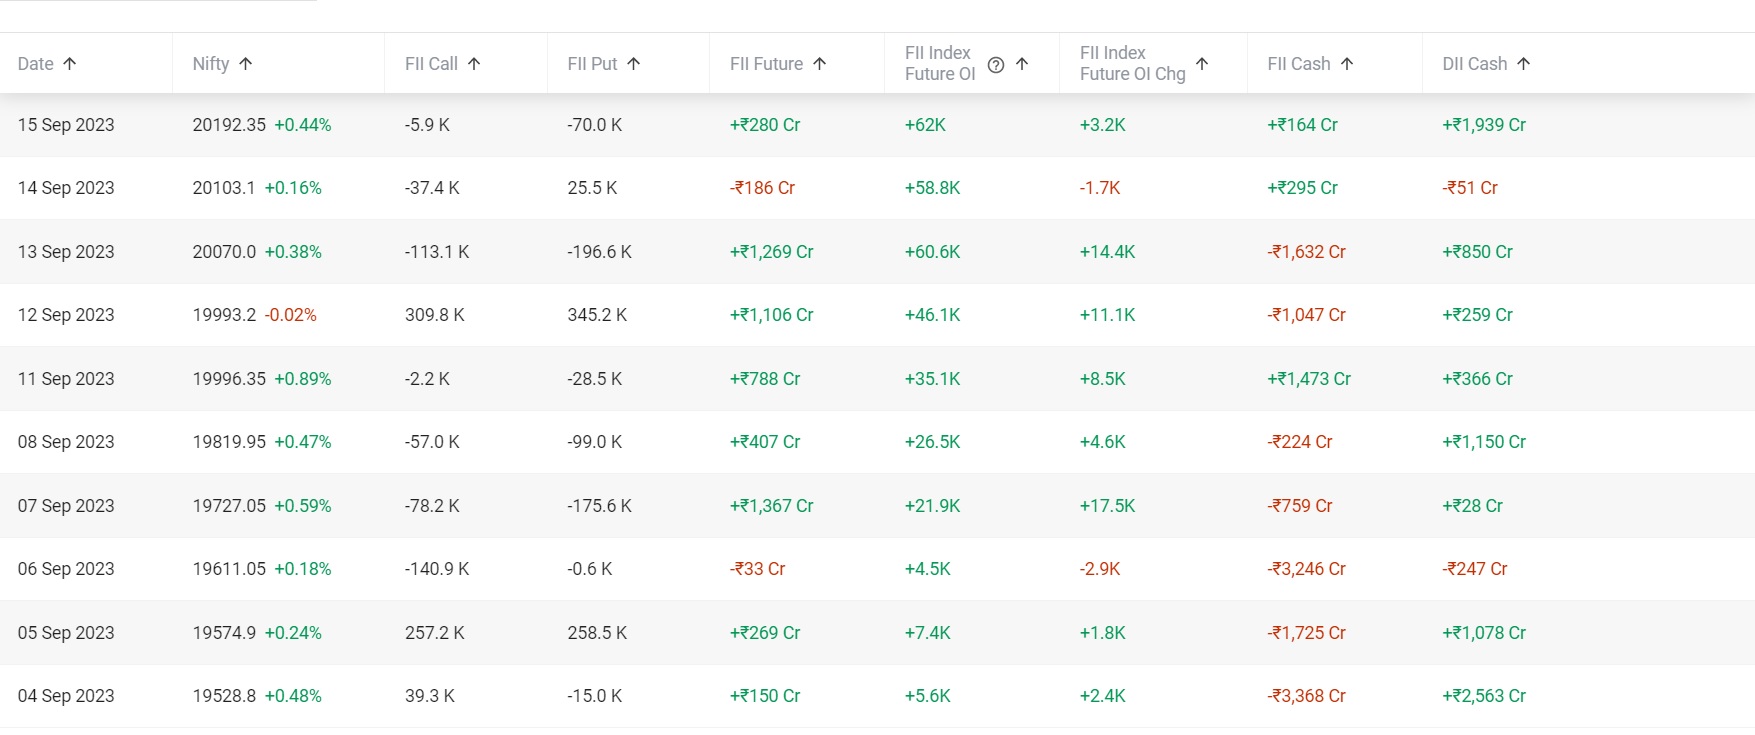
FII & DII Activity
- FII Cash :: ▲ +₹164.4 Cr
- FII Futures :: ▲ +₹280.2 Cr
- DII Cash :: ▲ +₹1,938.6 Cr
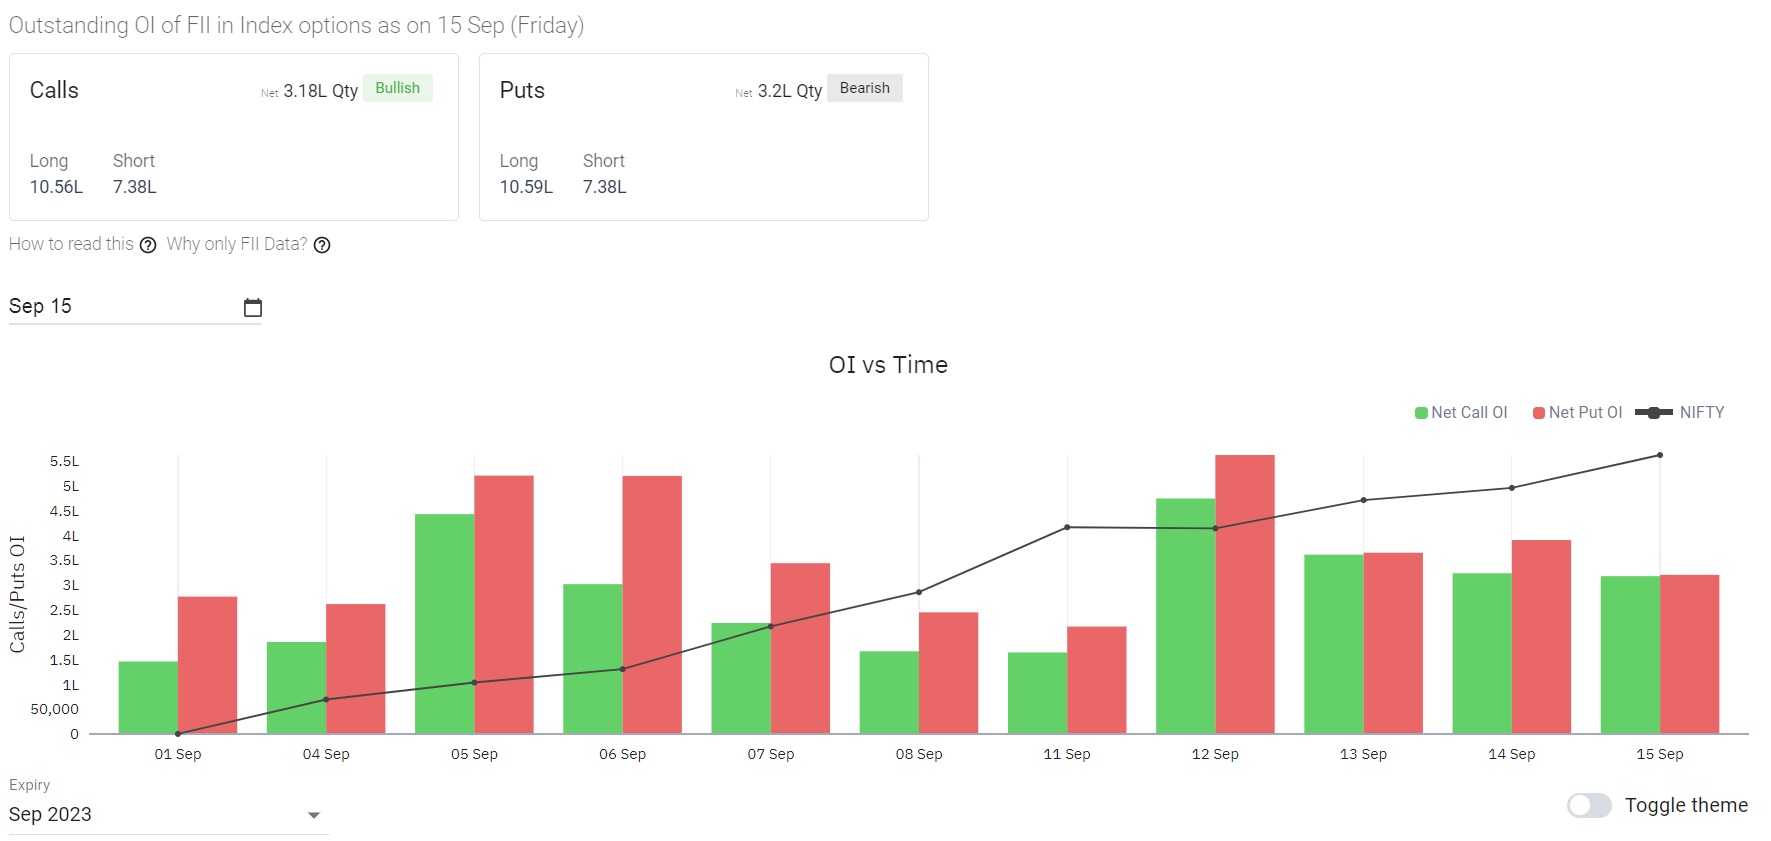
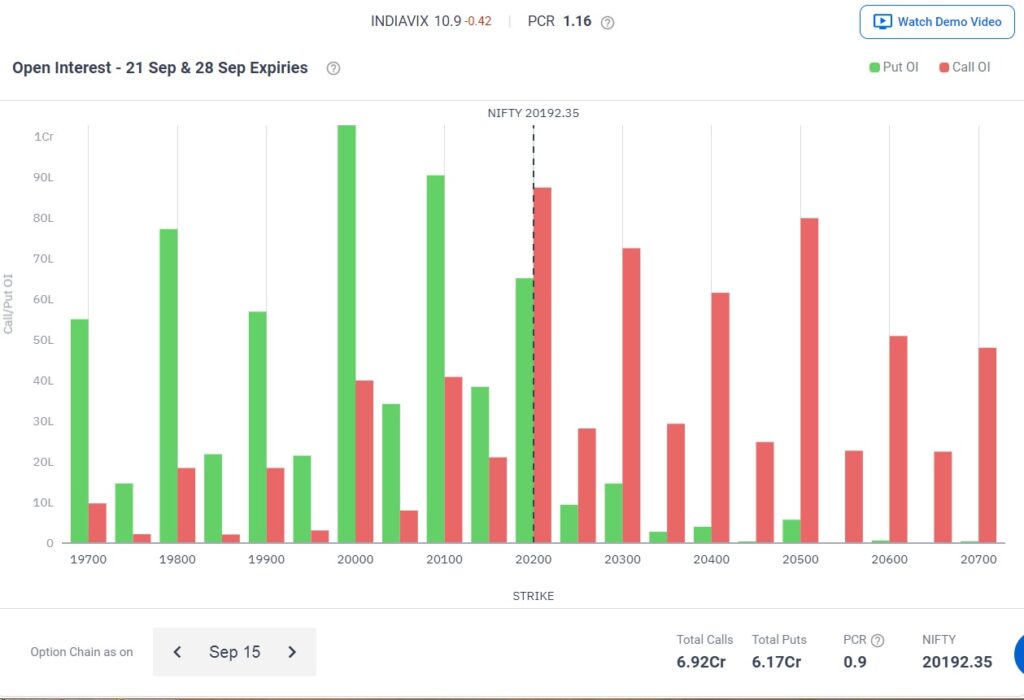
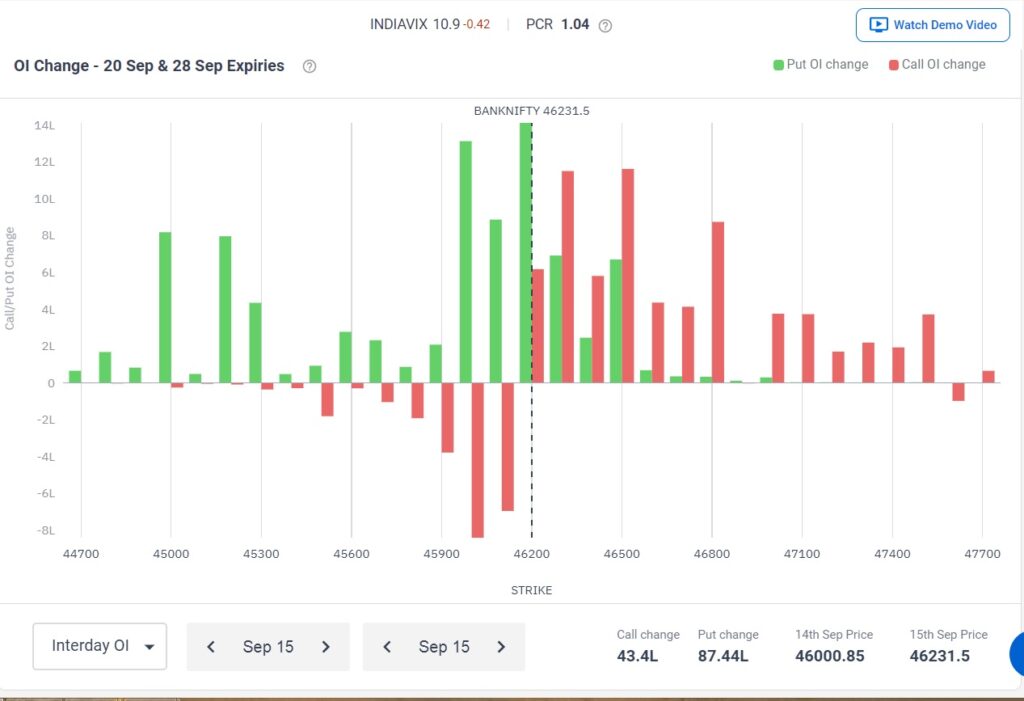
Open Interest (OI)-
Max OI Calls:: 20200 , 0.87 Cr
Max OI Puts:: 20000 , 1.02 Cr
Note:: OI suggests key Support at 20000, and Resistance at 20200.
** Datas are only for NIFTY 50
PCR – 0.9 (-) Flat to Bullish
……
Market Sentiments
World Markets – World market traded mostly Positive but US market closed in red.
GIFT NIFTY FUTURES – Closed around 20255.5 at 01:15am 15-09-2023
Events Upcoming
- 19 Sep Tue 12:00 AM Market Holiday – Ganesh Chaturthi India
- 20 Sep Wed 11:30 PM Fed Interest Rate Decision USA 5.50%
- 26 Sep Tue 07:30 PM New Home Sales AUG USA 0.714M
- 28 Sep Thu 06:00 PM GDP Growth Rate QoQ Final Q2 USA 2.10% 2.00%
- 29 Sep Fri 07:15 AM Caixin Manufacturing PMI SEP China
……
Researched, Analyzed & Drafted by :- Pixarts.Trade #safebull
CHECK OUT THESE POSTS!!…
- “Trailing Stop Loss, a way forward”
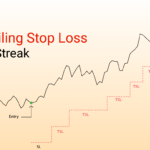 Initial trade in FINNIFTY stop loss got triggered then re-entered again, with defined risk, and trailed the trade to avoid getting loss and to close the day in green.
 - “Some move today in Indian Indices”
 “Could not capitalize much as system trailing stop loss got triggered, next time better to trail manually- a valuable lesson learned.”
 - ” All about today, the trades, and the win”
 Market opened flat as expected, and rallied some more points, allowing an exit for the put short due to short covering. Booked some profit.
 - “Wonderful Day & All well executed Trades”
 SHILLONG :: Following up with the trend since morning, VWAP in 15mins candle have dipped and Cumulative Delta divergence observed after 1st 15-mins candle(green) with negative Delta.
 - “An Intraday Close strangle- carried forward”
 Market opened gap up but within the estimated range, and at around 9:30am when Vix was crushed, trade (Strangle) was exited…[..]
The above analysis is solely the opinion of the author, no way an assured tips/direction to trade, they are solely for educational purposes. Please do not trade with out a proper study and analysis, we will not be responsible for your loss. We are not SEBI registered.
#SafeBull, #pixarts.Trade