Expiry Special – 11th May 2023
#safebull , Analysis , Educational , Information , Learning , Market
On weekly chart market looks very bullish, forming a big green after a weekly pause and nearing the all time high, and on the past few days VIX seems to rise despite the rise in the share market which is a good sign and also the market mood is also seems to cool off extreme Fear despite bull run.
And the market is moving towards all time high…[ Read More ]…
::IMPORTANT ALERT !!!:-
- Read the Disclaimer.
- For intraday follow price action in shorter time frame.
- This just a personal opinion.
TECHNICAL ANALYSIS
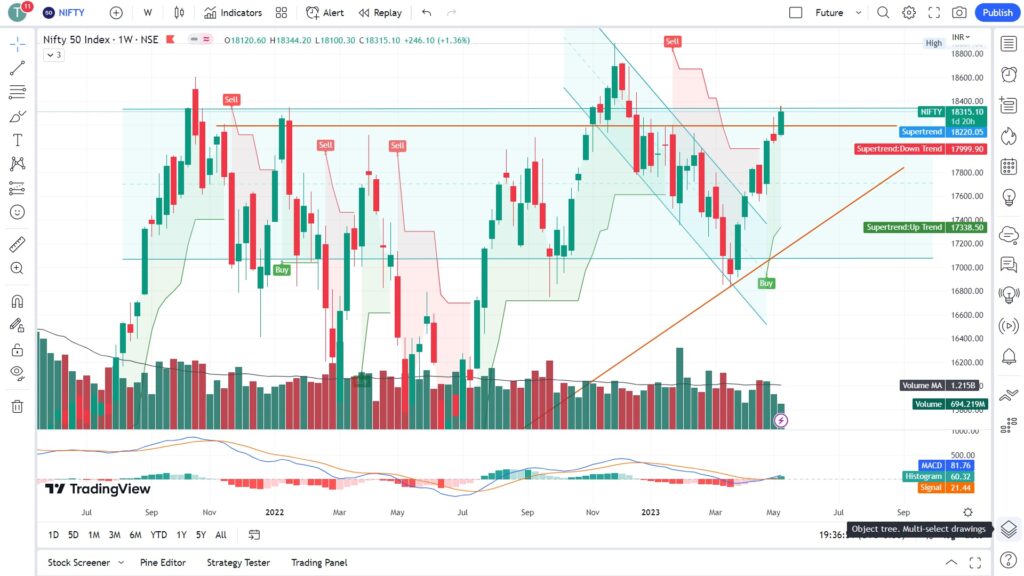
Weekly Chart Analysis
On weekly chart market looks very bullish, forming a big green after a weekly pause and nearing the all time high, and on the past few days VIX seems to rise despite the rise in the share market which is a good sign and also the market mood is also seems to cool off extreme Fear despite bull run.
And the market is moving towards all time high.
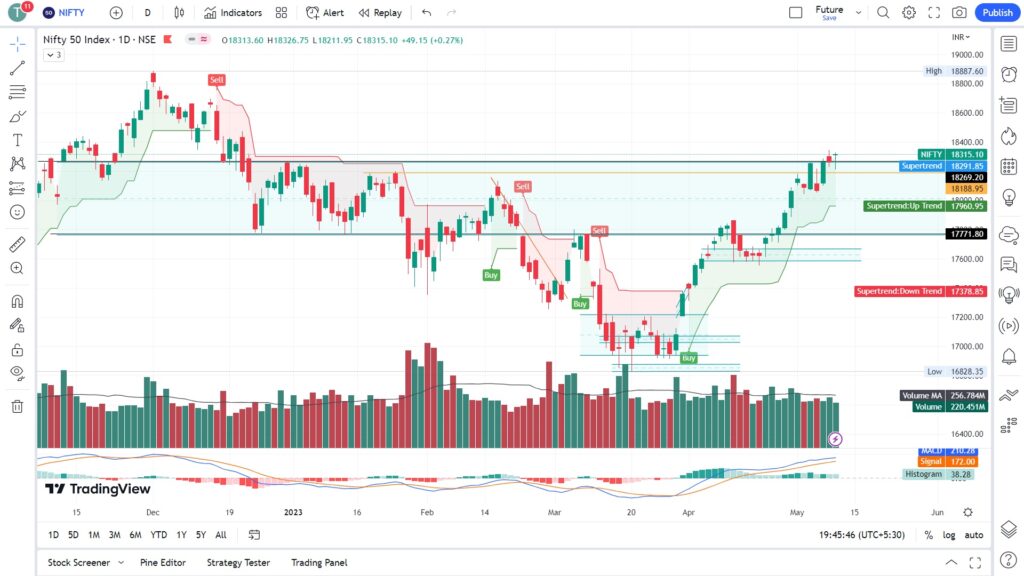
Daily Chart Analysis
A long legged Doji like Dragonfly candlestick formed at the daily chart, it has formed after a big bull run – it could mean a bearish ready but at the same time, it has formed after a correction in the previous session- which means it could be an indication of another bullish push. Hence on daily chart it is bit confusing, but I am little leaned towards bullish side. If markets opens a little gap up or flat as the early trends suggests, it could mean a bull rally tomorrow. We need to be worried if the market opens below 18250, or trade below 18250 level, but avoid shorting immediately.
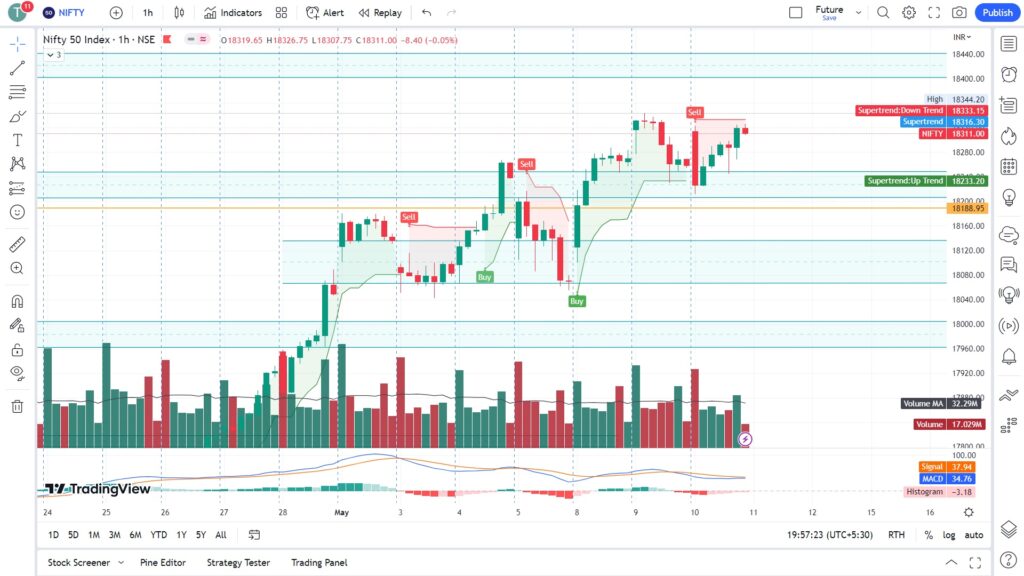
Hourly Chart Analysis
In hourly chart, market been range bound for for quite sometime now between 18250 to 18350 and presently it is trading around upper ceiling, therefore expectancy for break out is very high. If tomorrow markets gap up or opens flat then moves towards 18350 level, we can expect some good upmove.
DATA ANALYSIS
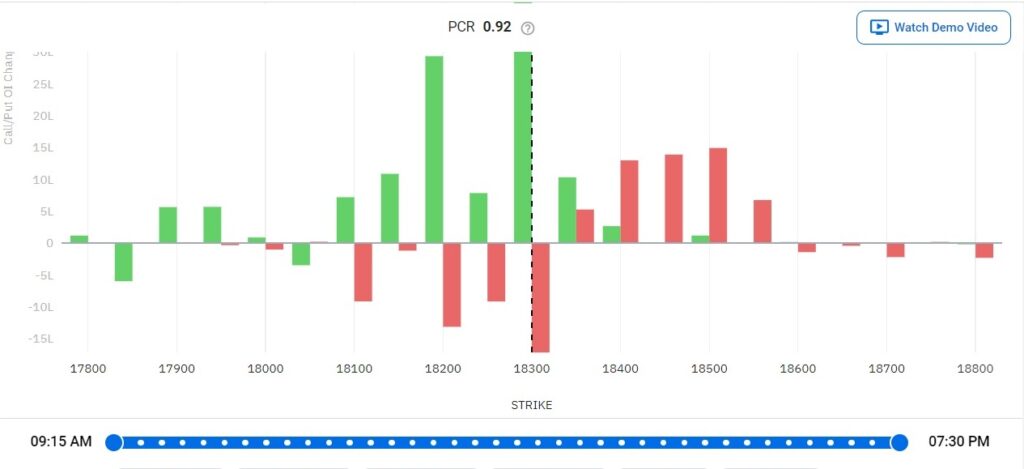
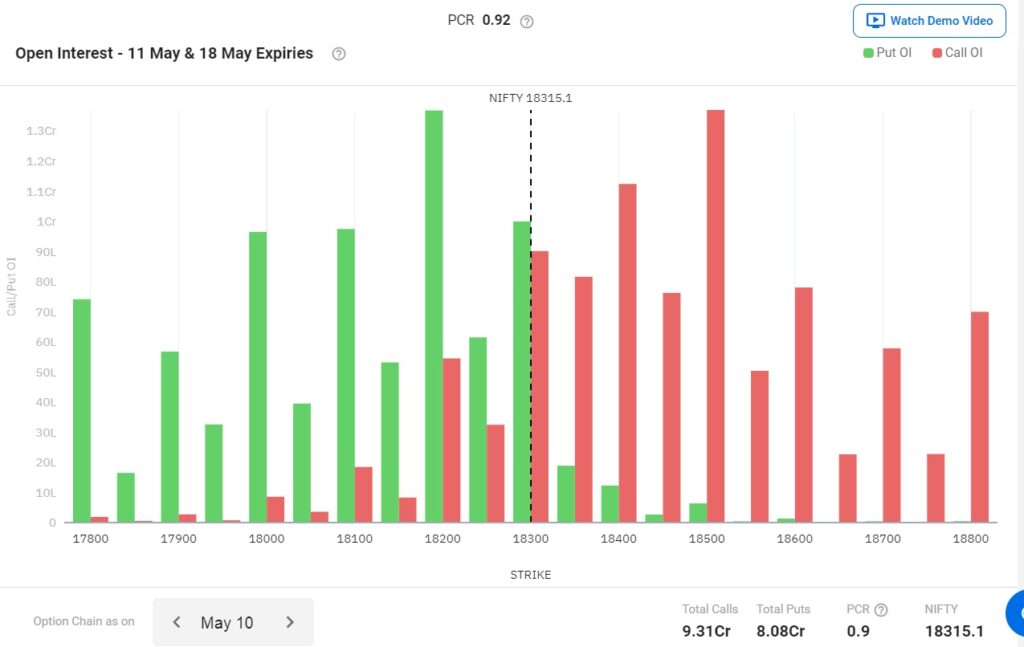
OI Data
More calls written then puts overall, with good support at 18200 and resistance at 18500. However if we observe OI data today 43Lakhs written at 18300 level, and huge unwinding in calls, make the bulls in full control.
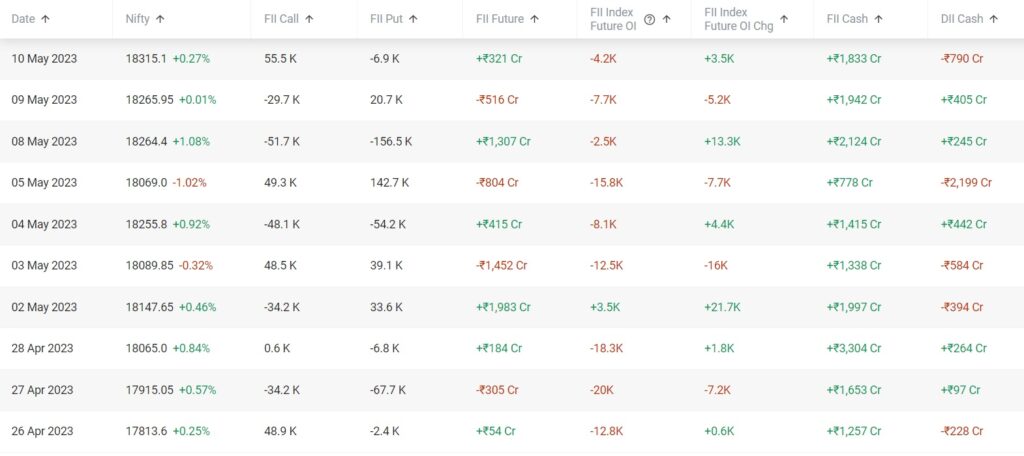
FII/DII Data
FII continues their spree both in cash and futures, indicating a bullish stance of big institutions.
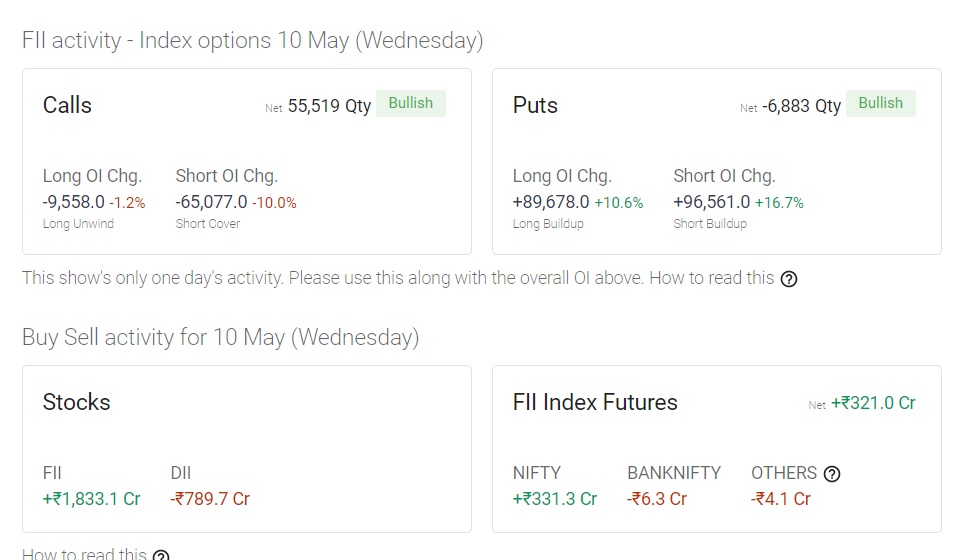
FII Buying spree
EFFECTS OF EVENT AND MARKET around the world
US CPI Data declared today at 6:00pm IST
Key Highlights-
- CPI YOY is 4.9% against expected 5%
- In April inflation growth is 0.4% against March 0.1%
World Market
Key Highlights-
- SGX NIFTY is selling from top
- European markets selling under pressure at this time.
- US markets directionless but mostly negative after an initial rise.
- Dollar is cooling off.
- Crude oil prices is shrinking