Can we breach 20,000?
#safebull , Analysis , Educational , Learning
Previous week closed on a very bullish note, with 3 back-to-back positive close. A very volatile week with positive closing and tested 19800 – 19850 levels…[ Read More ]…
Last Expiry – How the market traded.
NIFTY 50
Previous week closed on a very bullish note, with 3 back-to-back positive close. A very volatile week with positive closing and tested 19800 – 19850 levels.
BANK NIFTY
After 2 back-to-back gap-ups, it was unable to sustain at the high and last session closed very negatively.
RISK DISCLOSURE!!!
- 9 out of 10 individual traders in equity Futures and Options Segment, incurred net losses.
- On an average, loss makers registered net trading loss close to ₹ 50,000.
- Over and above the net trading losses incurred, loss makers expended an additional 28% of net trading losses as transaction costs.
- Those making net trading profits, incurred between 15% to 50% of such profits as transaction cost.
……
Technically, can we breach 20,000?
NIFTY 50
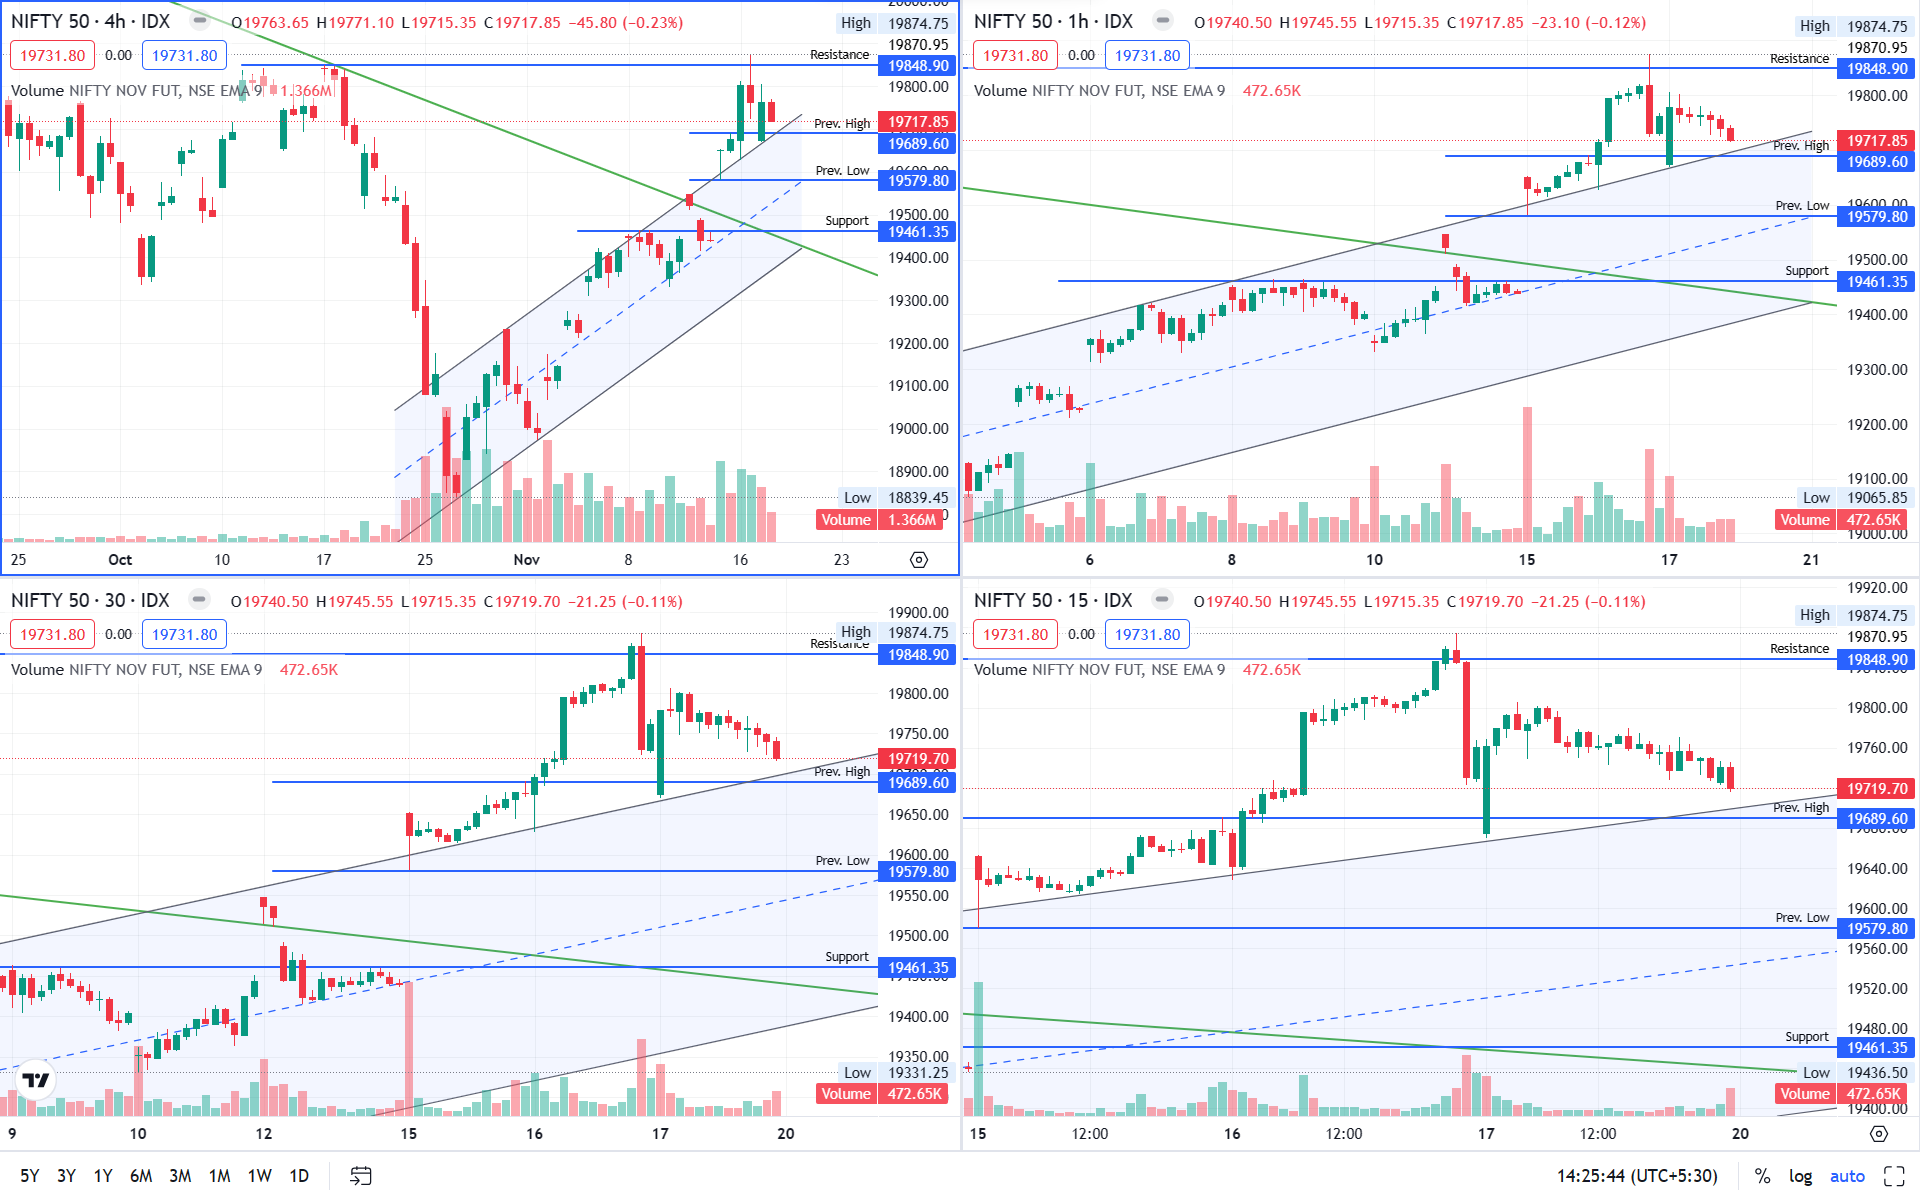
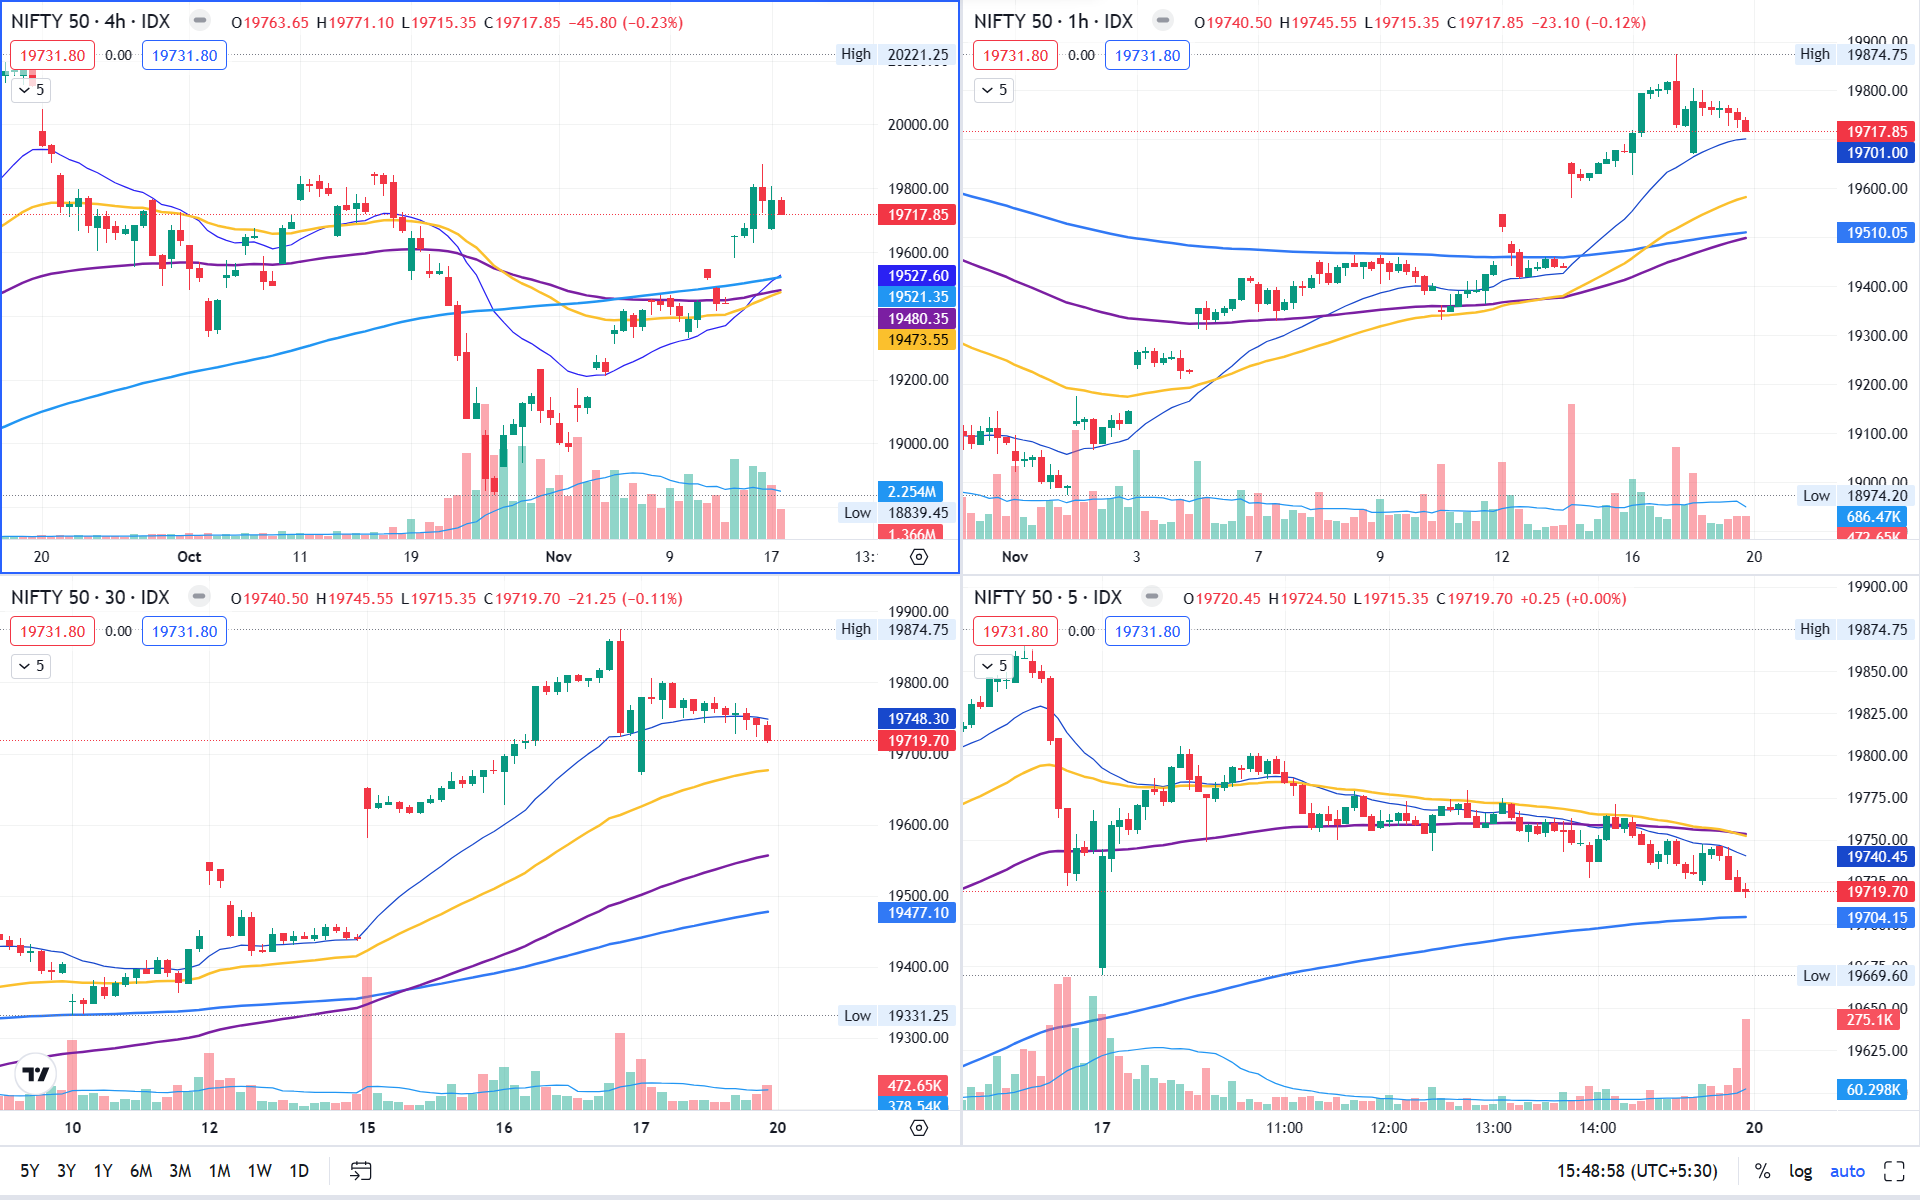
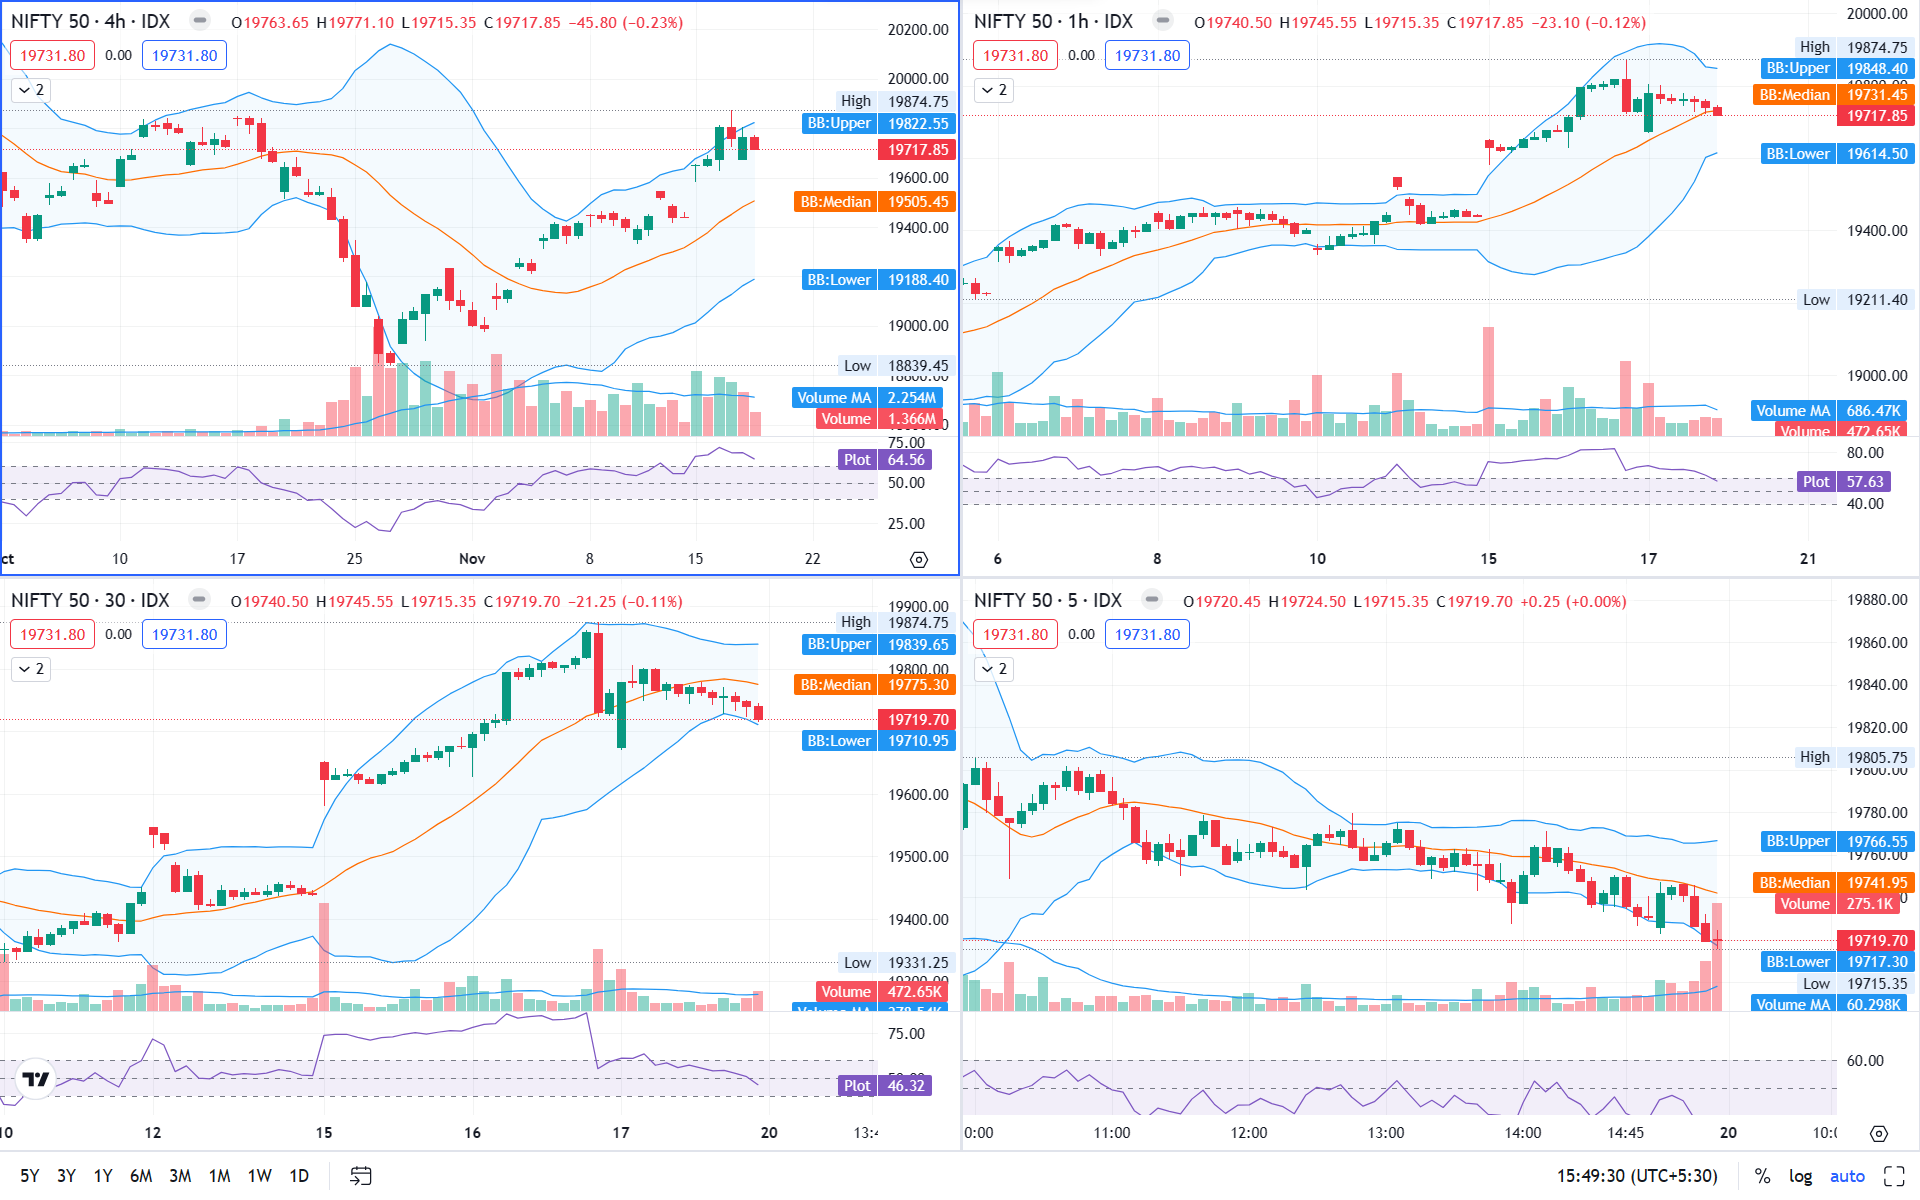
Weekly chart of NIFTY is very bullish, after a recent bottom, it had gained 857 Pts with 3 consecutive positive weeks.
Price action on daily time frame looks positive but it is testing 19800 levels.
On shorter time frame, there is some rejection from top but as long as 19450 -19500 level holds it is a buy on dip.
Important Levels
- Resistance – 19800 – 19900
- Support – 19400 – 19500
- No trading Zone – 19500 – 19600
……
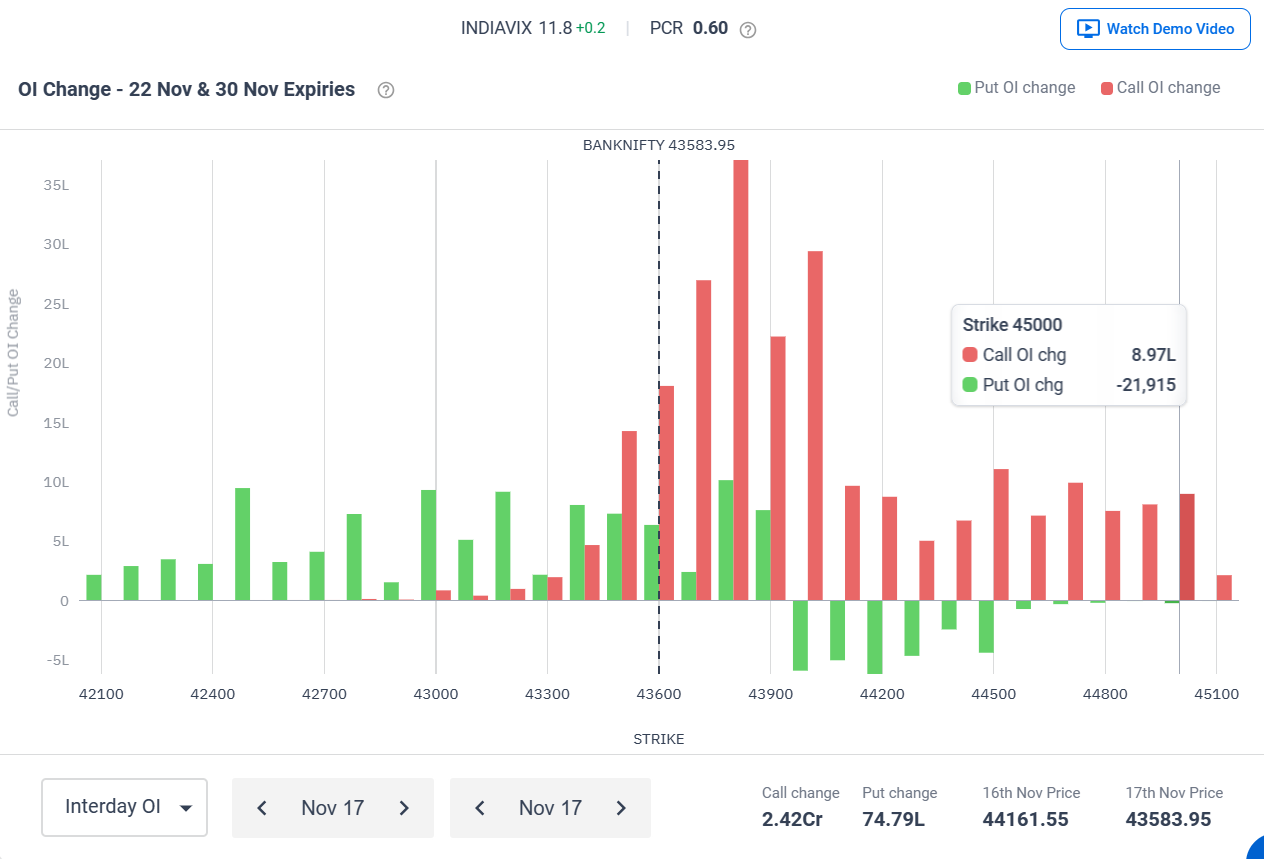
BANKNIFTY
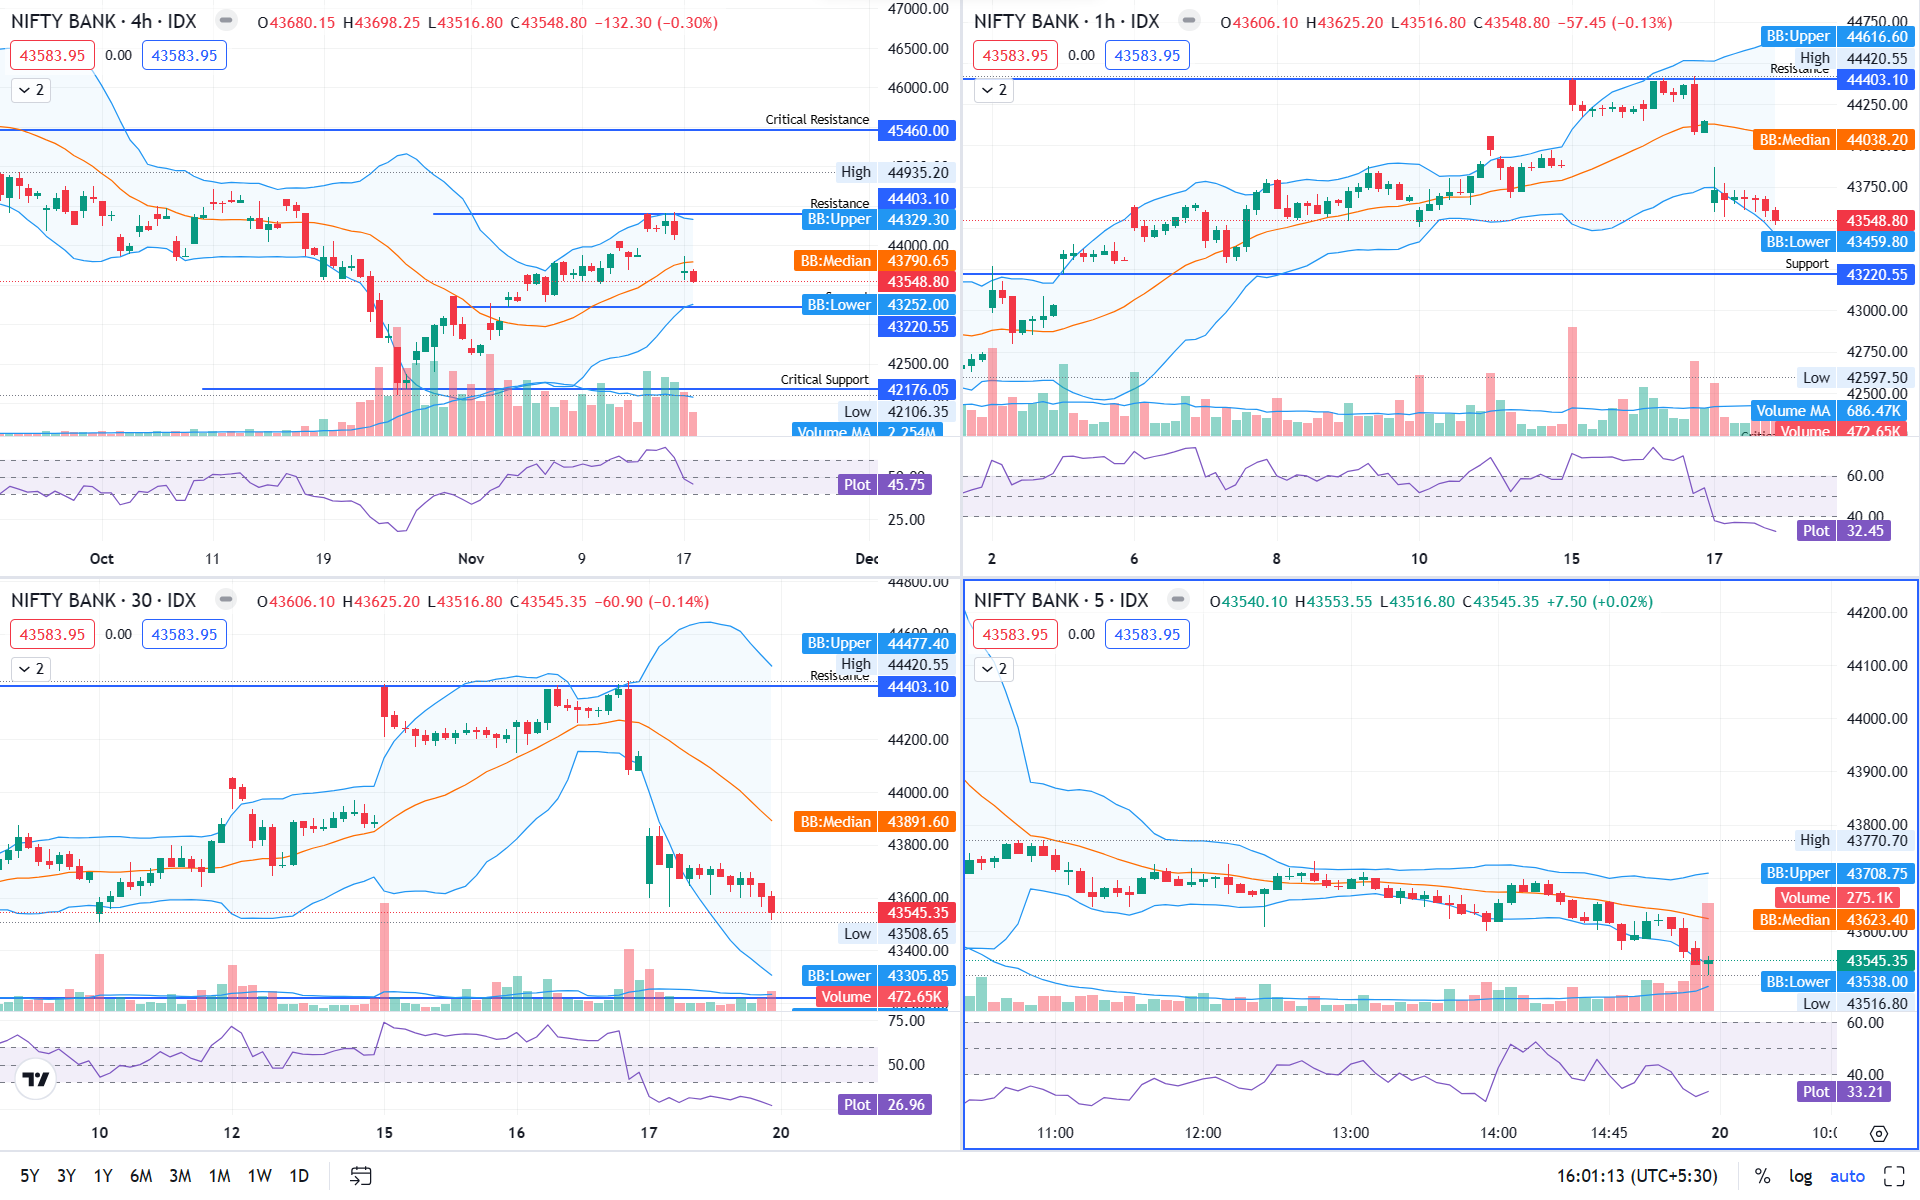
Weekly price action is very bullish with some healthy correction.
On Daily time frame, with 2 sessions opening gap-ups it is unable to sustain at high and fall 1.13% on last Friday. Looks Bearish.
On shorter time BANKNIFTY is trading near a critical support level, 43200, it will be interesting to see whether it holds.
……
What does Data say, can we breach 20,000?
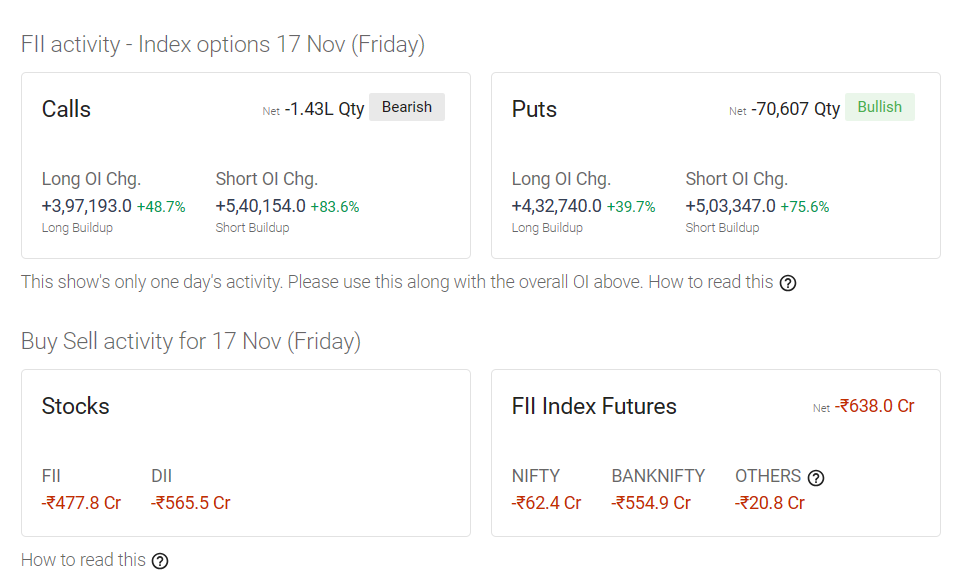
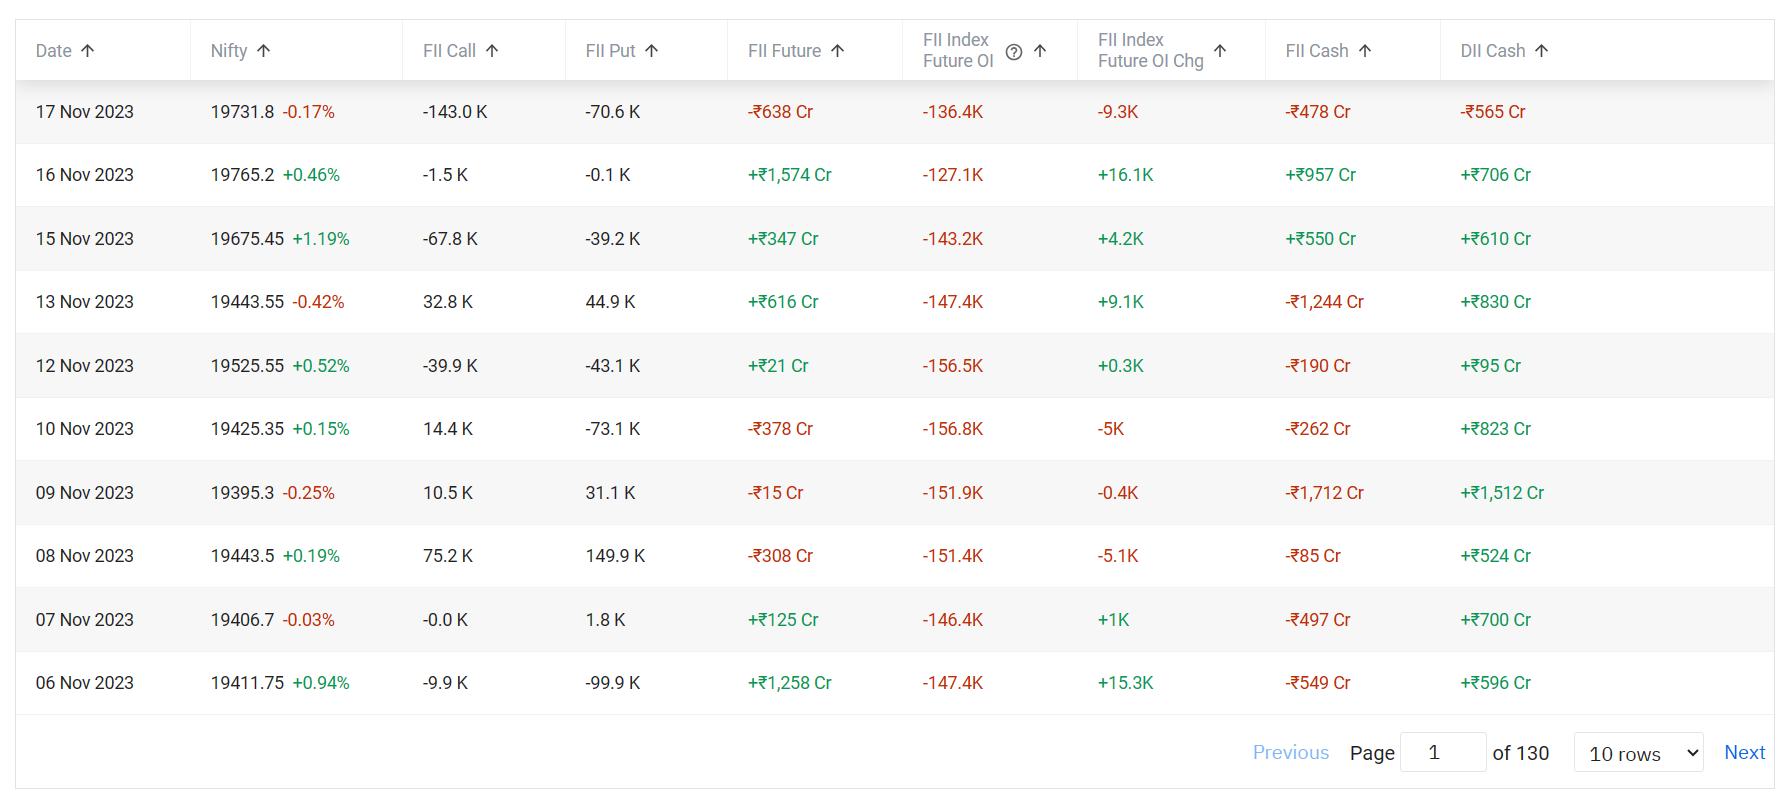
FII & DII Activity
- FII Cash :: -₹477.8 Cr
- FII Futures :: -₹638.0 Cr
- DII Cash :: -₹565.5 Cr
……
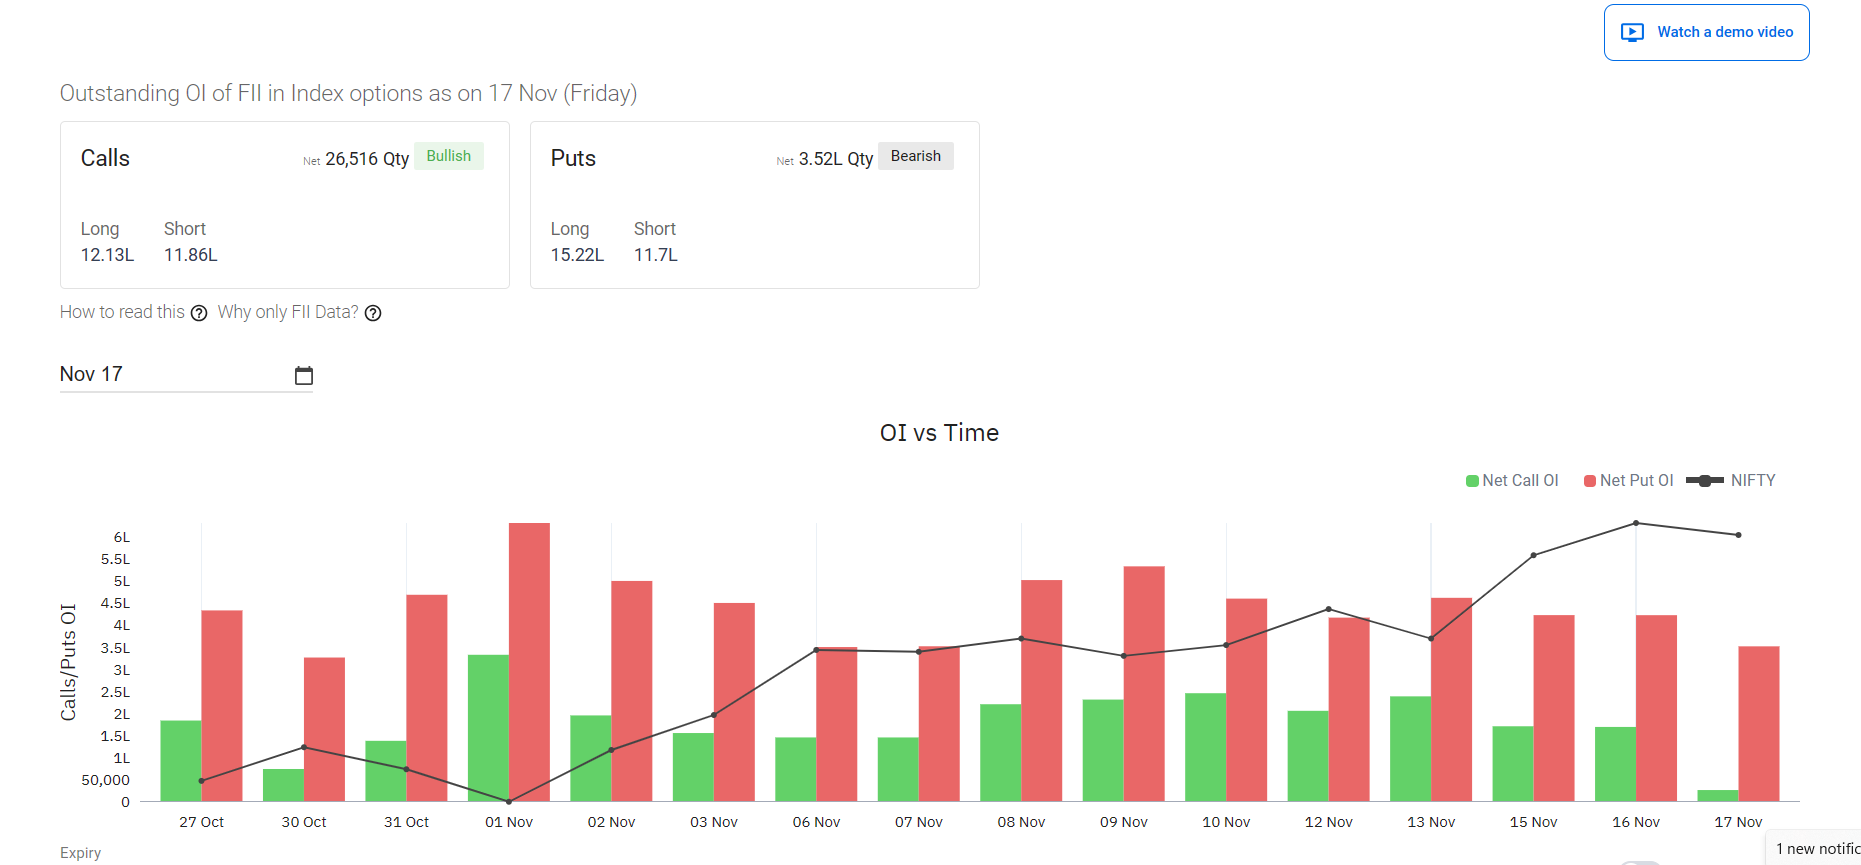
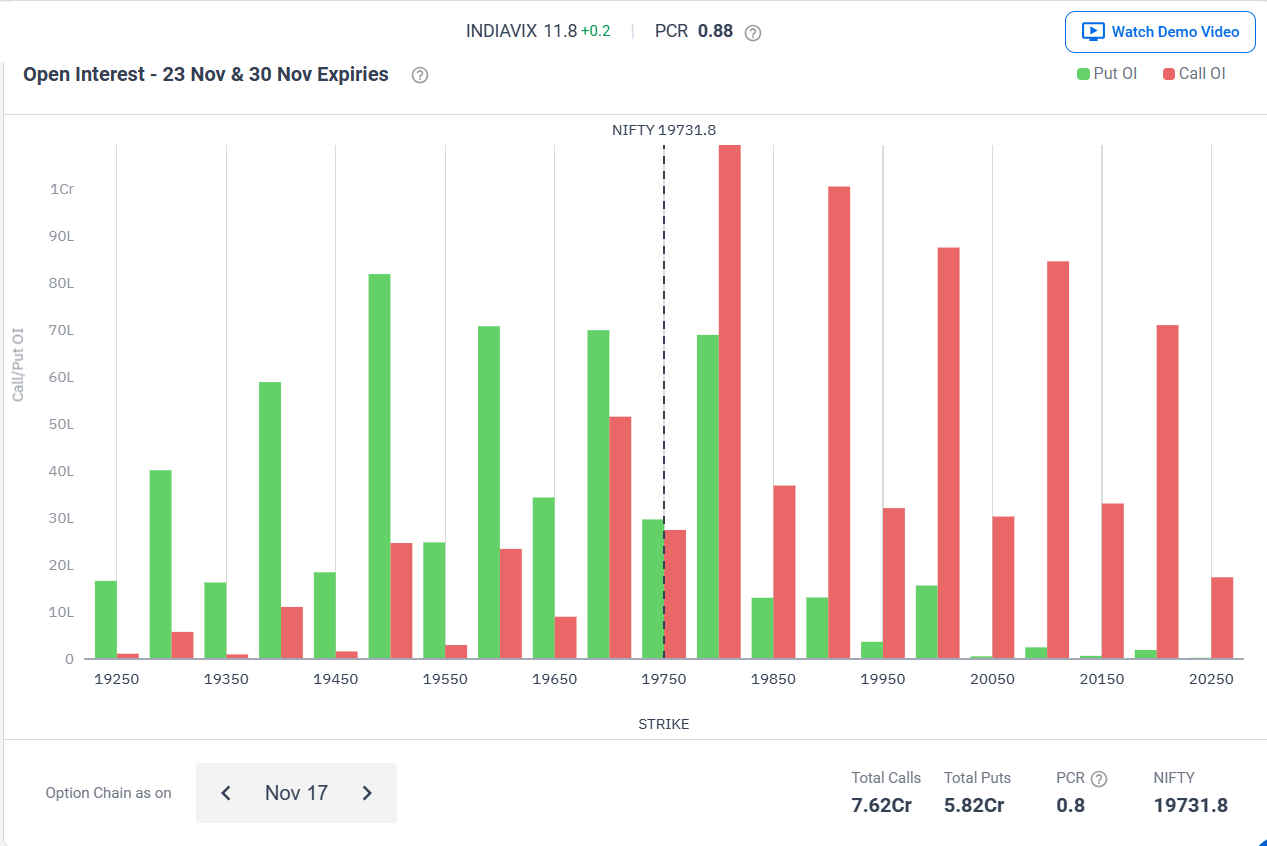
Open Interest (OI)-
Max OI Calls:: 19800 , 1.09 Cr
Max OI Puts:: 19500 , 0.81 Cr
Note:: OI suggests nominal Support at 19500, and but key Resistance at 19800 and above.
** Datas are only for NIFTY 50
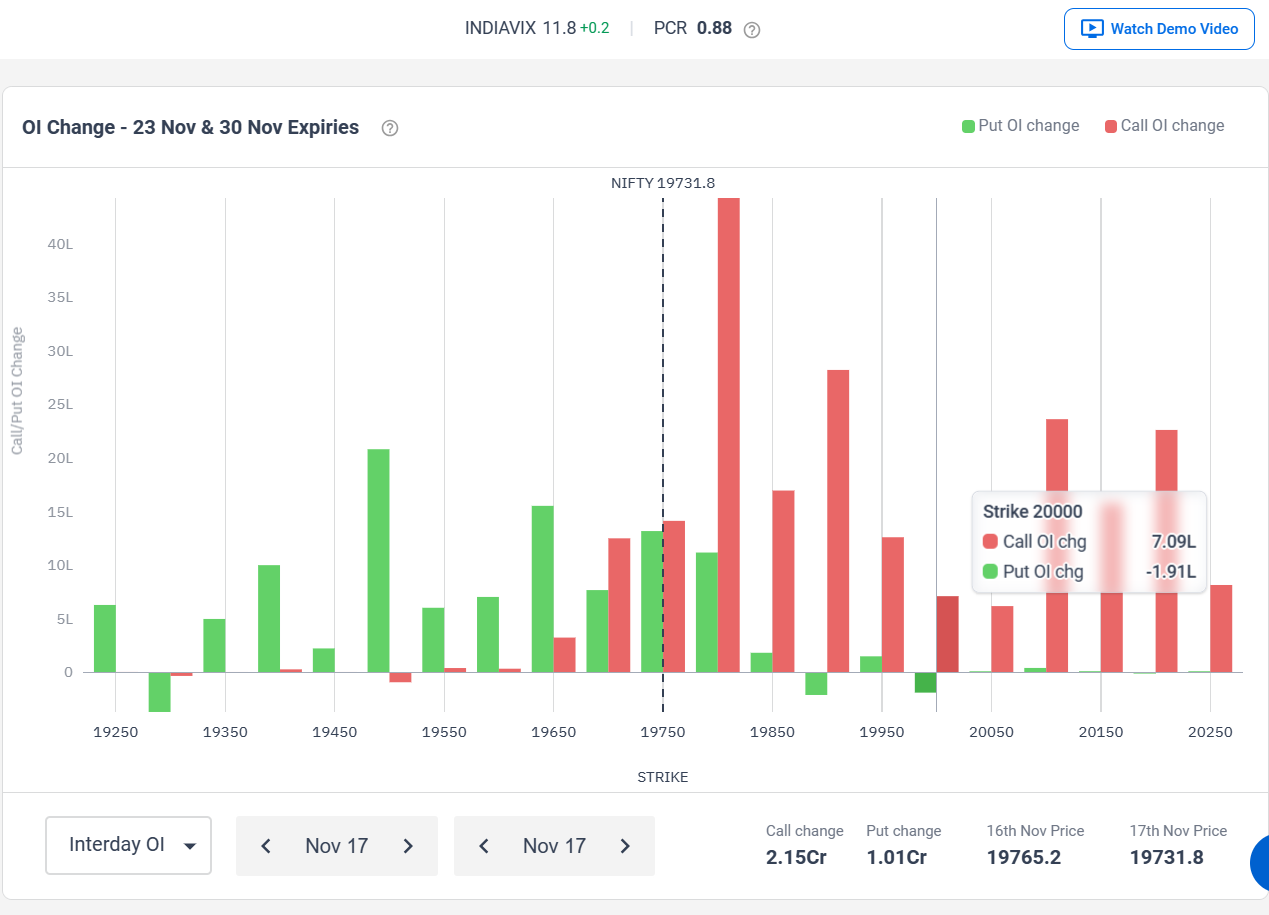
PCR – 0.8 (-) Flat to Bullish

……
Market Sentiments
World Markets – World market traded and closed POSITIVELY.
GIFT NIFTY FUTURES – Closed around 19802.0 at 01:15am 18-11-2023.
Events Upcoming
- 10 Nov Fri 05:30 PM Industrial Production YoY SEP India 7%
- 13 Nov Mon 05:30 PM Inflation Rate YoY OCT India 4.80%
- 14 Nov Tue 12:00 AM Market Holiday – Diwali India
- 14 Nov Tue 12:00 PM WPI Inflation YoY OCT India -0.20%
- 14 Nov Tue 07:00 PM Inflation Rate YoY OCT USA 3.30%
- 15 Nov Wed 07:30 AM Industrial Production YoY OCT China 4.40%
- 15 Nov Wed 07:00 PM Retail Sales YoY OCT USA 2.50%
- 16 Nov Thu 07:45 PM Industrial Production YoY OCT USA -0.70%
- 23 Nov Thu 12:30 AM FOMC Minutes USA
- 27 Nov Mon 08:30 PM New Home Sales OCT USA 0.759M
- 27 Nov Mon 12:00 AM Market Holiday – Gurunanak Jayanti India
- 30 Nov Thu 05:30 PM GDP Growth Rate YoY Q3 India 7.80%
……
Researched, Analyzed & Drafted by :- Pixarts.Trade #safebull
CHECK OUT THESE POSTS!!…
- “Trailing Stop Loss, a way forward”
 Initial trade in FINNIFTY stop loss got triggered then re-entered again, with defined risk, and trailed the trade to avoid getting loss and to close the day in green.
 - “Some move today in Indian Indices”
 “Could not capitalize much as system trailing stop loss got triggered, next time better to trail manually- a valuable lesson learned.”
 - ” All about today, the trades, and the win”
 Market opened flat as expected, and rallied some more points, allowing an exit for the put short due to short covering. Booked some profit.
 - “Wonderful Day & All well executed Trades”
 SHILLONG :: Following up with the trend since morning, VWAP in 15mins candle have dipped and Cumulative Delta divergence observed after 1st 15-mins candle(green) with negative Delta.
 - “An Intraday Close strangle- carried forward”
 Market opened gap up but within the estimated range, and at around 9:30am when Vix was crushed, trade (Strangle) was exited…[..]
The above analysis is solely the opinion of the author, no way an assured tips/direction to trade, they are solely for educational purposes. Please do not trade with out a proper study and analysis, we will not be responsible for your loss. We are not SEBI registered.
#SafeBull, #pixarts.Trade
Good Analysis. Keep it up.
Thanks Bro