Charts for 28th December, 2023 Expiry
Charts , Data
NIFTY 50
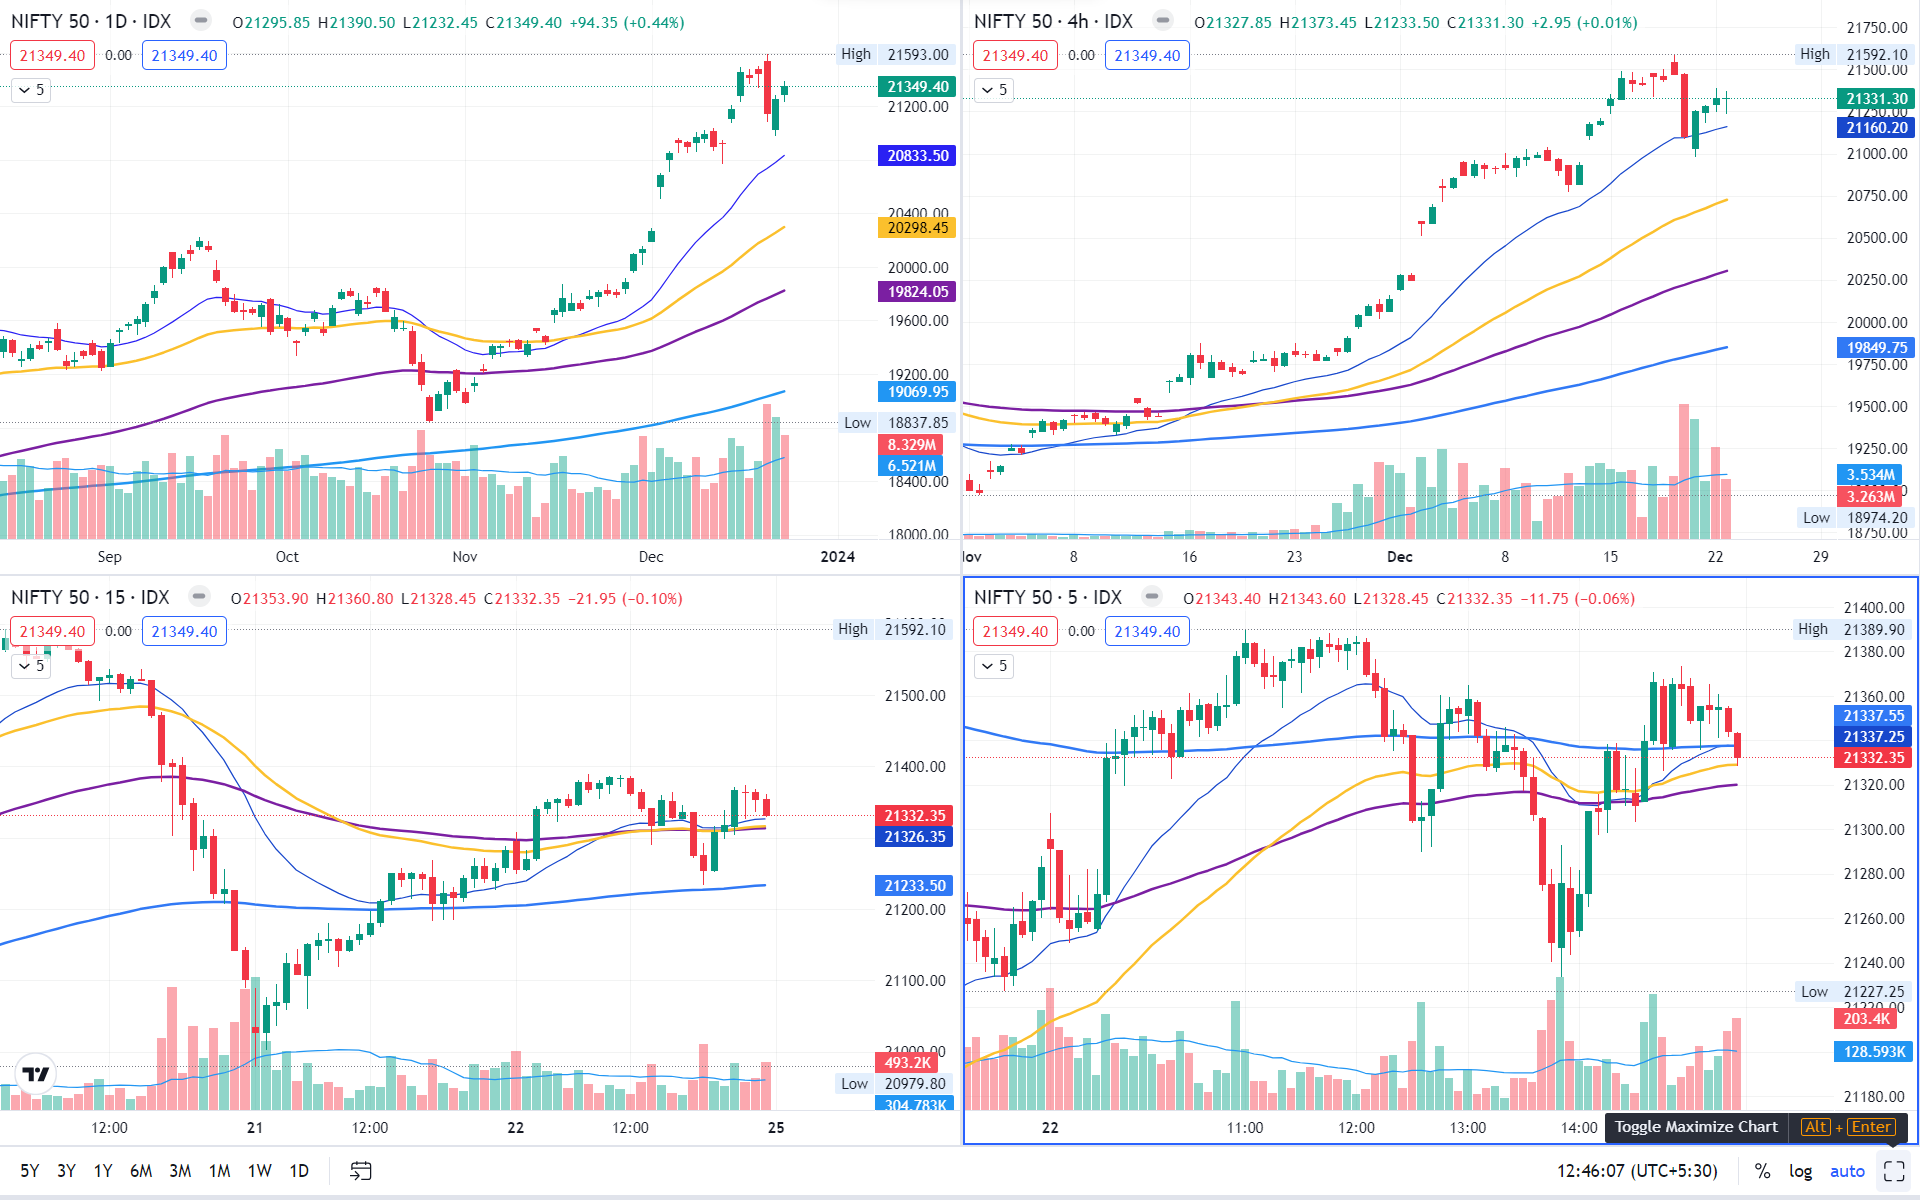
View :
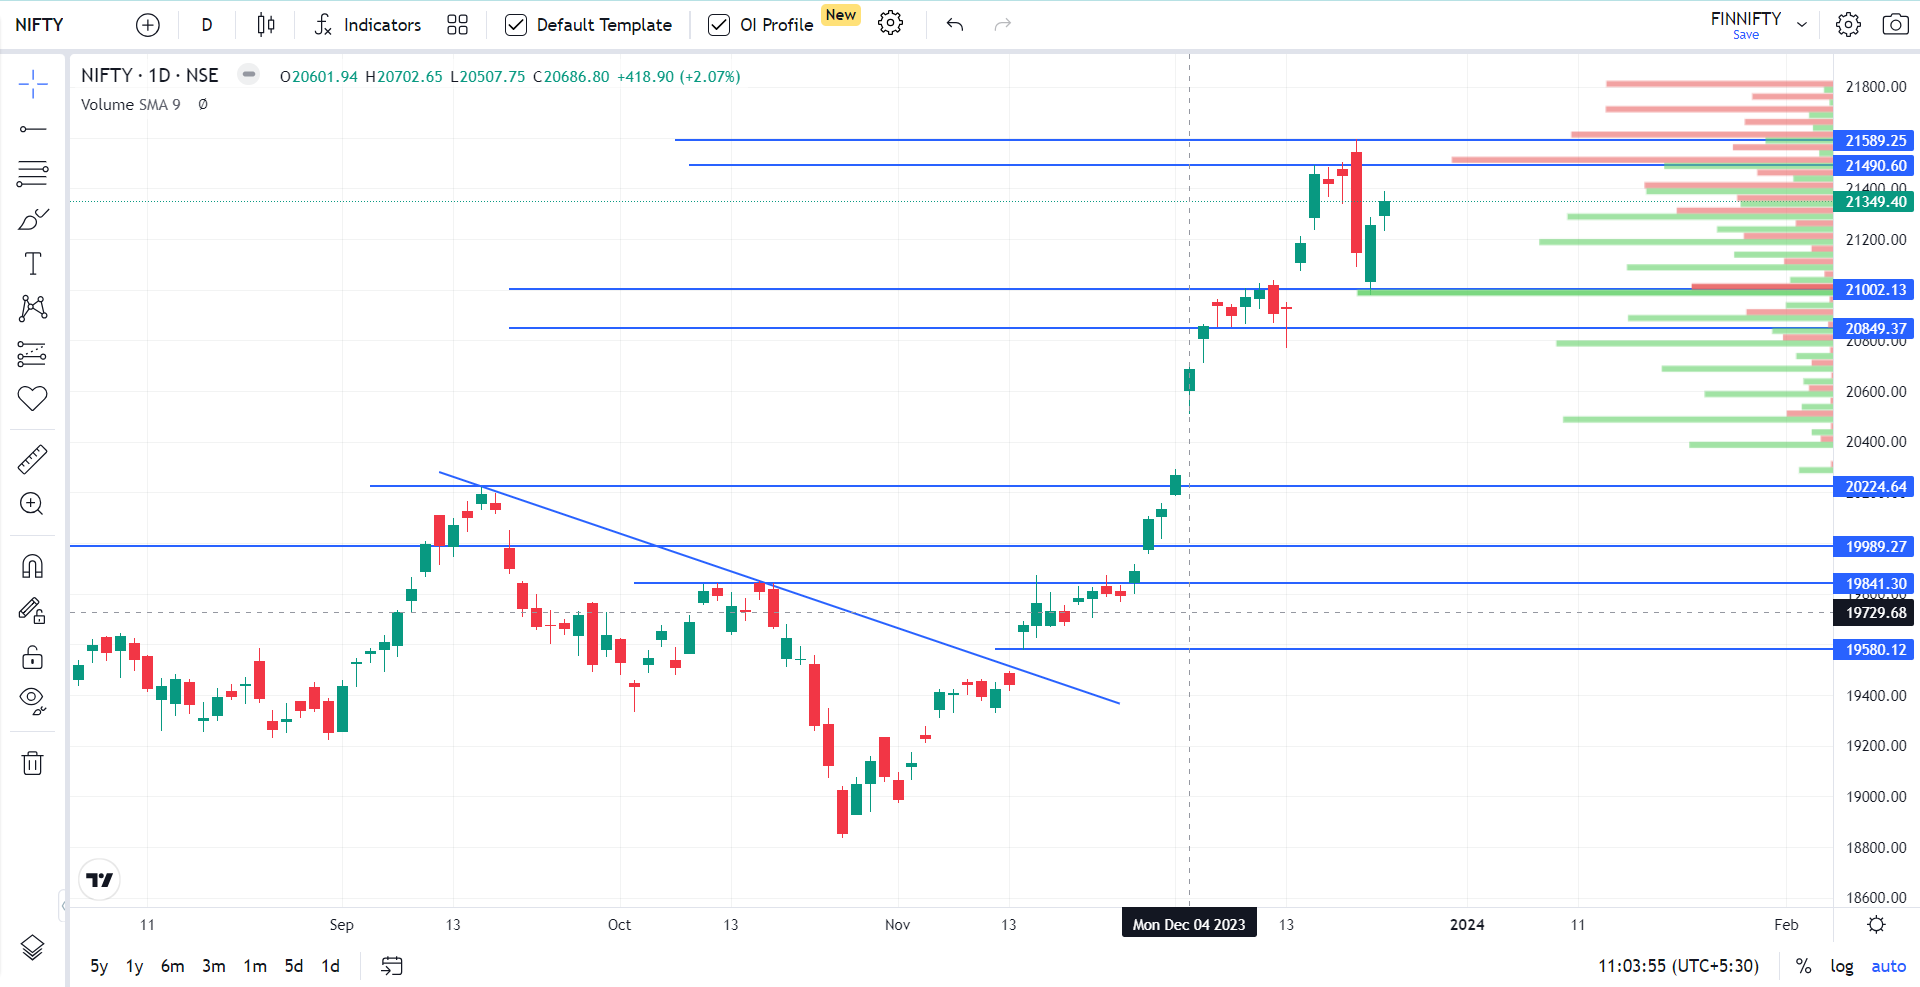
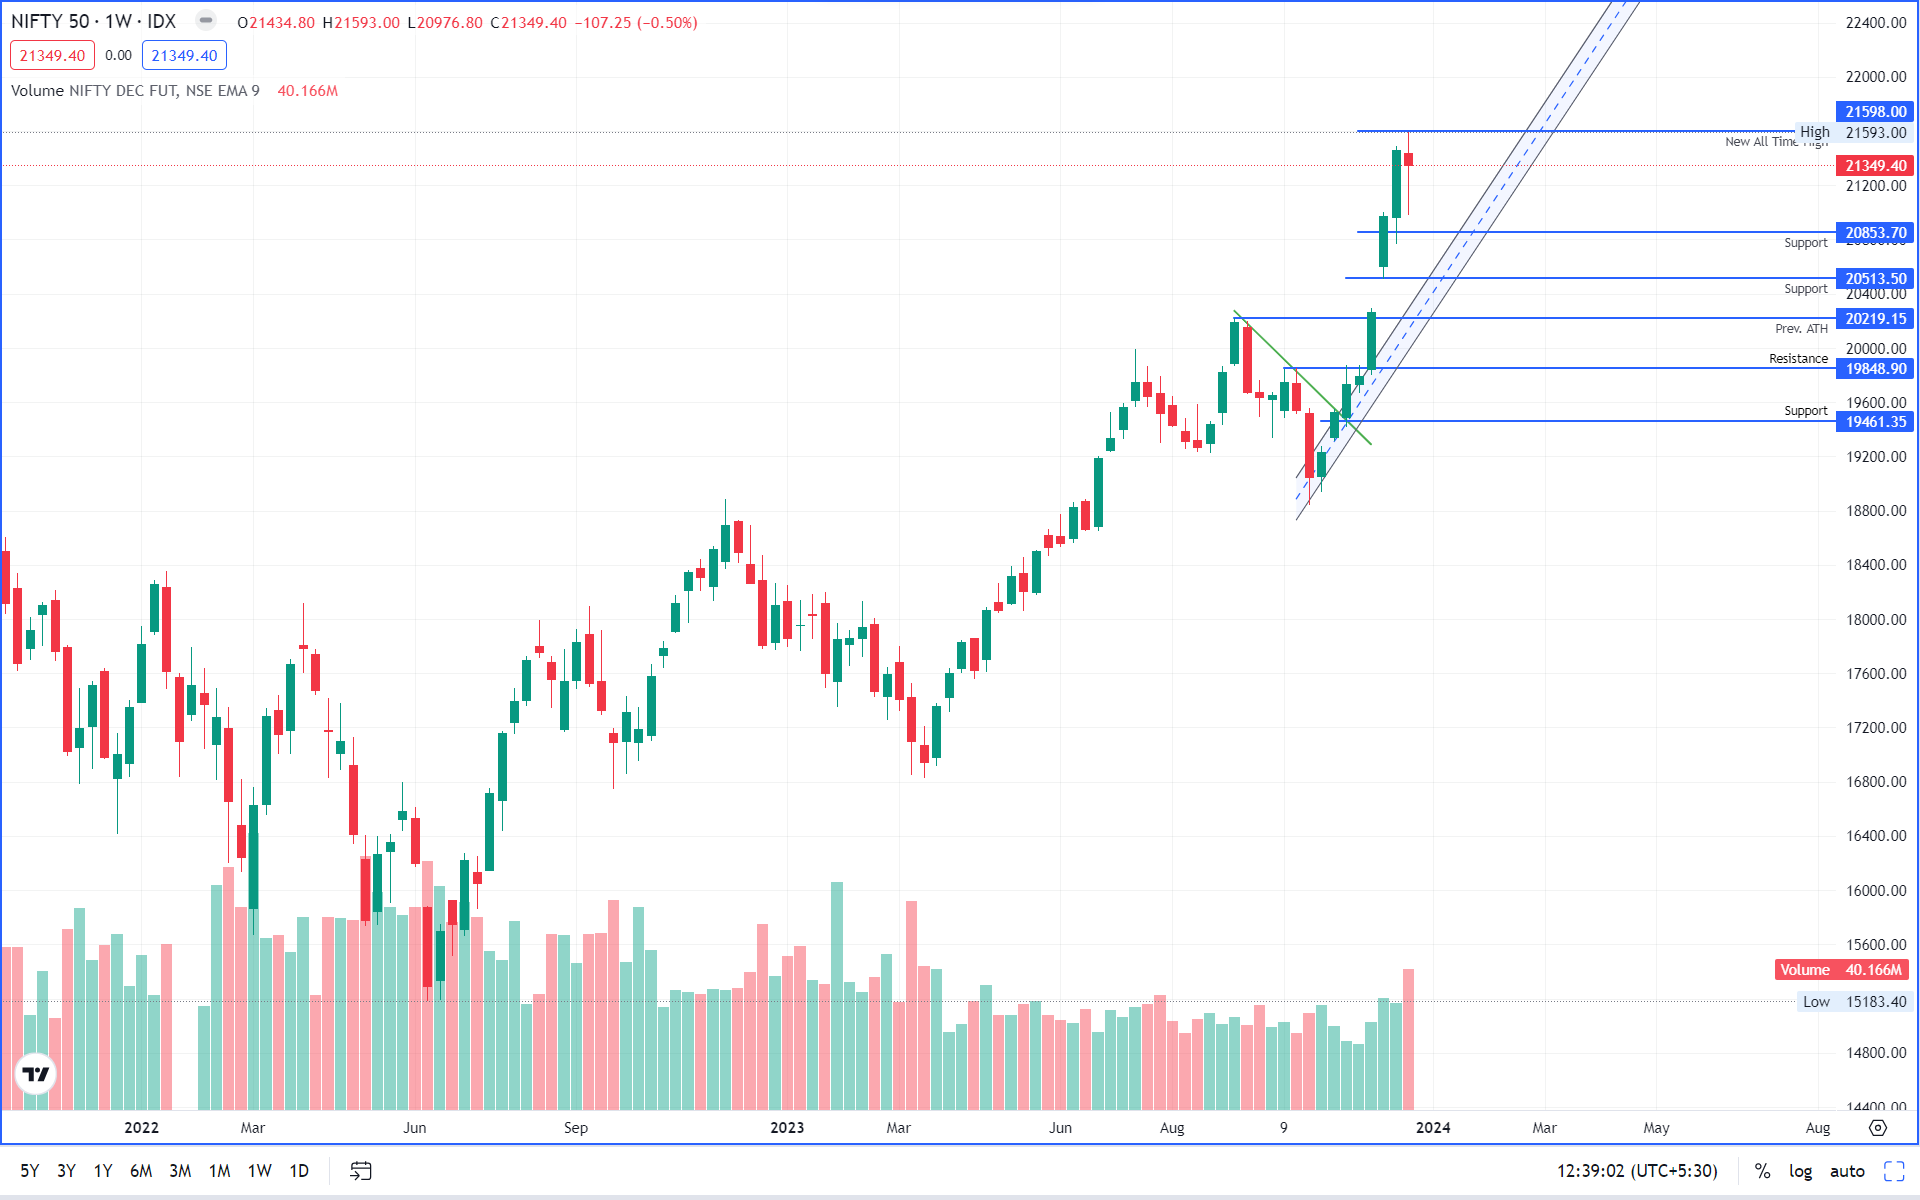
NIFTY is struggling to sustain level above 21500. Profit booking and selling observed at the top levels. Weekly chart is still in bullish zone.
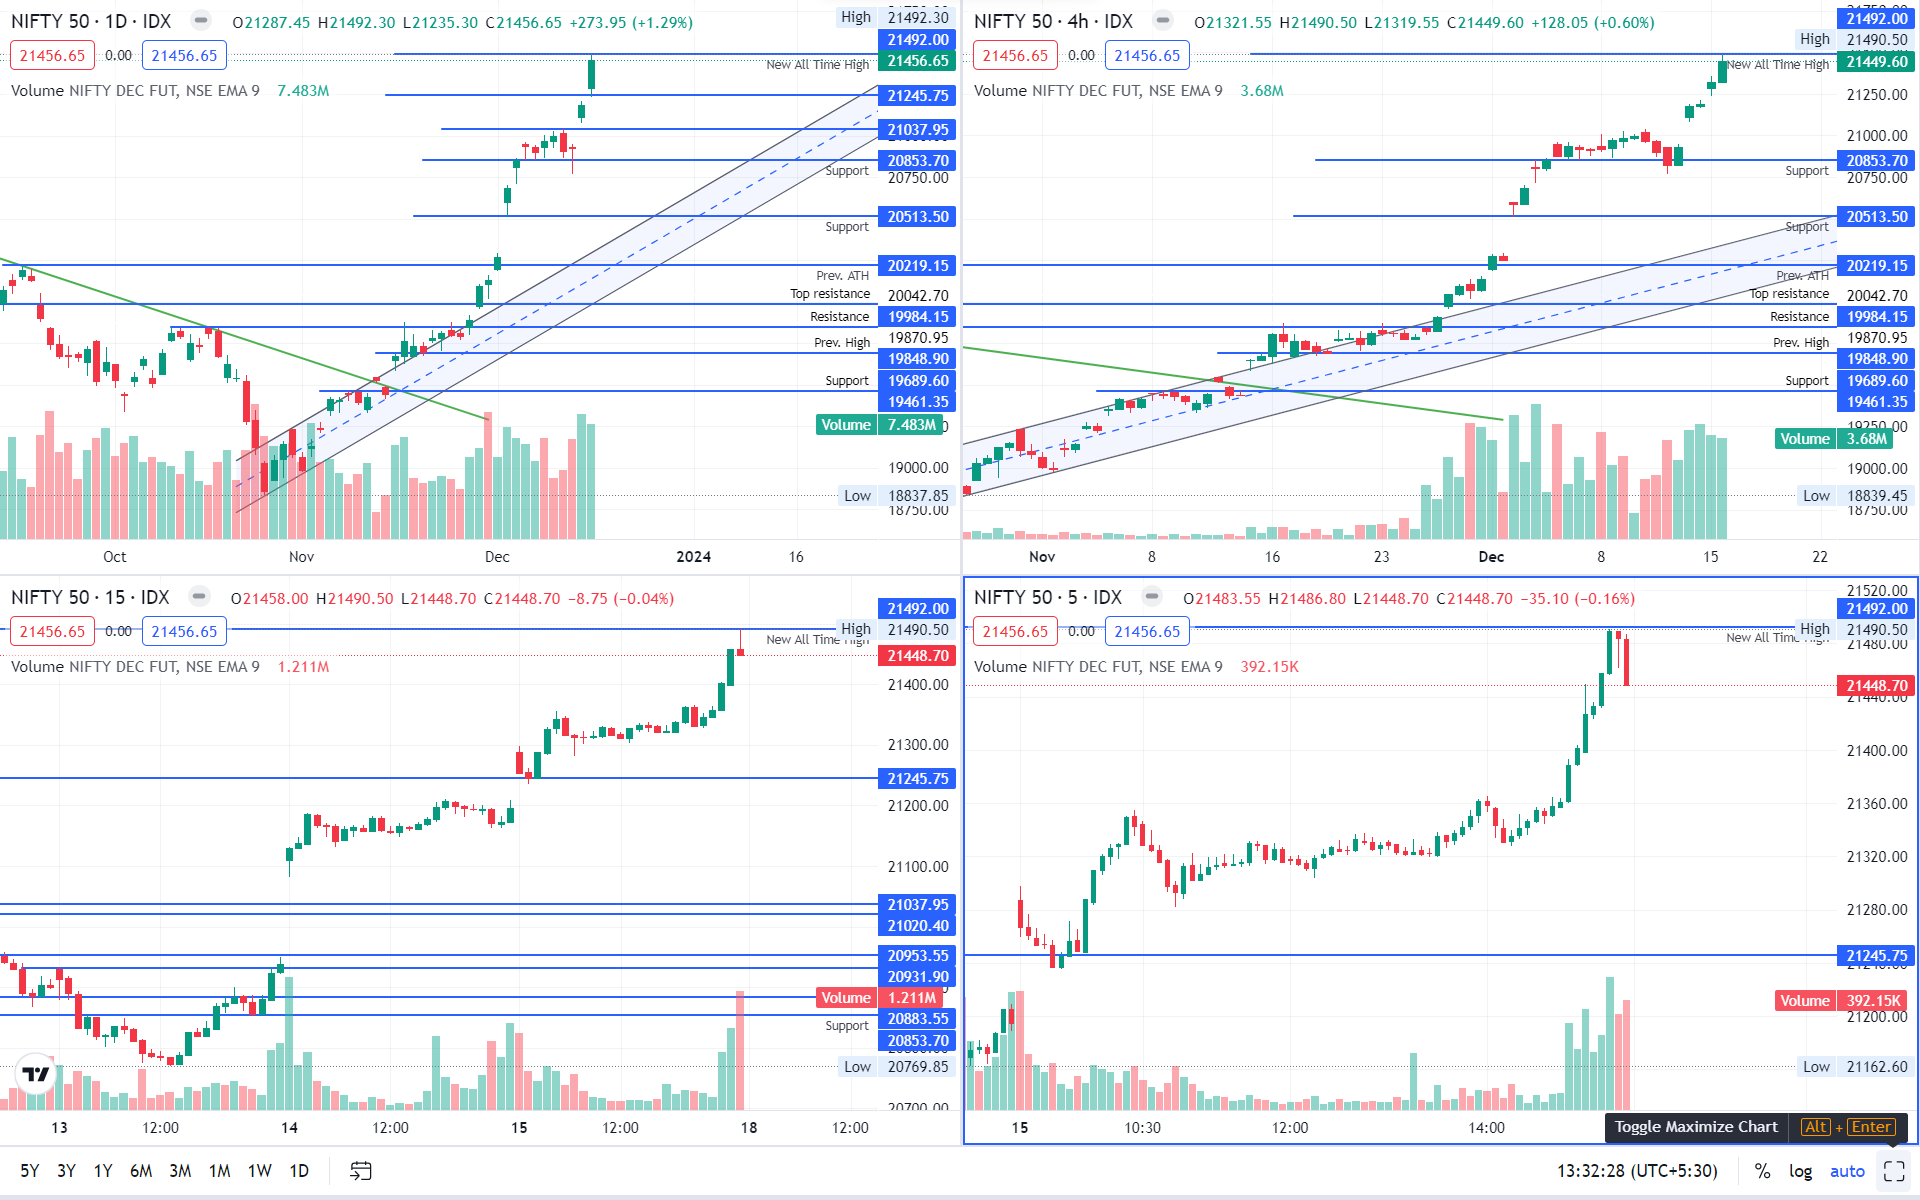
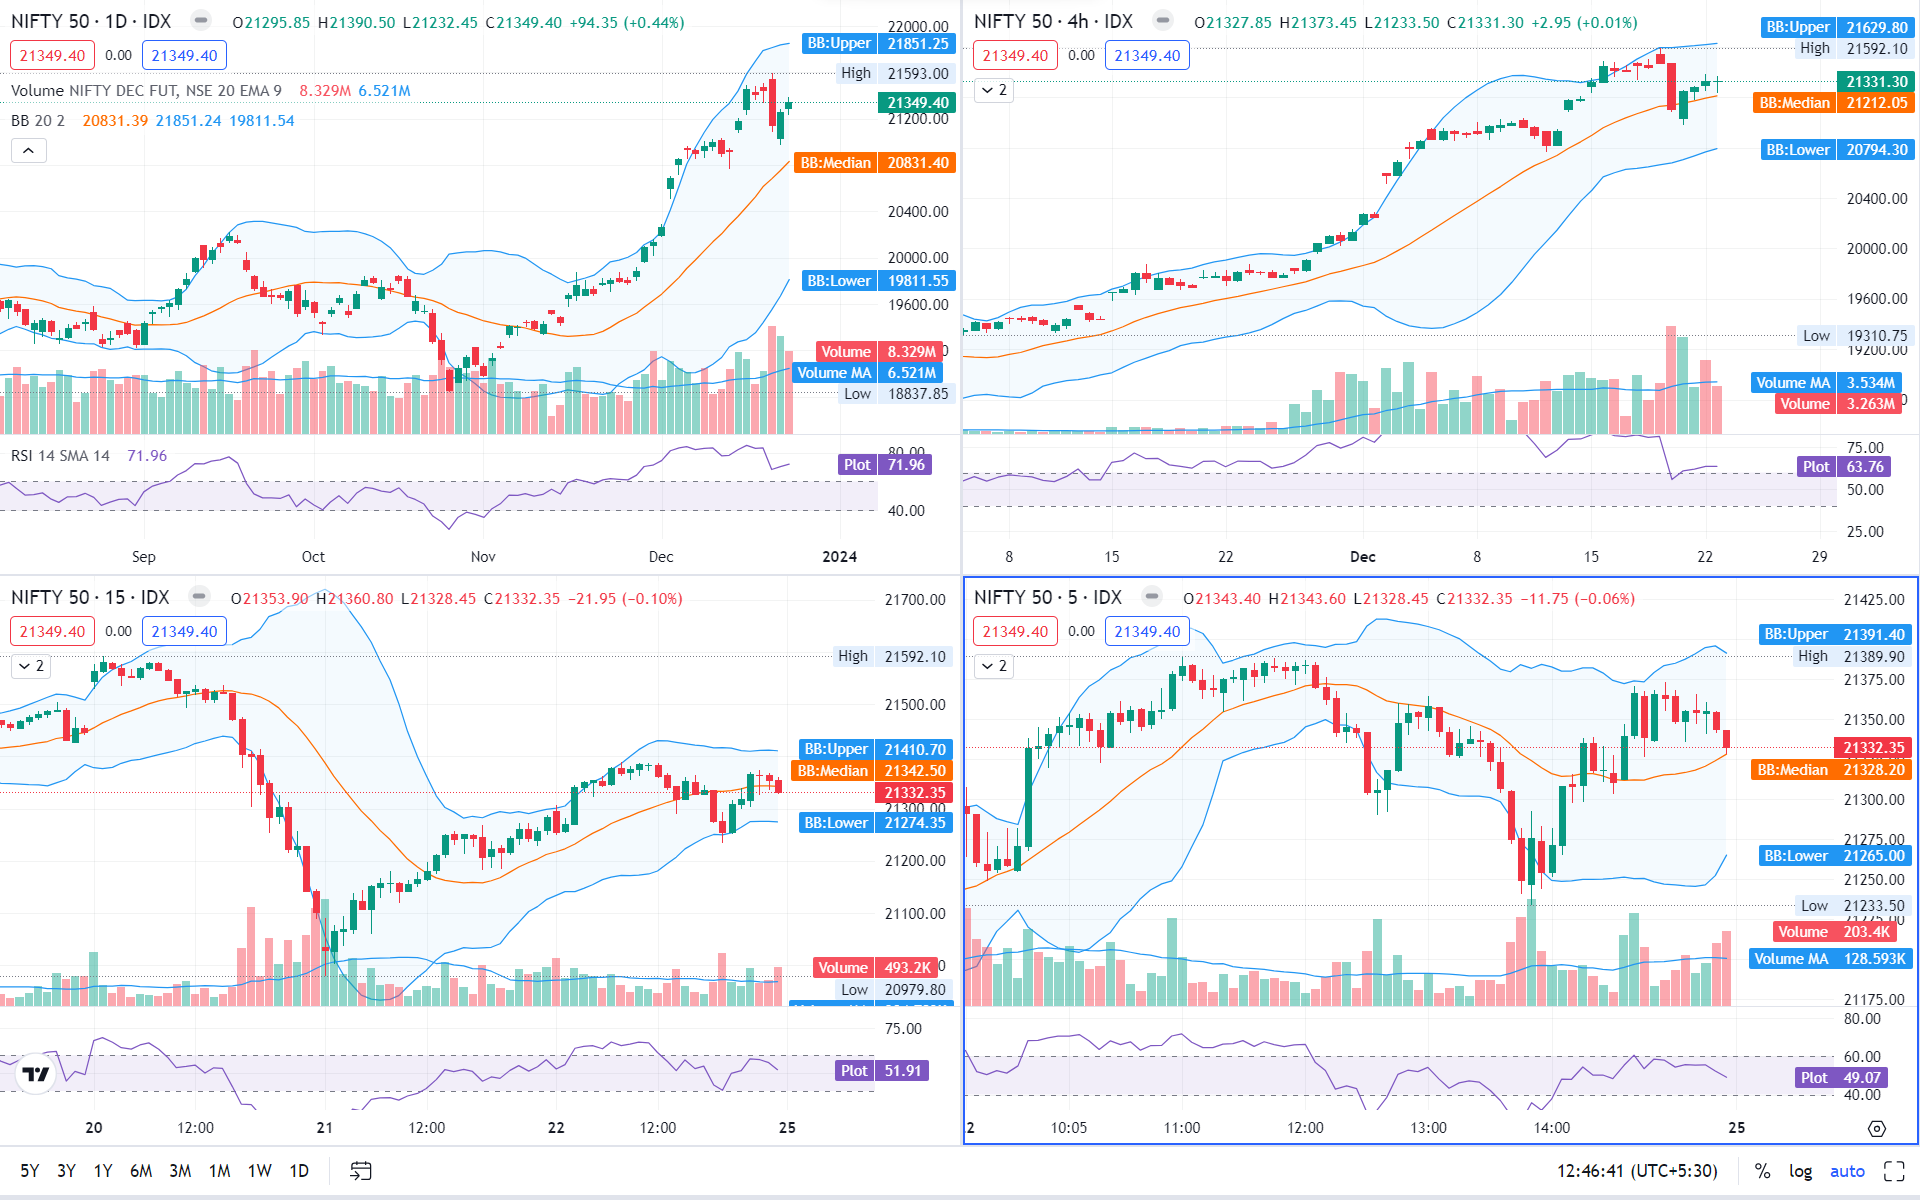
Price action on daily time frame is recovering from last profit booking. Looks positive.
Volatility is expected.
Important Levels
- Resistance – 21,400 -21,500
- Support – 21,000 – 21,100
- No trading Zone – 21,100 -21,500
BANKNIFTY
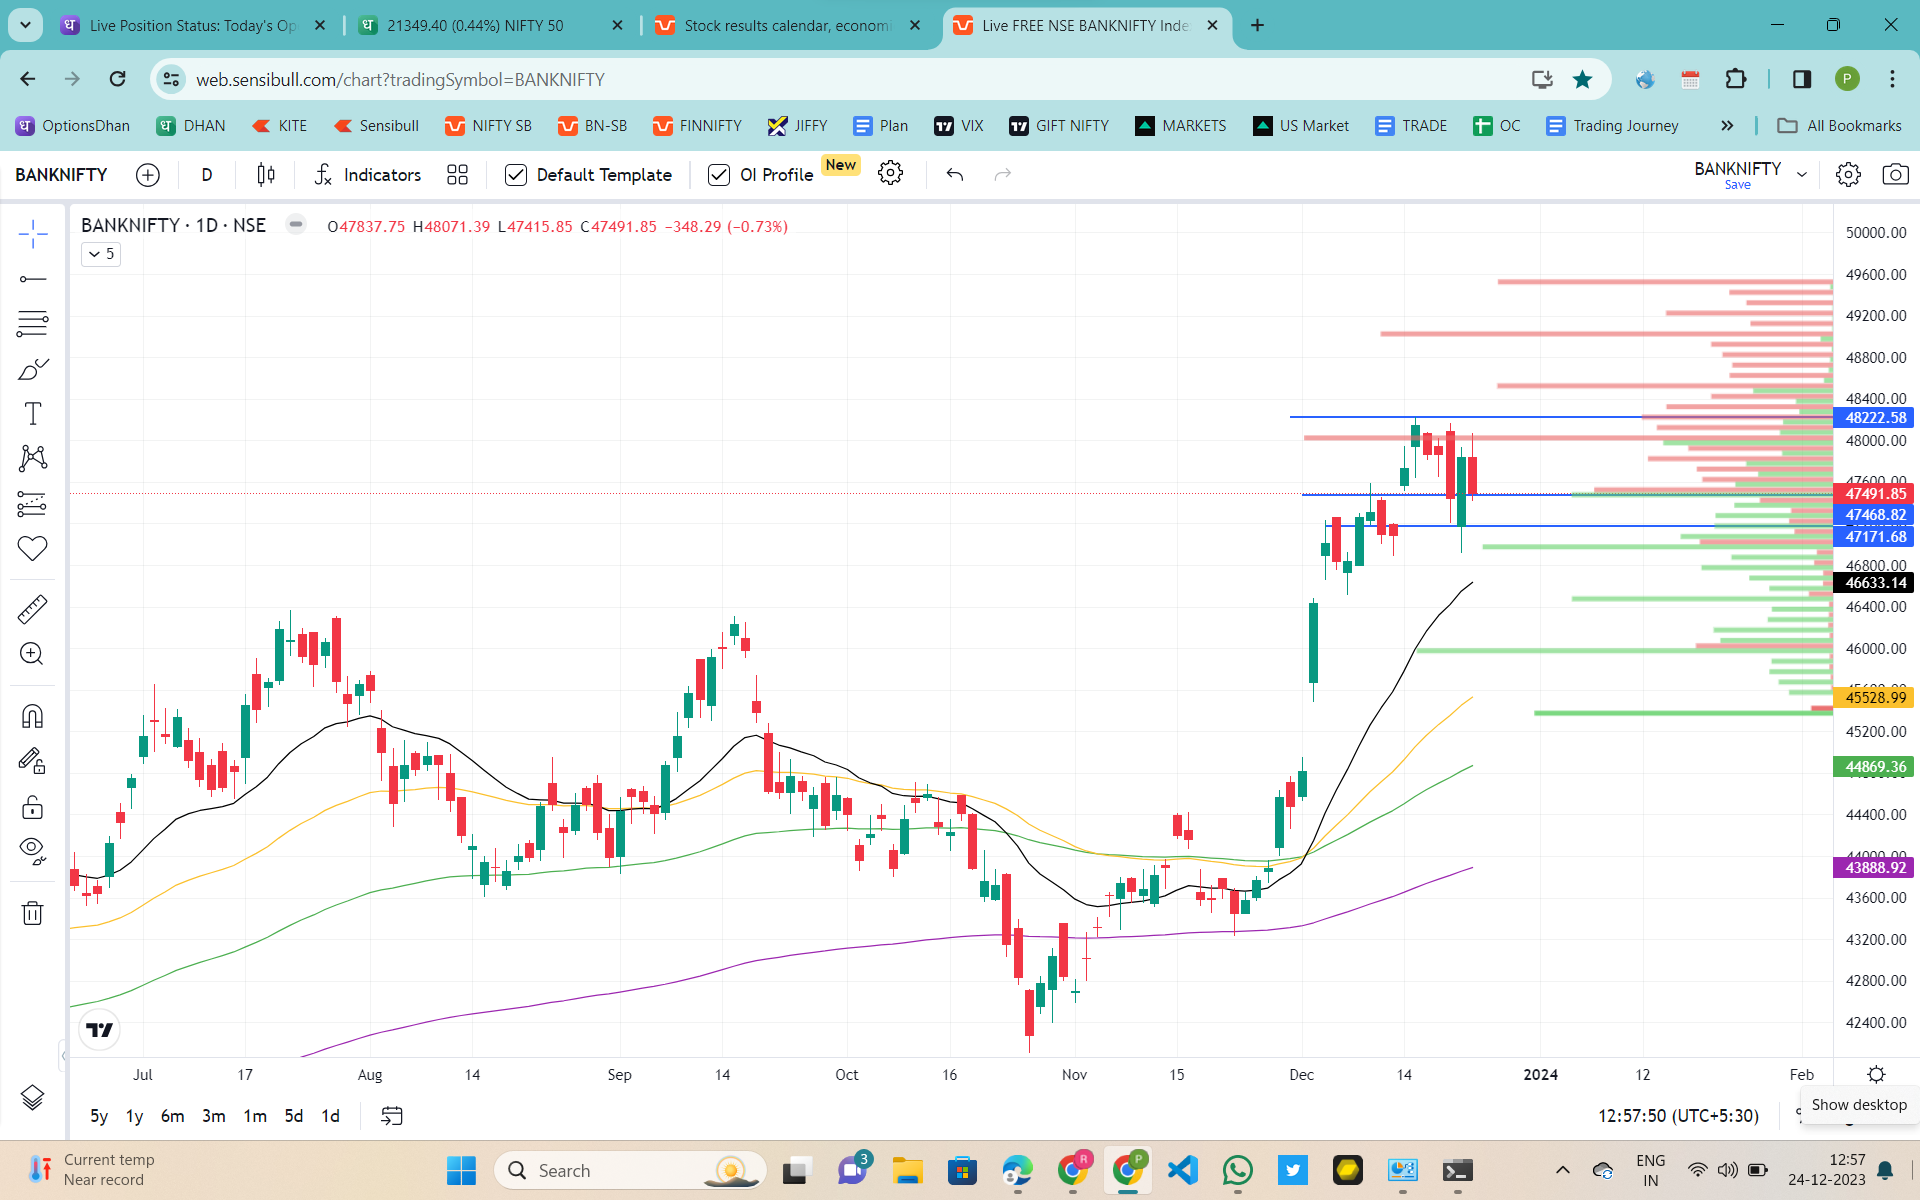
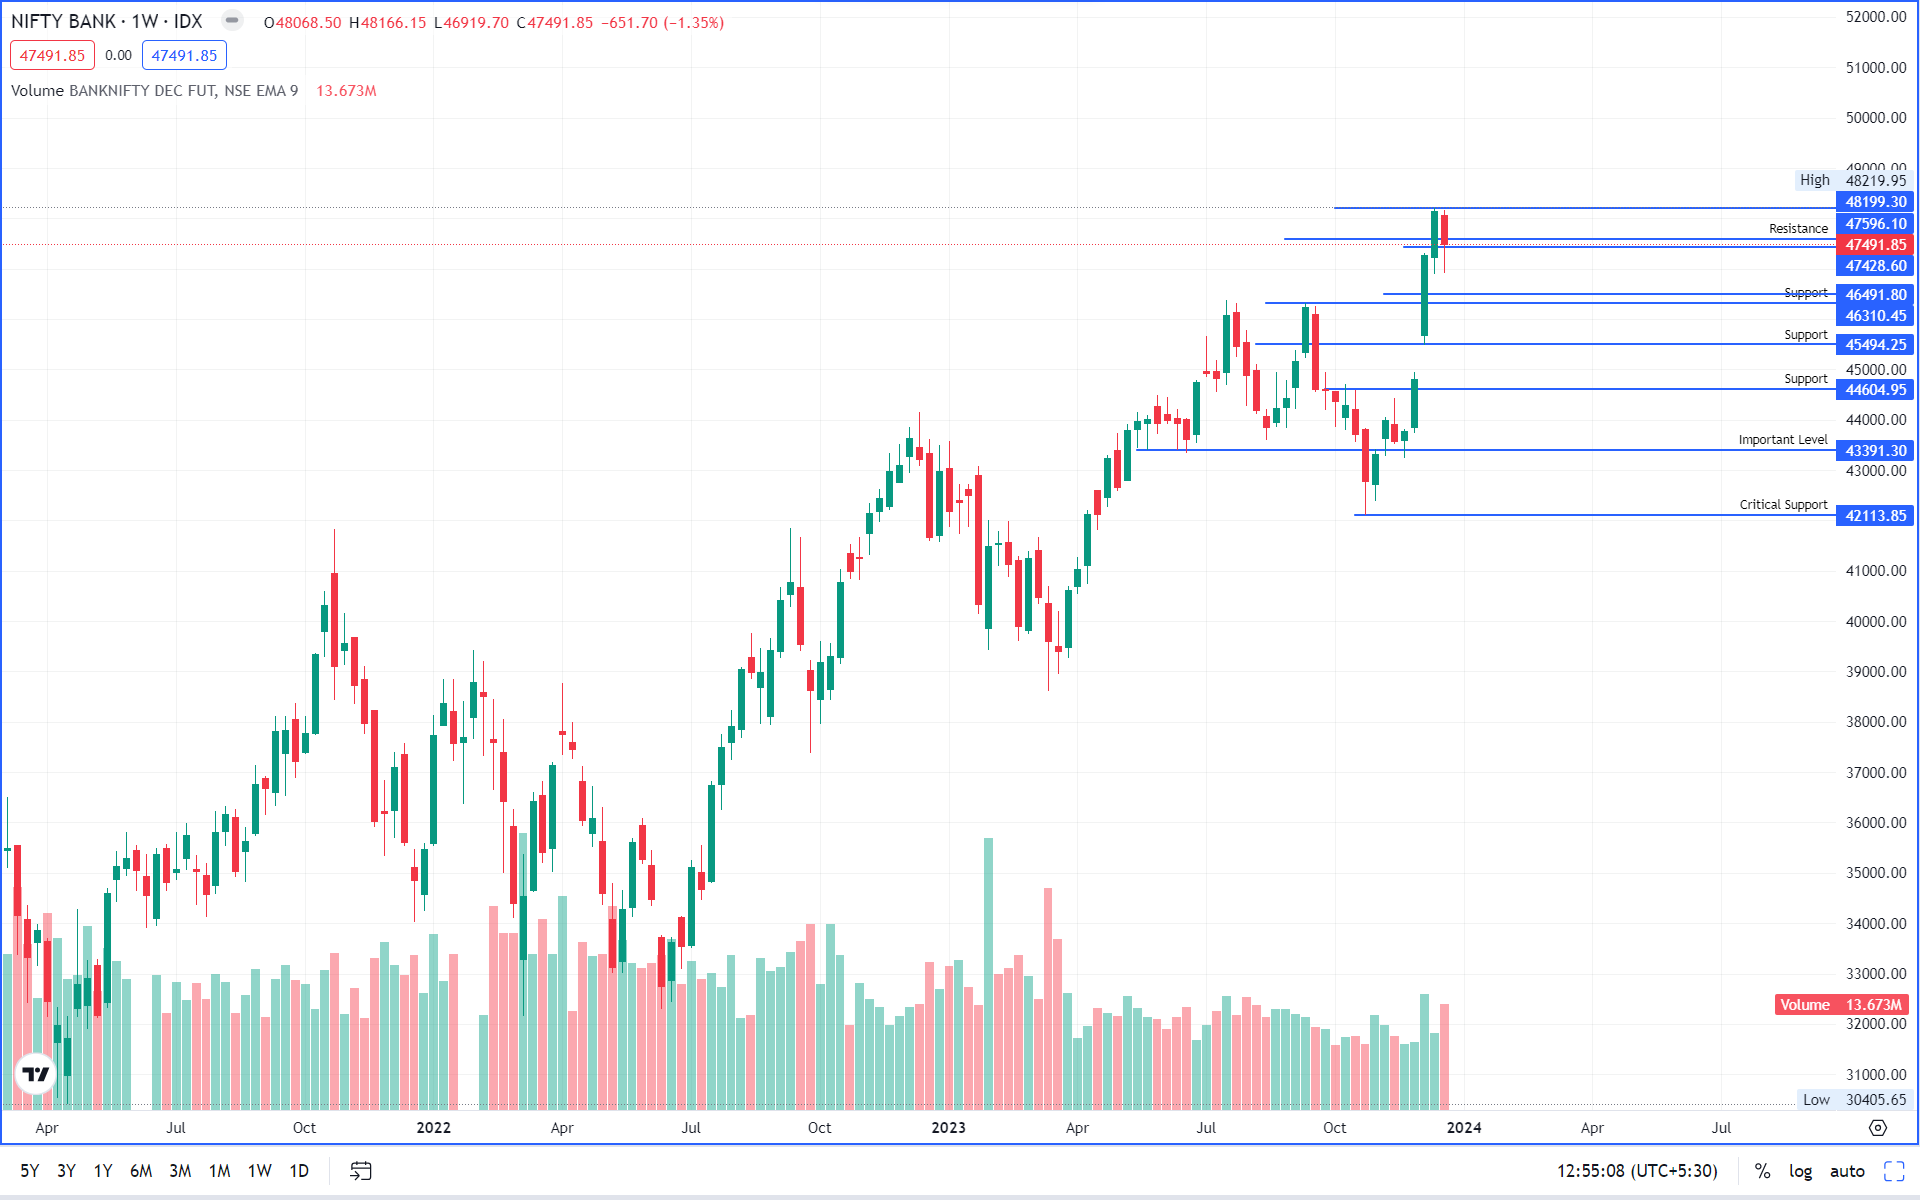
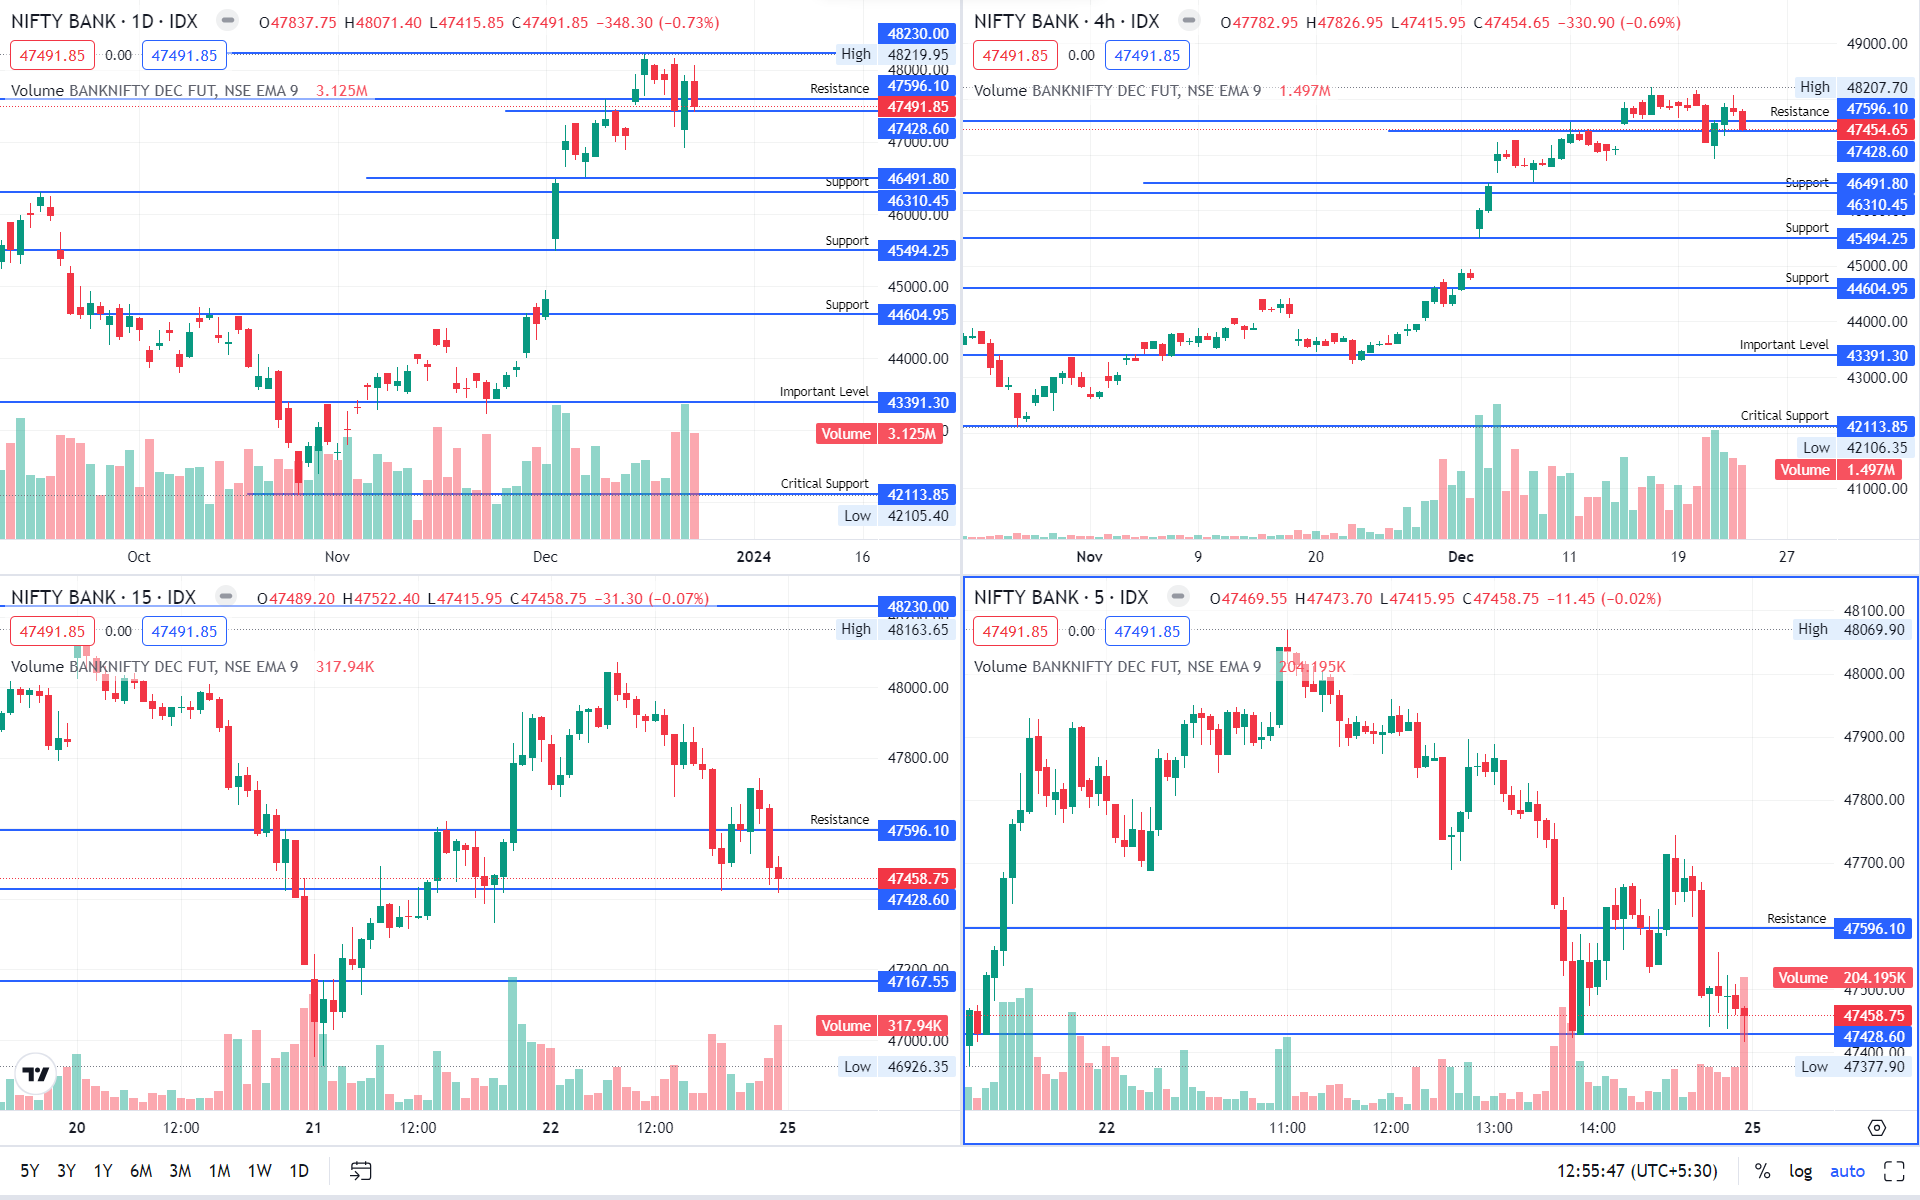
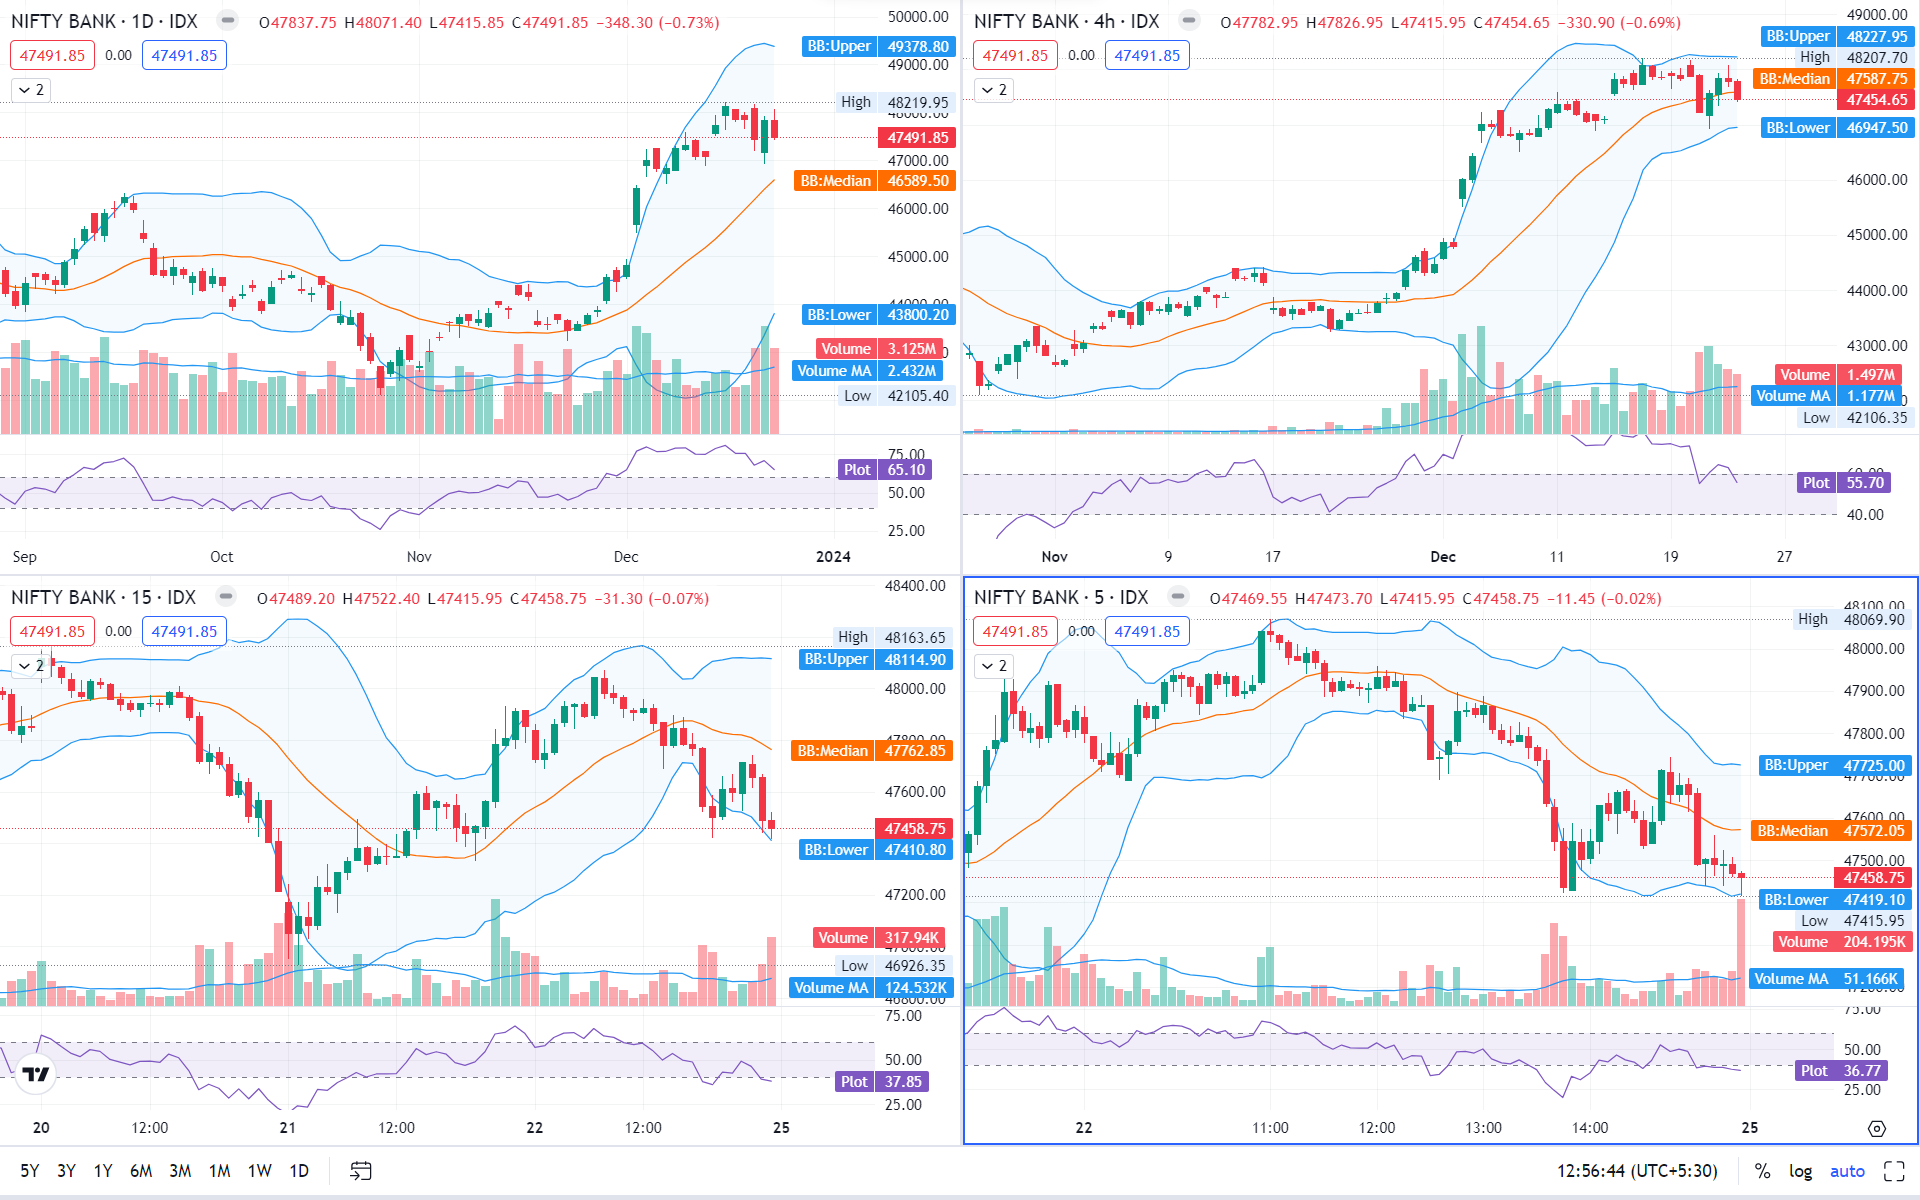
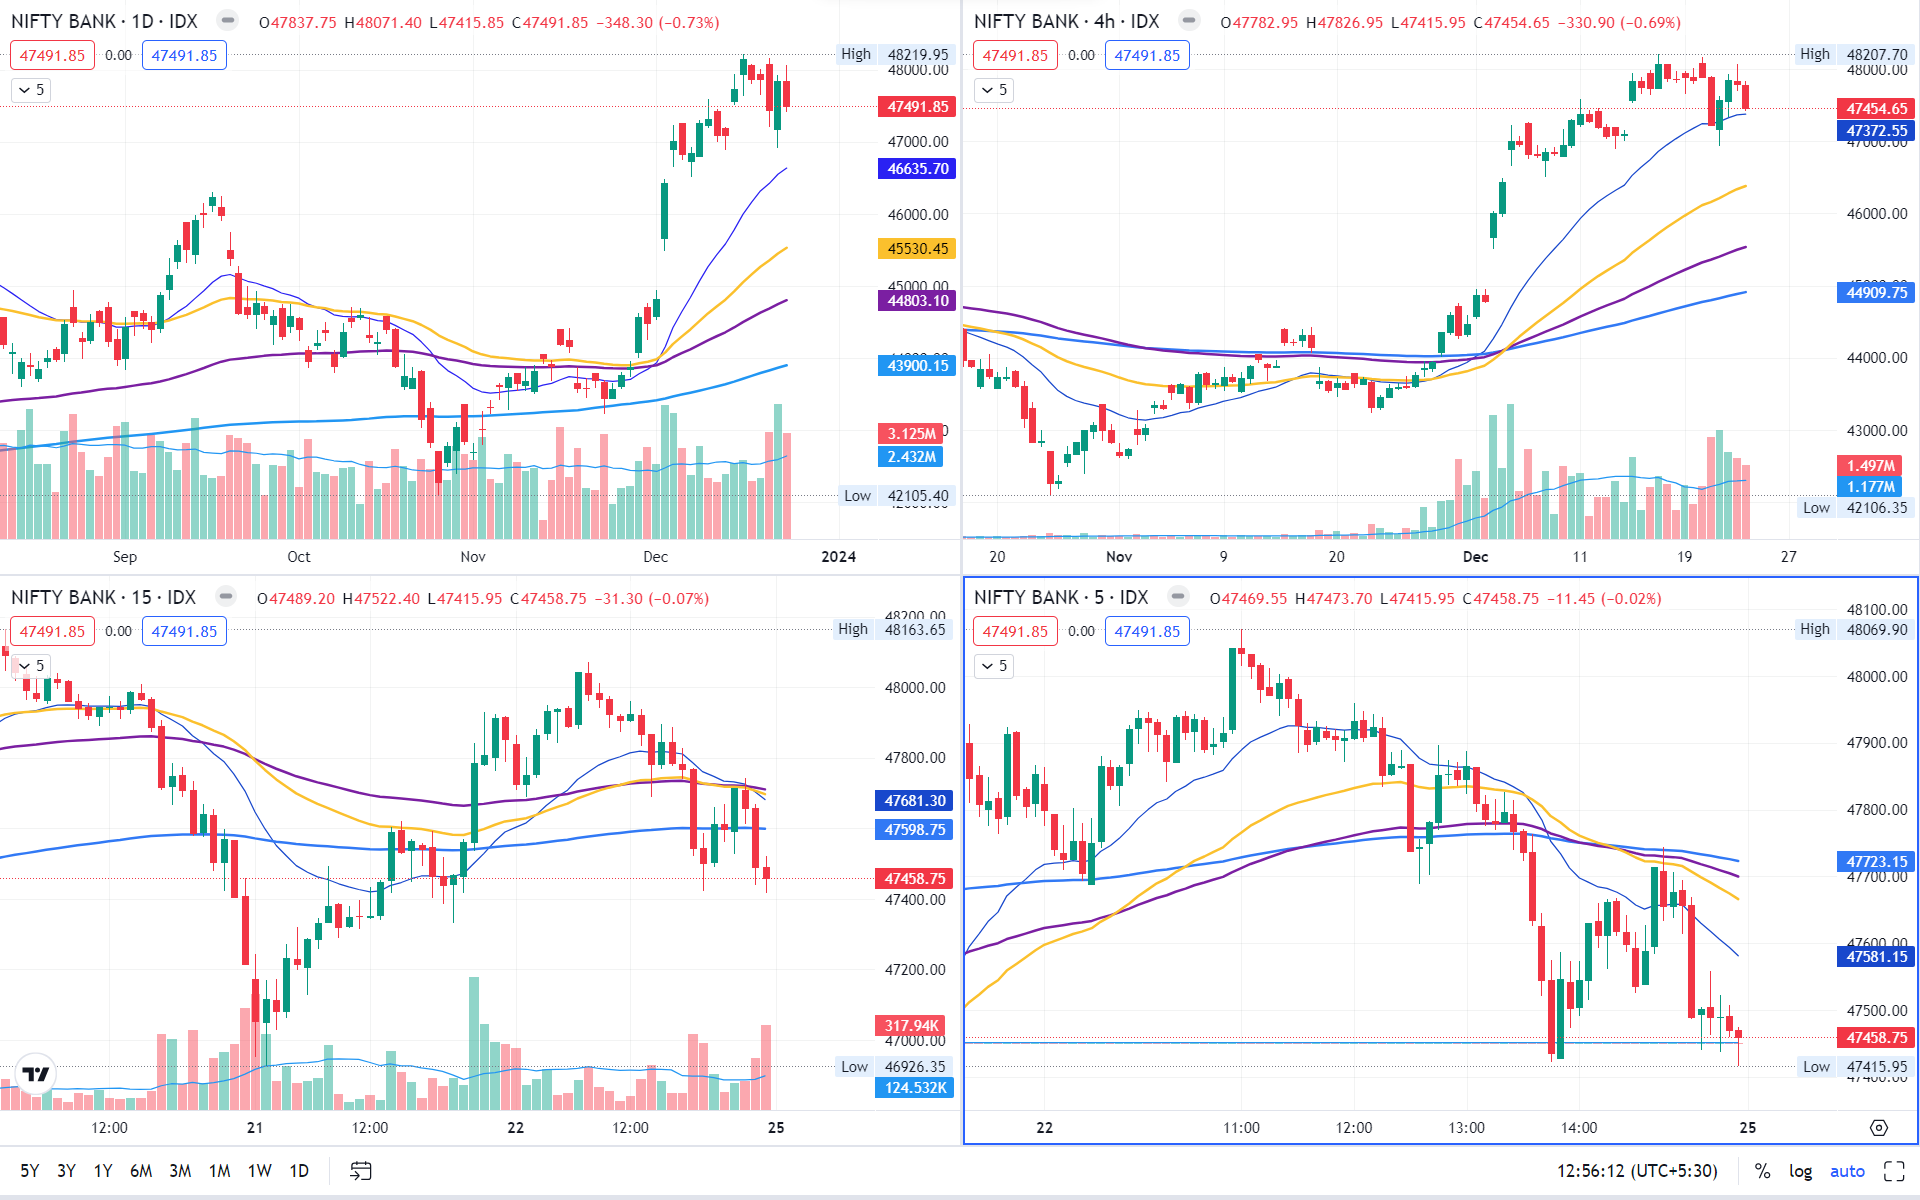
View :
Price action is bullish, in a weekly time frame. Looks like it is pausing after consecutive rise.
On daily time frame, there has been selling from the top. Time to trade cautiously.
Important Levels
- Resistance – 48,000 – 48,200
- Support – 47,100 – 47,200
- No trading – 47,100 – 47,200