Charts for 11th January, 2024 Expiry
Charts , Educational
NIFTY 50
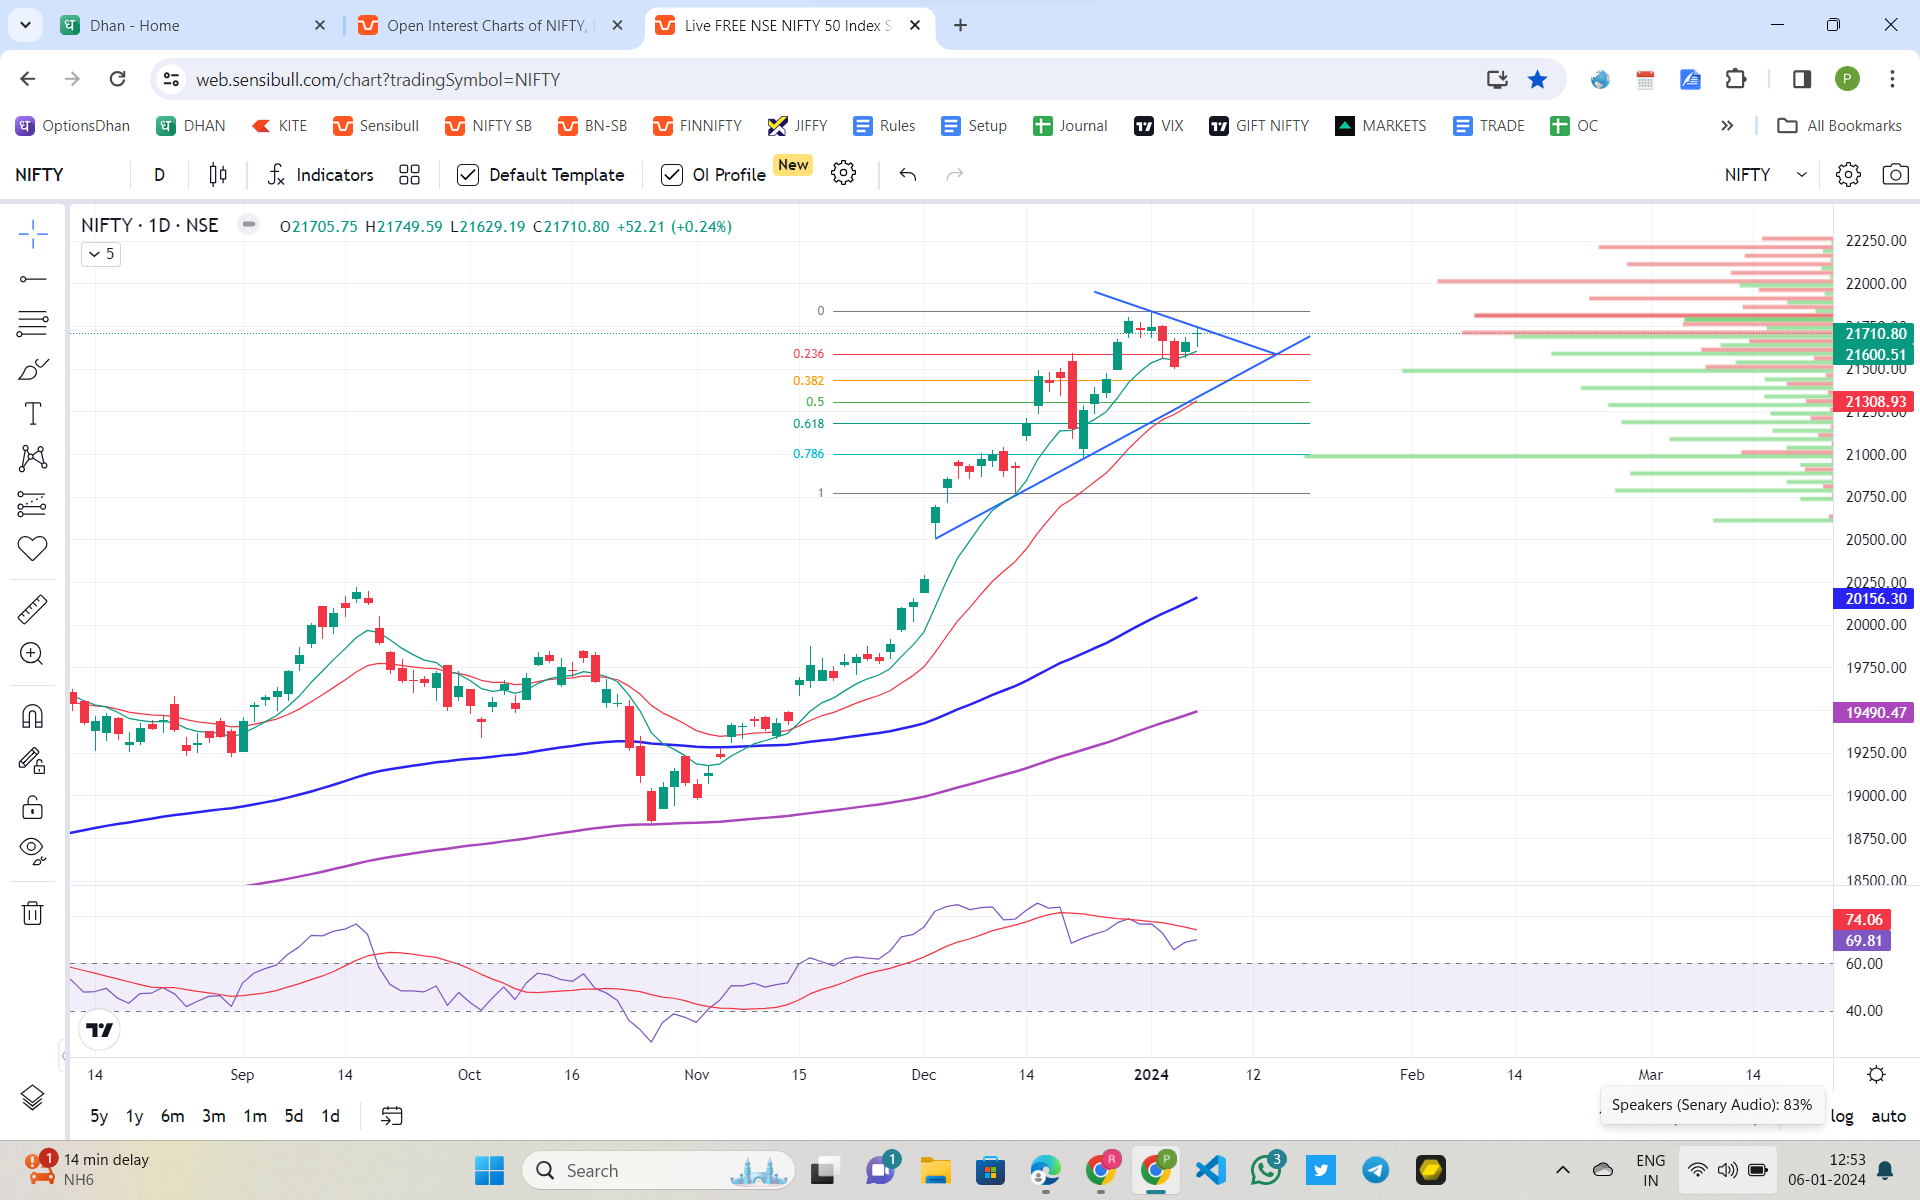
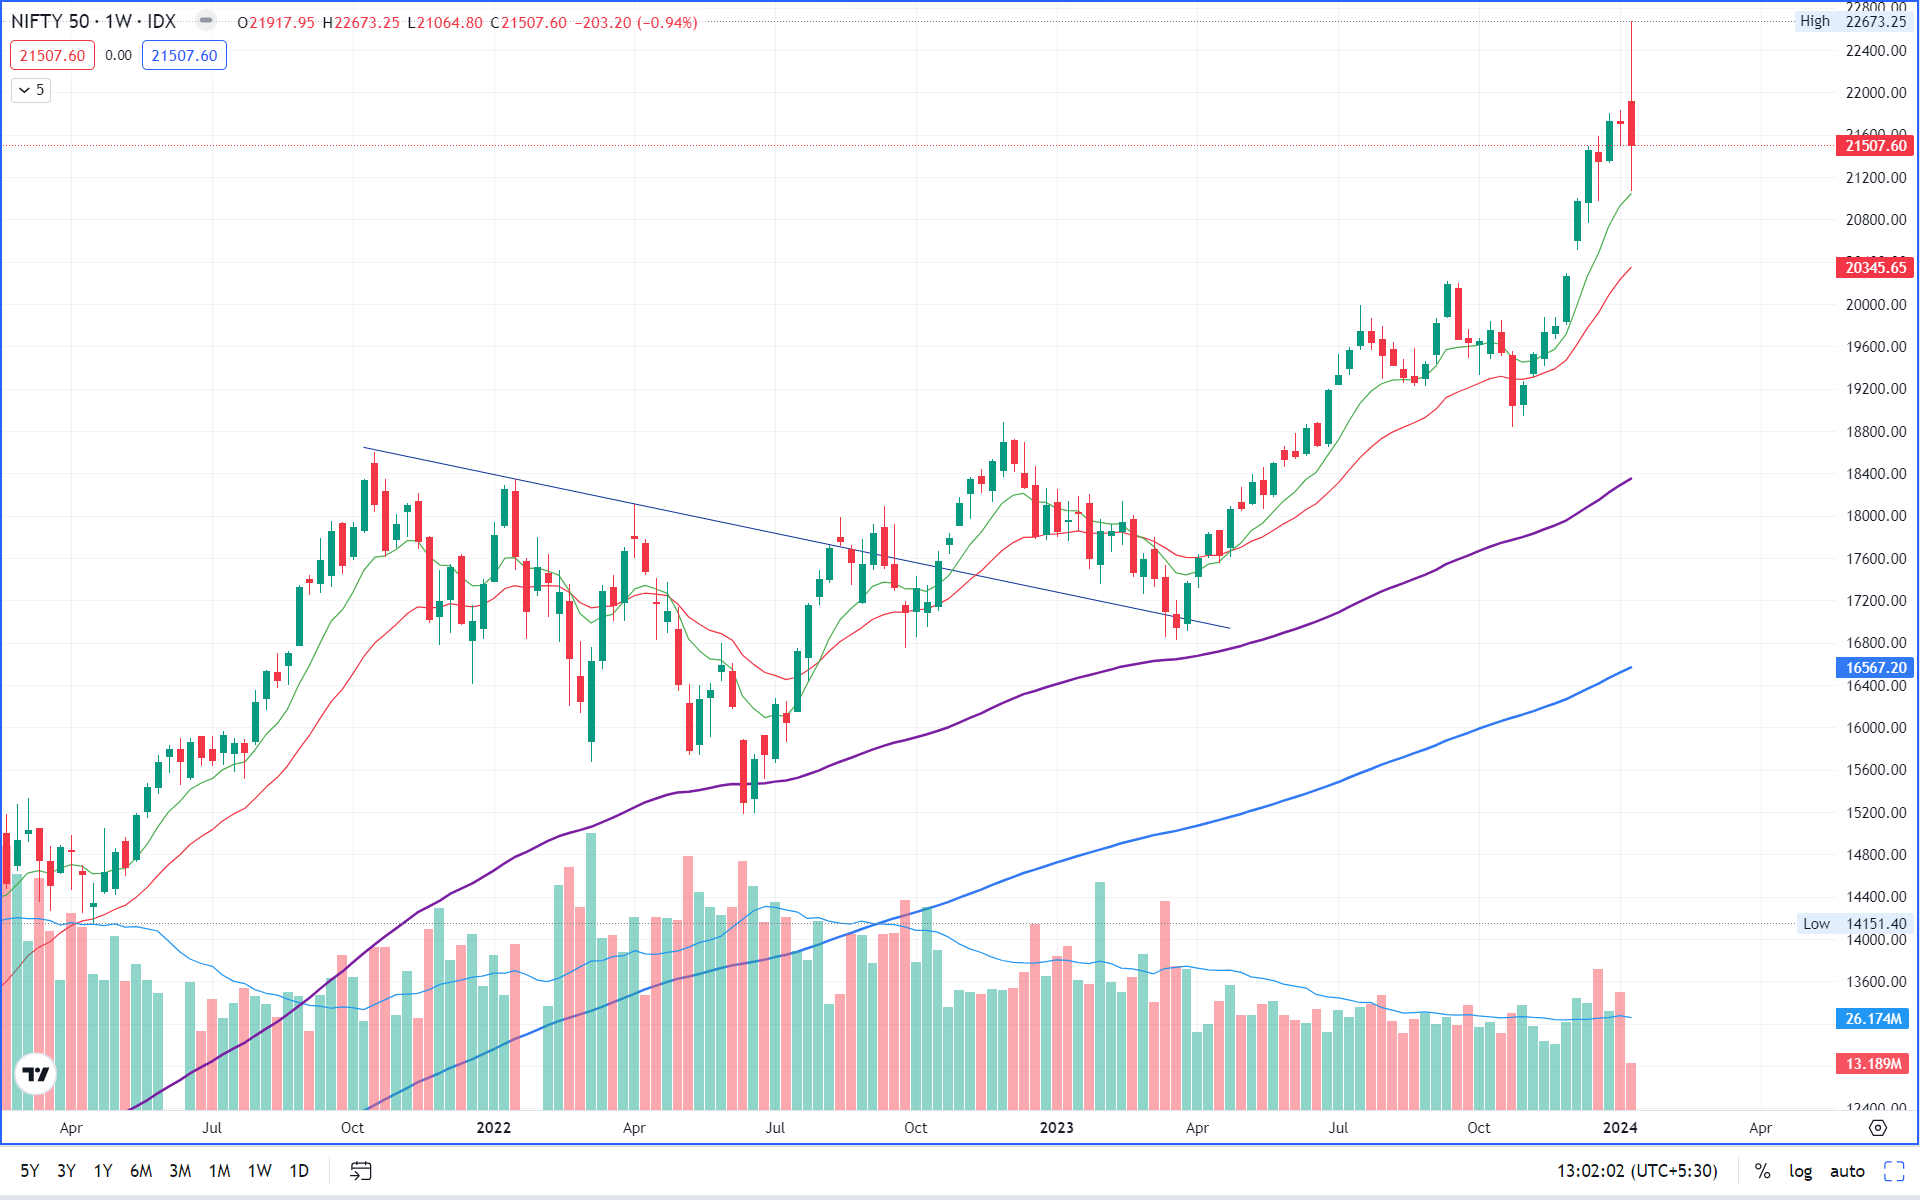
View :
On a weekly chart after a Doji, a bearish engulfing pattern is formed at the top. Likely a reversal but too early to say.
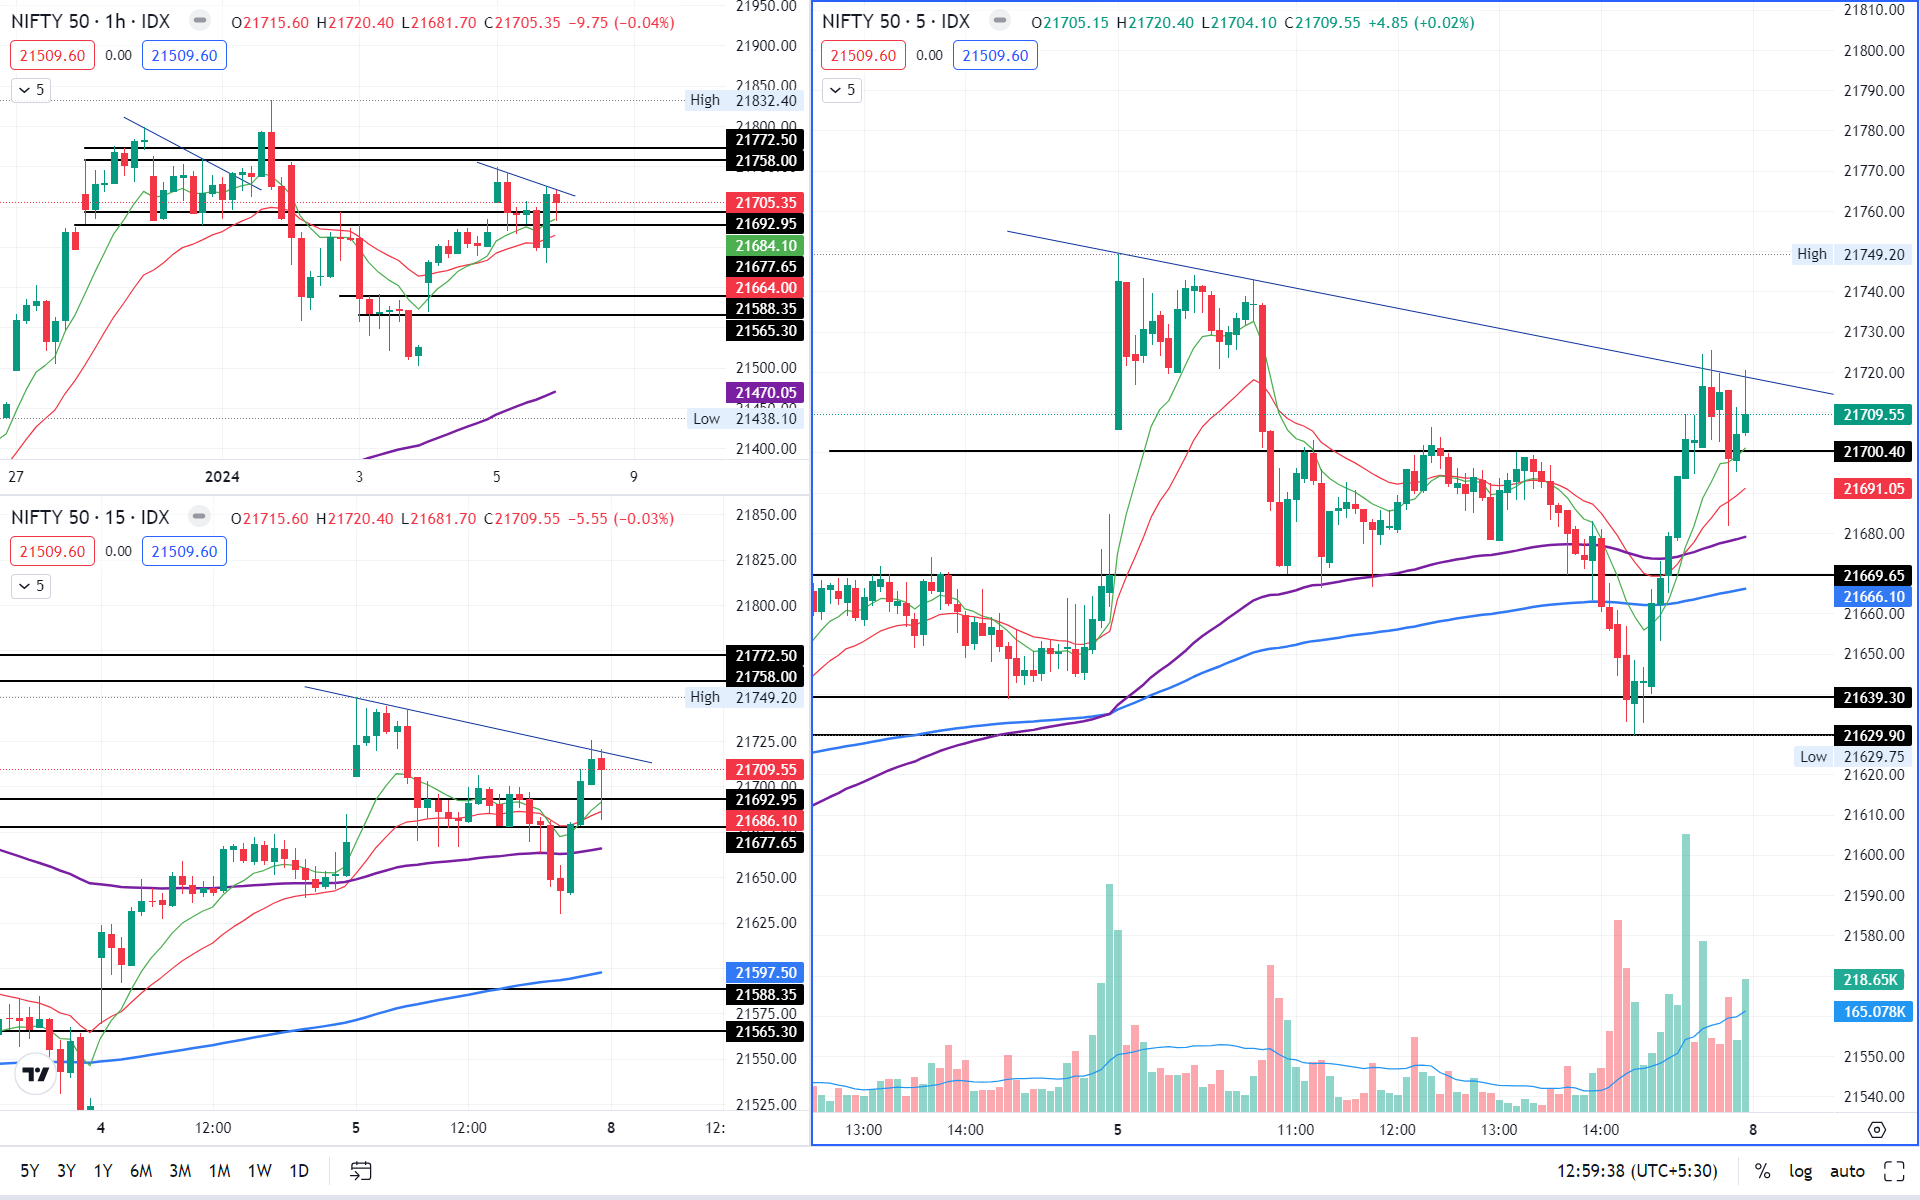
Daily price action is exhibiting lower lows but overall trend is positive. Wait and watch scenario for now.
Important Levels
- Resistance – 21,700 – 21,750
- Support – 21,550 – 21,600
- No trading Zone – 21,650 -21,750
BANKNIFTY
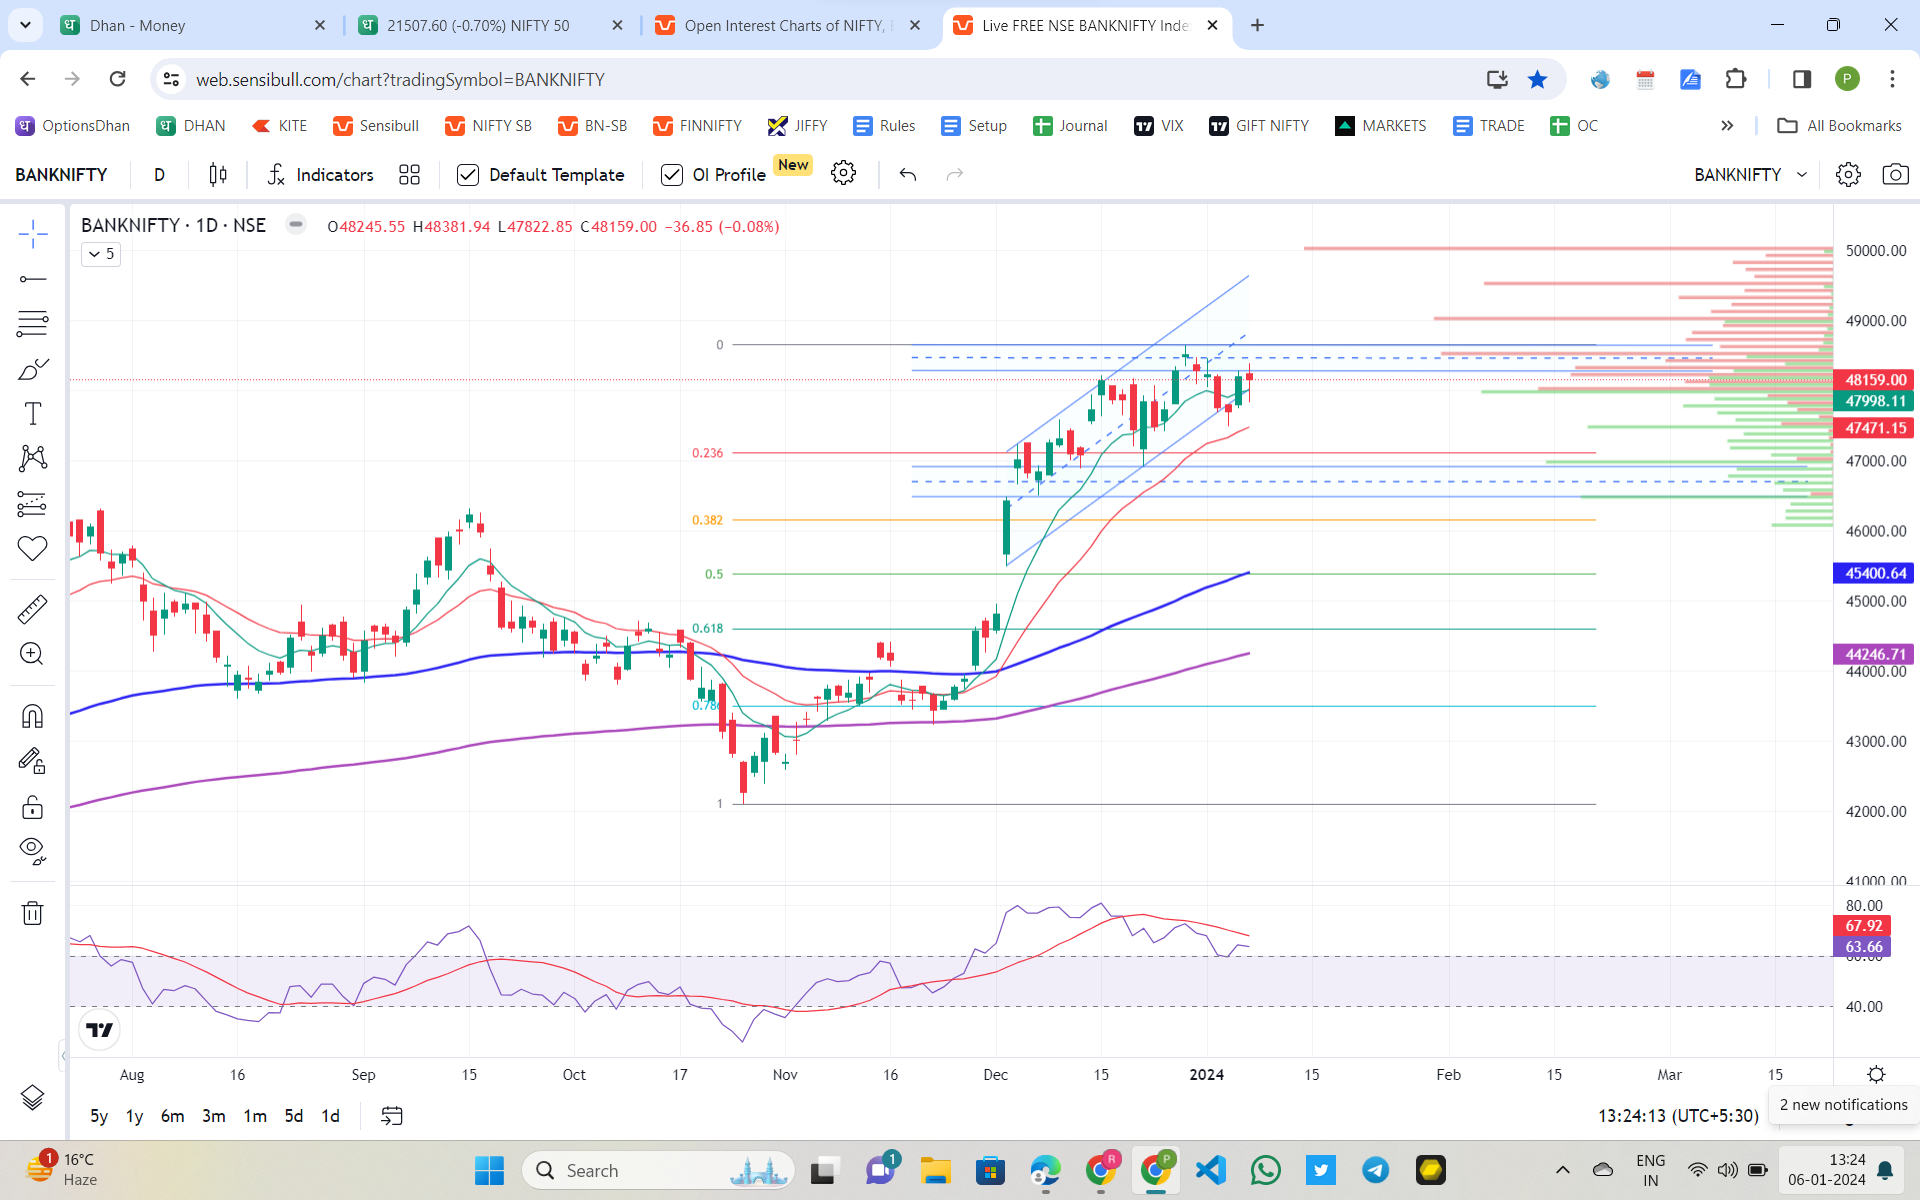
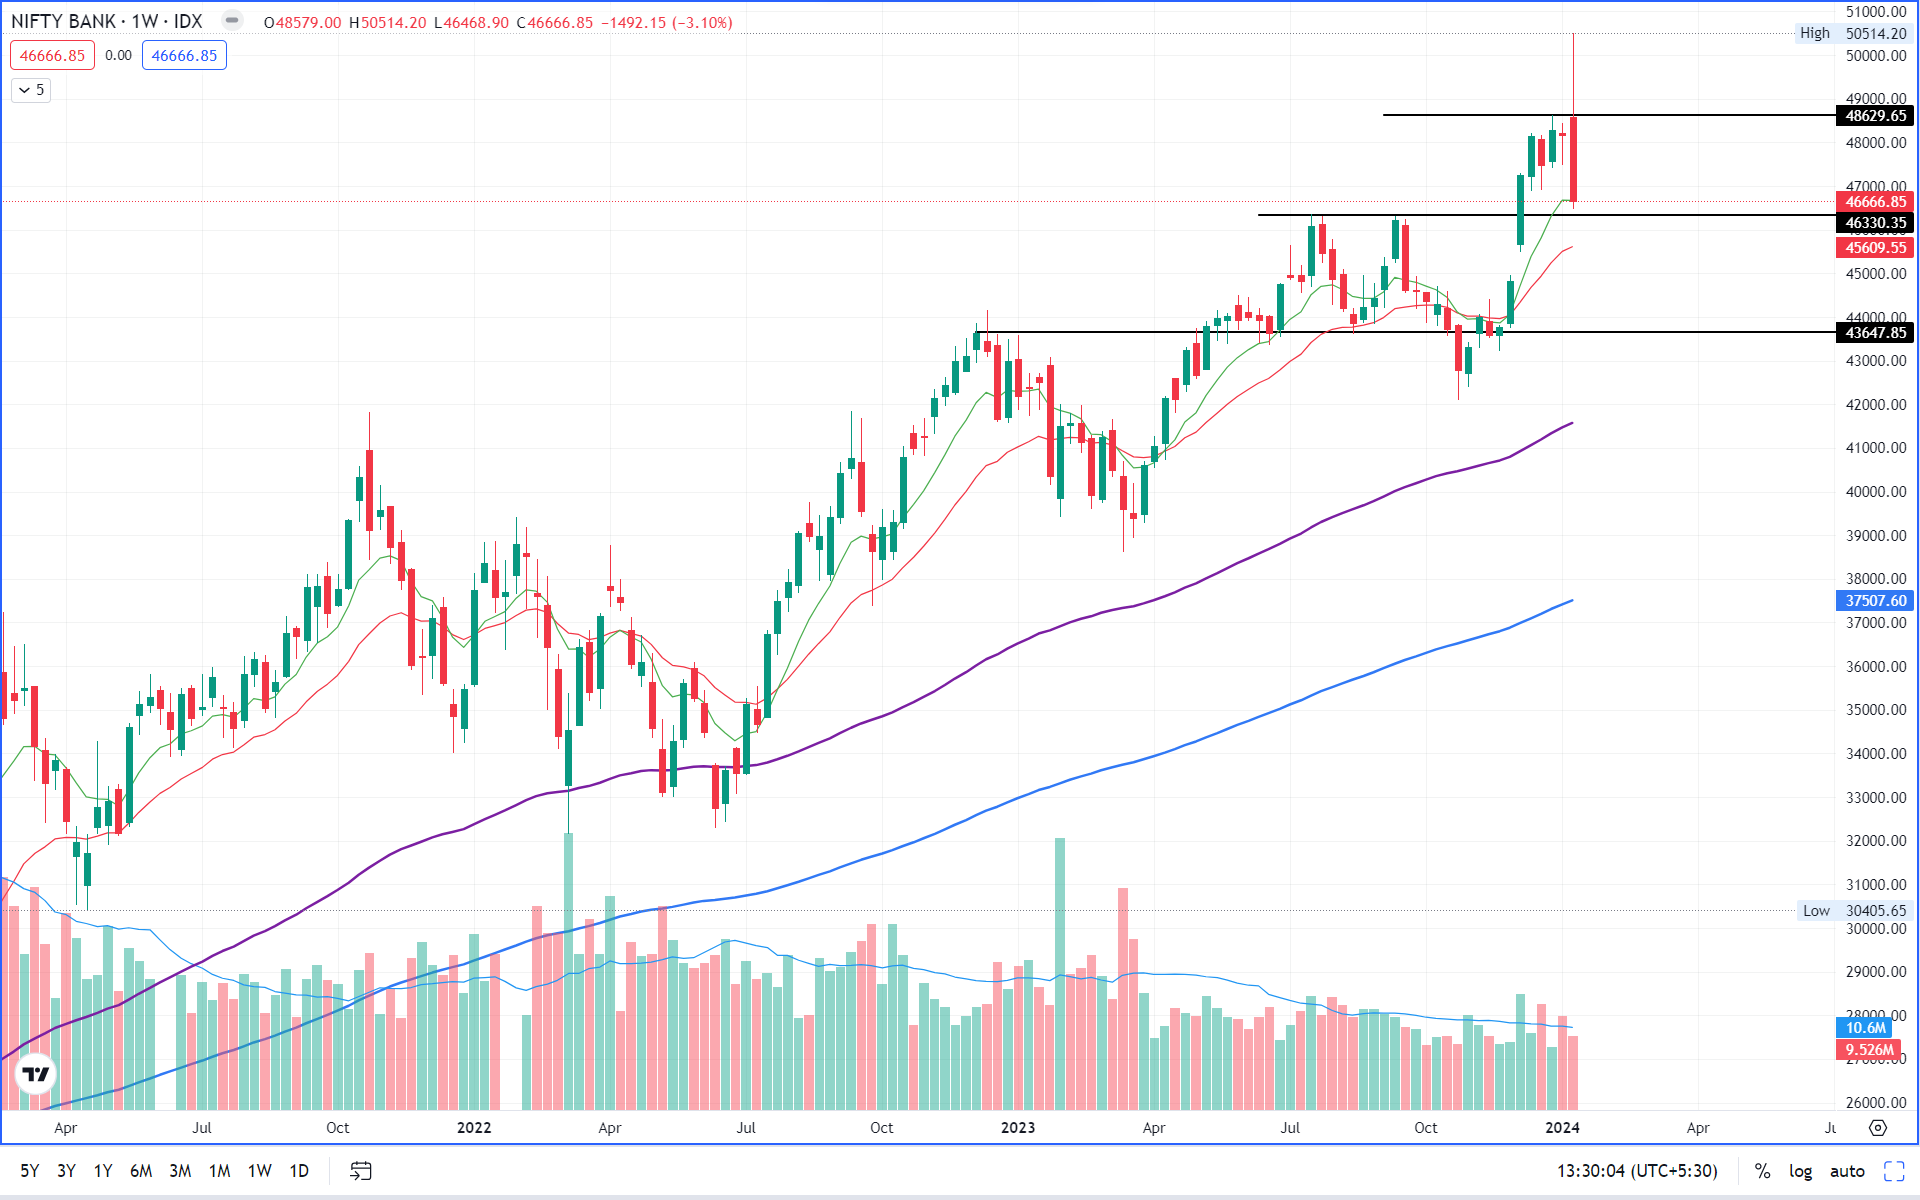
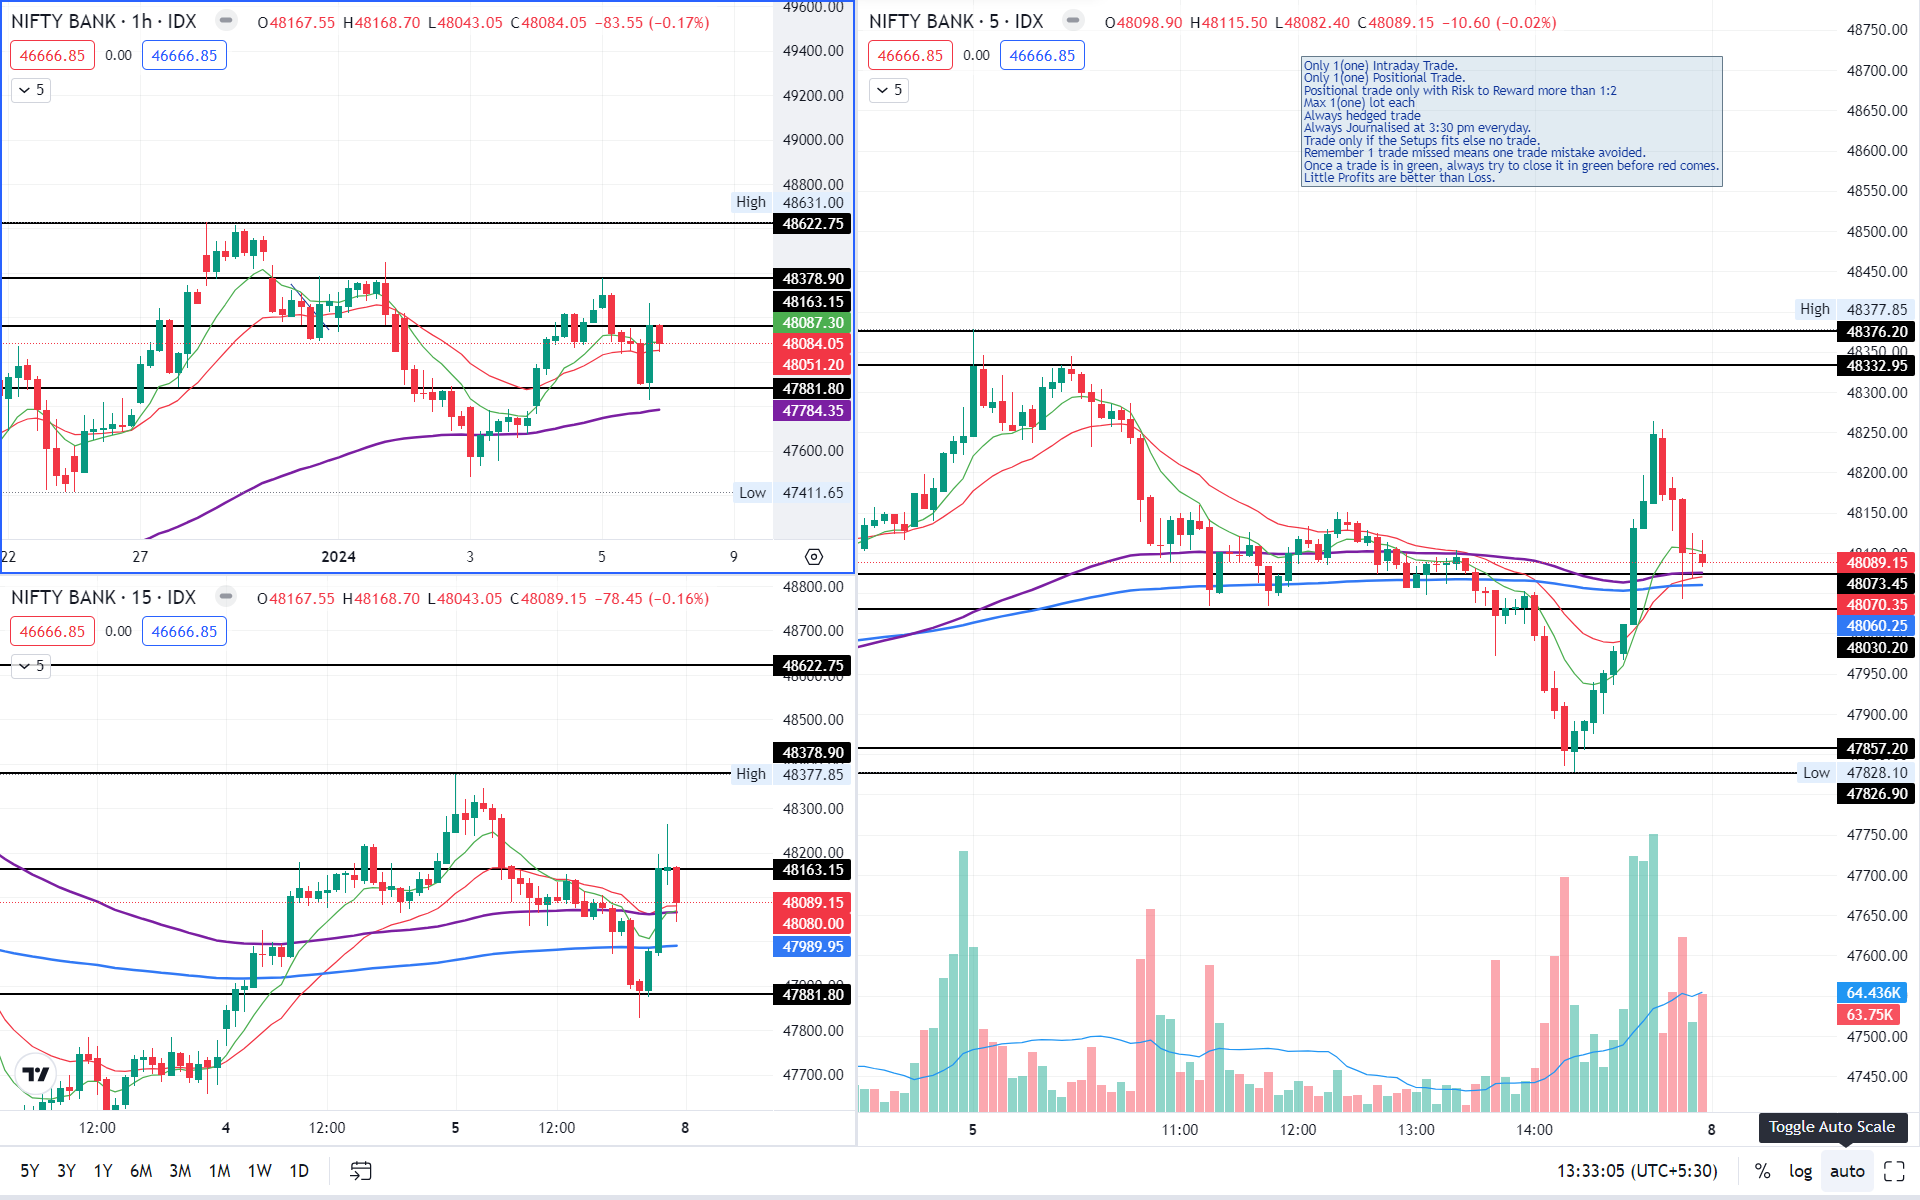
View :
Price action is exhibiting a reversal like signs, in a weekly time frame. A Doji, followed by a Bearish Engulfing.
On daily time frame, there are lower low formation. Time to trade cautiously or may just wait and watch.
Important Levels
- Resistance – 48,400 – 48,500
- Support – 47,800 – 47,900
- No trading – 48,000 – 48,200