Market View – 11th May 2023 Expiry, Expectations, Support & Resistances
#safebull , Analysis , Educational , Information , Learning , Market
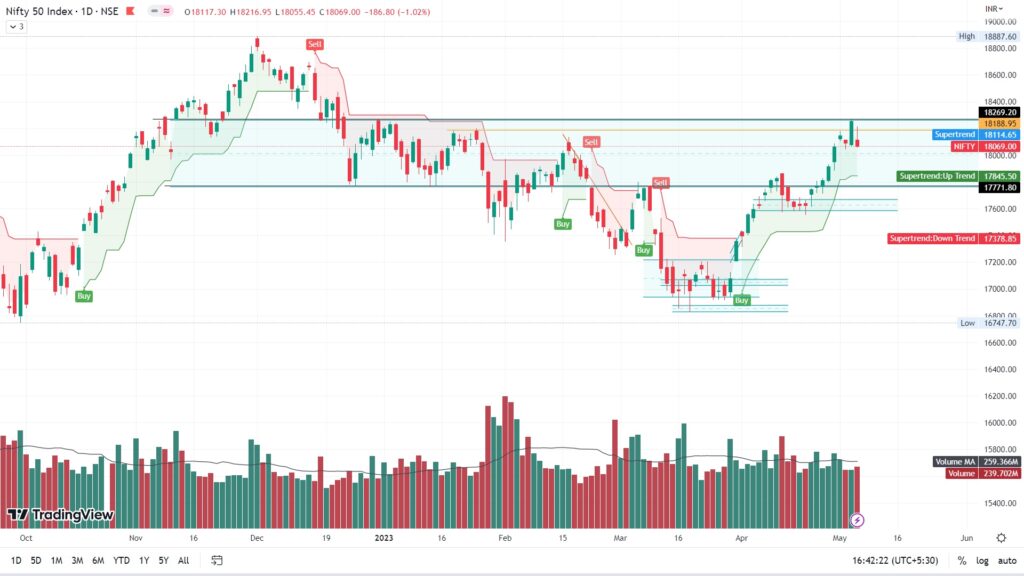
On Friday, the last session of week 18200 played up as strong resistance, and nifty face rejection for the 2nd time last week. If we look at historical data/chart this level or zone between 17850 to 18200 had be a major support range for long time. For the coming week too this will be a major hurdle on the upper side…[ Read More ]…
How the market turn out previous expiry 4th May 2023, and what we can expect the next expiry. Broader view is shared below for the next week expiry, on the basis of Technical and Data Analysis.
IMPORTANT ALERT !!!:-
- Read the Disclaimer.
- For intraday follow price action in shorter time frame.
- This just a personal opinion.

How the market turn out this expiry, 4th May 2023?
As expected and projected last week, market turned out exactly as expected, and taken rejection at 18200 level, but with positive sentiments building up in world markets across, in line with the expected FED raise of 25Bps, and an indication that it could be the last raise, if datas are in line with the projections. After a dip bulls pulled the market back up and closed around at 18250 levels, both technical and data looked positive on 4th May expiry.
At the end of expiry, resistance was at 18300 with maximum calls written at it, some consolidation around this range should be great before it makes or records a new all time high.
On Friday, post the expiry, the last session of week 18200 played up as strong resistance, and nifty face rejection for the 2nd time last week. If we look at historical data/chart this level or zone between 17850 to 18200 had been a major support range for long time before the market plunged. For the coming week too this will be a major hurdle on the upper side.
Technical Analysis
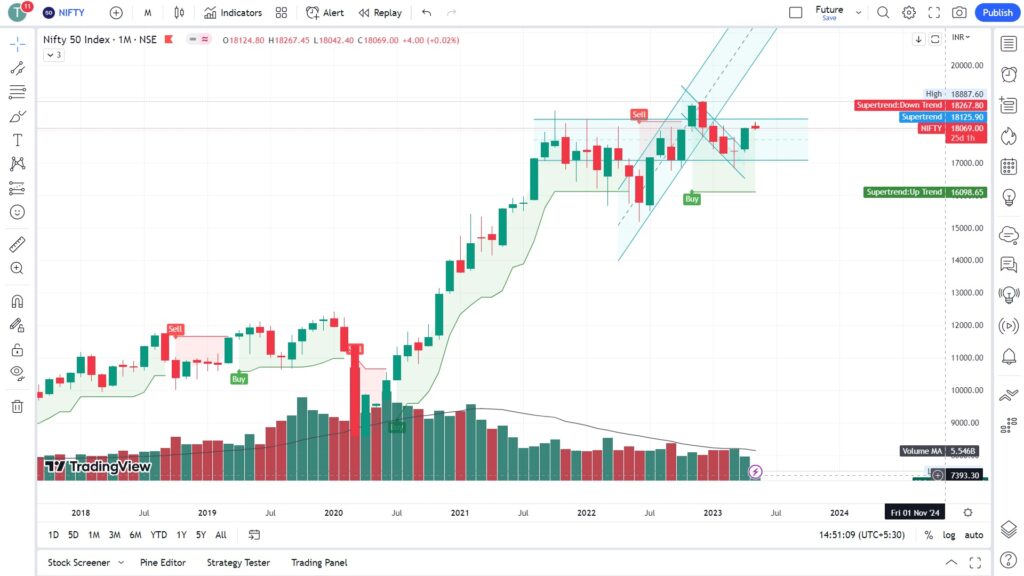
Monthly View- On the monthly chart, it has broken out from the bearish channel and closed on a very strong bullish note, after a trend reversal confirmation a bullish candle is developing, after a huge sell off on Friday, the last session of the week, it closed flattish forming a slight negative red candle but overall bullish trend is still intact. Refer the Fig. 1
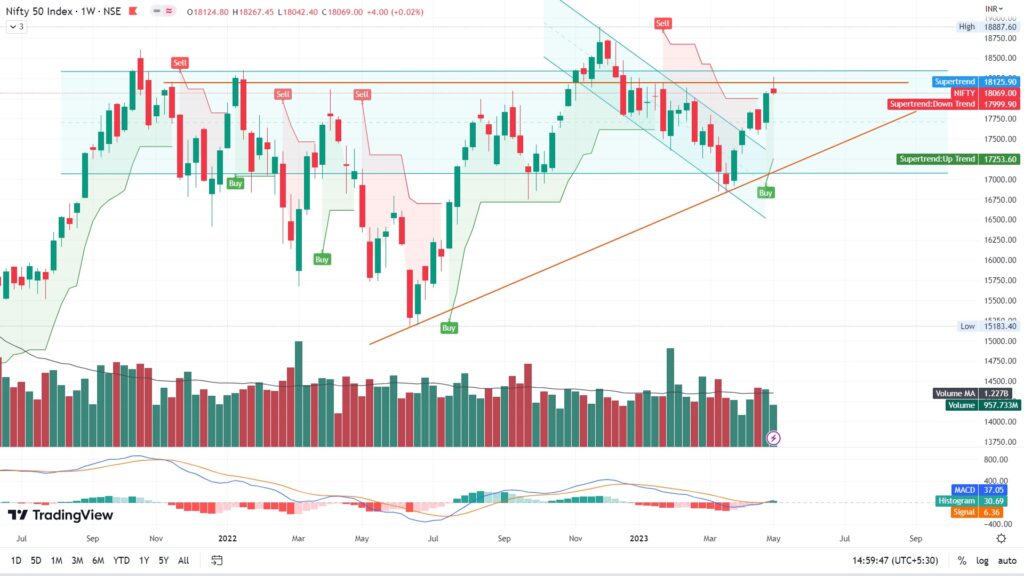
Weekly View- After a very strong directional move on last expiry, selling was observed in NIFTY, and with that overall weekly closure was slightly negative with an inverted hammer formation, in the last 5 weeks- the market had added 1260 pts, considering this, a pause like this week is very much anticipated and required for further up move. Refer the Fig. 2
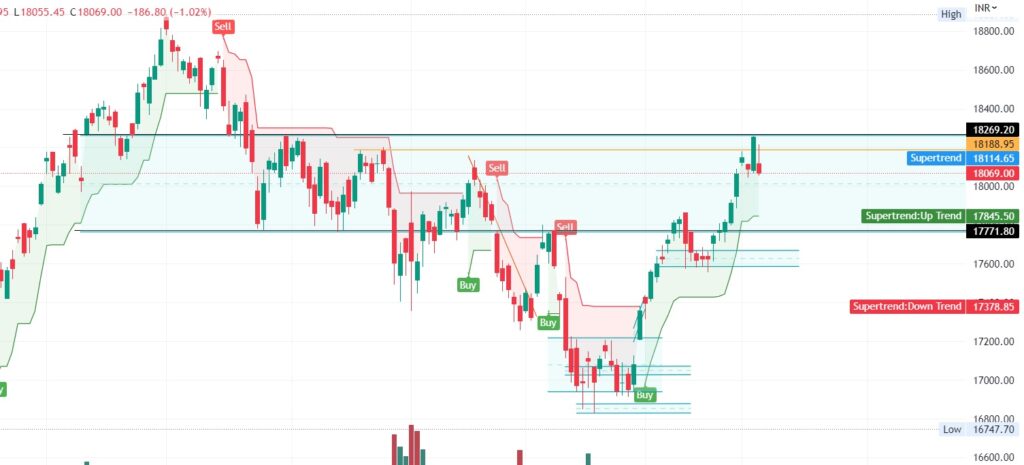
Daily View- Bull run continued till last expiry session, and looked very strong, price action perfectly building up, after a dip as expected at 18200 and on expiry day after a healthy correction in early hours, it had pushed and broken the 18200 level- a strong resistance both from chart and data point of view. This happened despite a weak performance by US and European markets, Indian indices performed well and buying observed by FIIs specially in cash segment indicating a long term positivity. And on last Friday market fell in line with all the global peers but in the broader picture market is still bullish but time has come to trade cautiously in long side.
Market sell off is mostly led by the HDFC twins, however buying still continues by FIIs. Refer the Fig. 3
Important Levels from hourly Chart:-
Resistance levels are – 18150 – 18200
Support levels are – 18950 – 18000
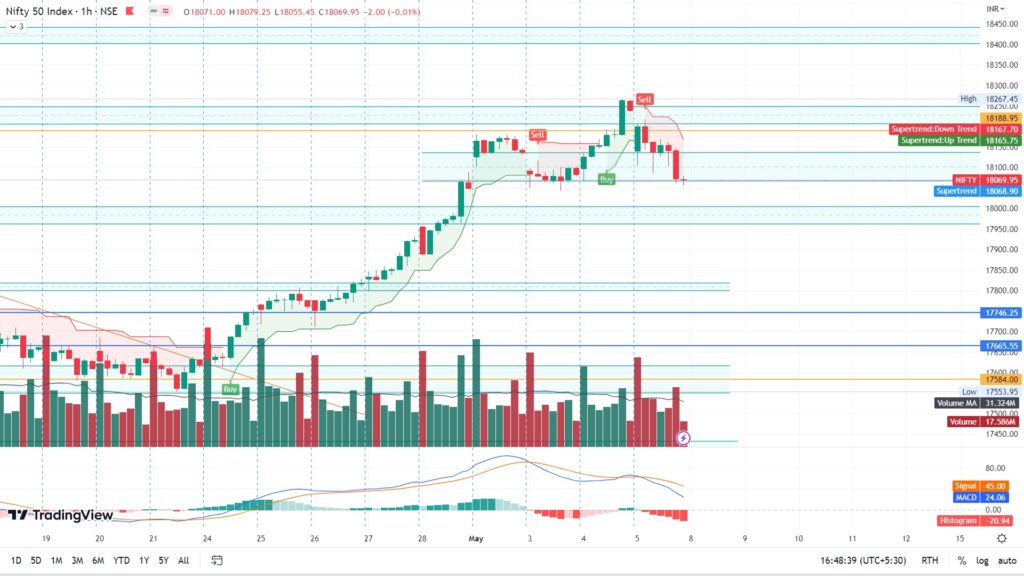
No trading Zone- 18950 – 18000
Previous Day – Strongly Negative
Previous Week – Negative.
Note:- Bull run continues, and looks very strong, price action is perfectly building up, after a dip as expected at 18200 and on expiry day after a healthy correction, it has pushed and broken the 18200 level- a strong resistance both from chart and data point of view. Despite a weak performance by US and European markets, Indian indices performed well and buying observed by FIIs specially in cash segment indicating a long term positivity. And on last Friday market fell in line with all the global peers but in the broader picture market is still bullish but time has come to trade cautiously in long side.
**Factors that are worrying are low VIX and market mood is at extreme greed. Finally Vix had improve to some extend.
Data Analysis
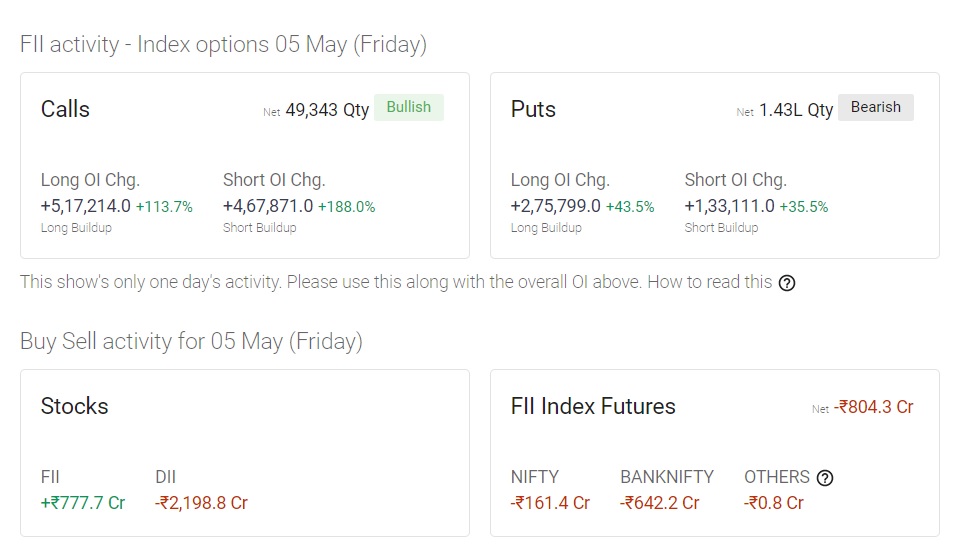
FII & DII Activity-
Buying continues by FII in cash segments, but selling in futures segment indicating a mixed signal.
FII Cash :: ▲ +₹777.68 Cr
FII Futures :: ▼ -₹804.32 Cr
DII Cash :: ▼ -₹2,198.77 Cr
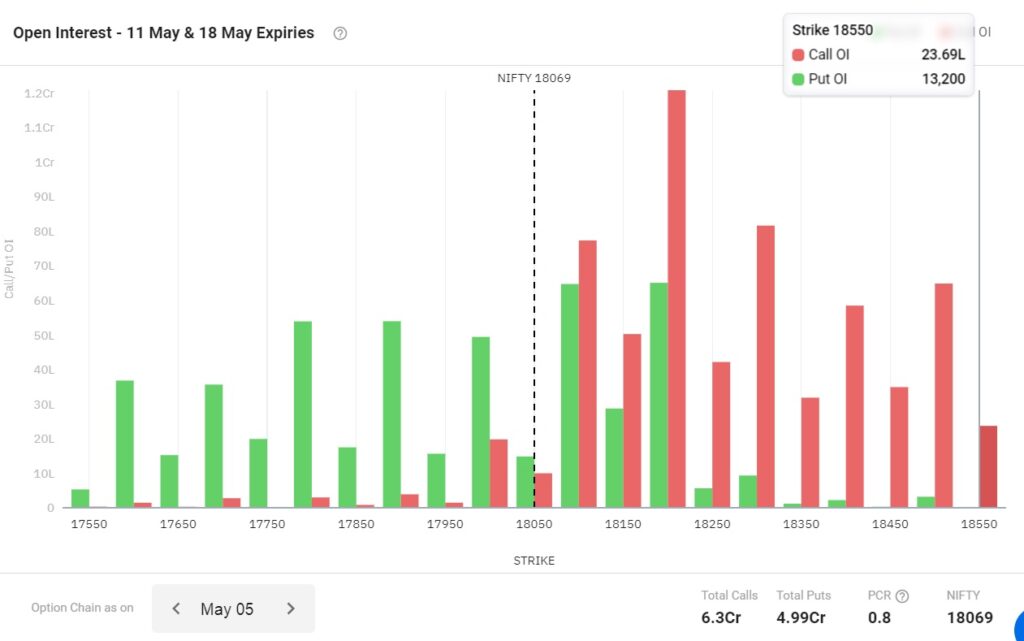
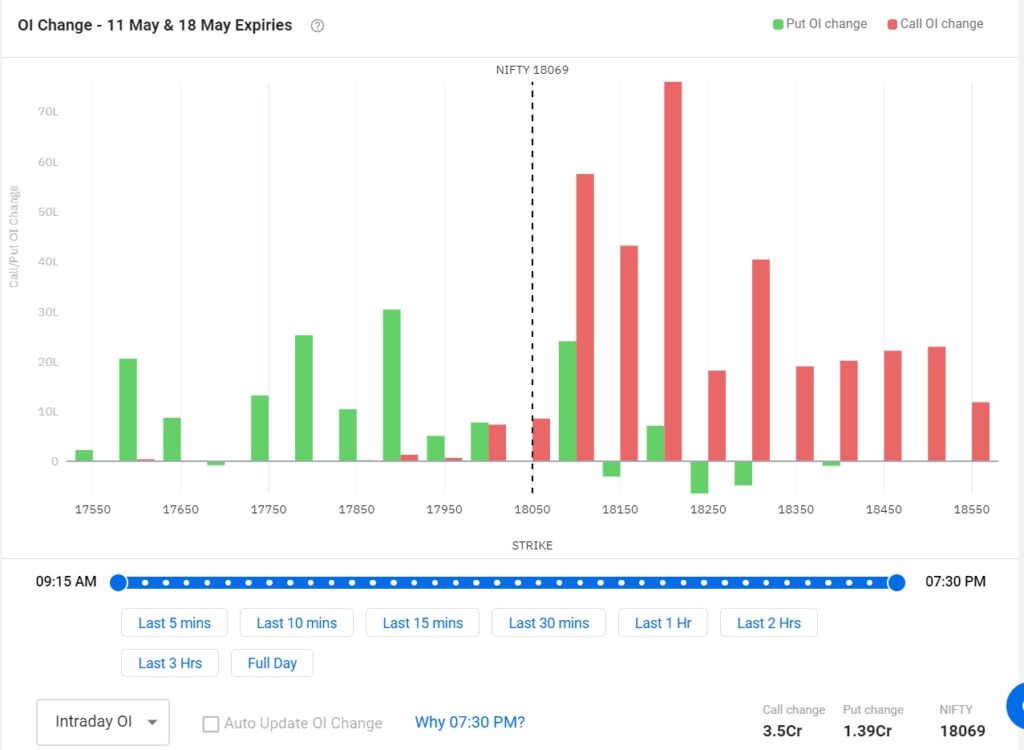
Open Interest (OI)-
More calls written than puts with maximum at 18200, and Rs. 1.21 Cr worth written. Few puts unwinding at higher levels and PCR gap have increased further, indicating weakness in the broader market.
PCR – 0.8 (-) Flat to Bearish.
Market Sentiments
World Markets – World market digested the US FED hikes, traded mostly positive.
SGX N50 – Closed around 18178.5 at 2:00Am 06-05-2022
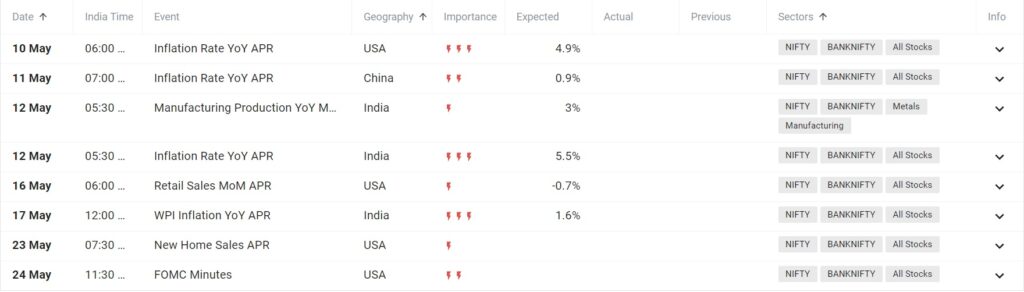
Events this Expiry/week
Quick links::
- #safebull (14)
- Analysis (6)
- Calendar (1)
- Educational (9)
- Information (10)
- Learning (27)
- Market (3)
- News (6)
- Strategy (17)
- Taxes (1)
The above analysis is solely the opinion of the author, no way an assured tips/direction to trade, they are solely for educational purposes. Please do not trade with out a proper study and analysis, we will not be responsible for your loss. We are not SEBI registered.
#SafeBull