How the market traded or turn out this expiry, 4th May 2023, and what we can expect the next week?
#safebull , Analysis , Educational , Information , Learning , Market
How the market turn out this expiry 4th May 2023, and what we can expect the next expiry. Broader view is shared below for the next week expiry, on the basis of Technical and Data Analysis.
IMPORTANT ALERT !!!:-
- Read the Disclaimer.
- For intraday follow price action in shorter time frame.
- This just a personal opinion.

How the market turn out this expiry, 4th May 2023?
As expected and projected last week, market turned out exactly as expected, and taken rejection at 18200 level, but with positive sentiments building up in world markets across, as expected FED raised 25Bps, but with indication that it could be the last raise, if datas are in line with the projections. After a dip bulls pulled the market back up and closed around at 18250 levels, both technical and data looks positive. Now resistance is at 18300 with maximum call written at it, some consolidation around this range would be great before it makes or records a new all time high.
Technical Analysis
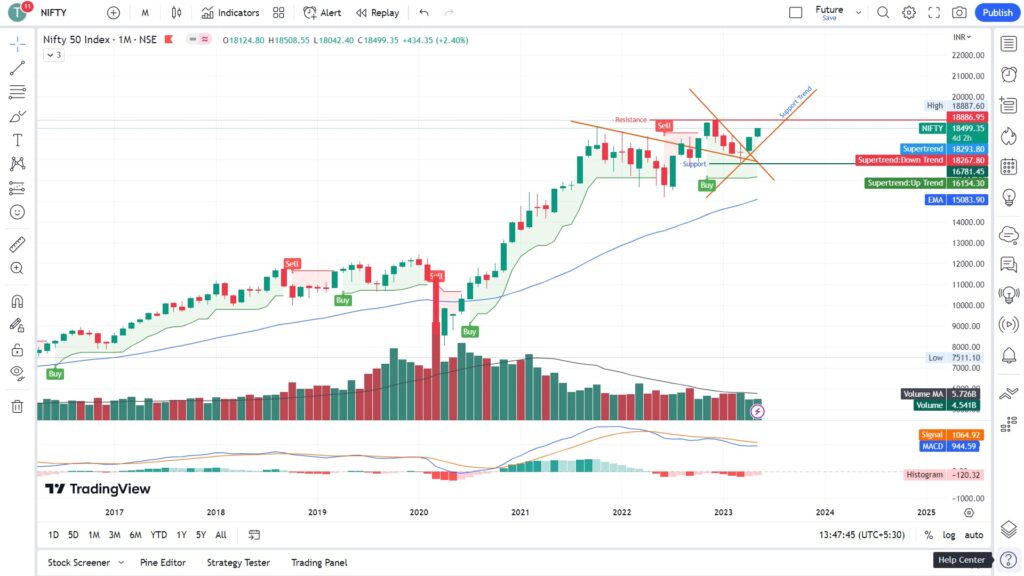
Monthly View- On the monthly chart, it has broken out from the bearish channel and closed on a very strong bullish note, after a trend reversal confirmation a bullish candle is developing, hopefully it maintains the momentum. Refer the Fig. 1
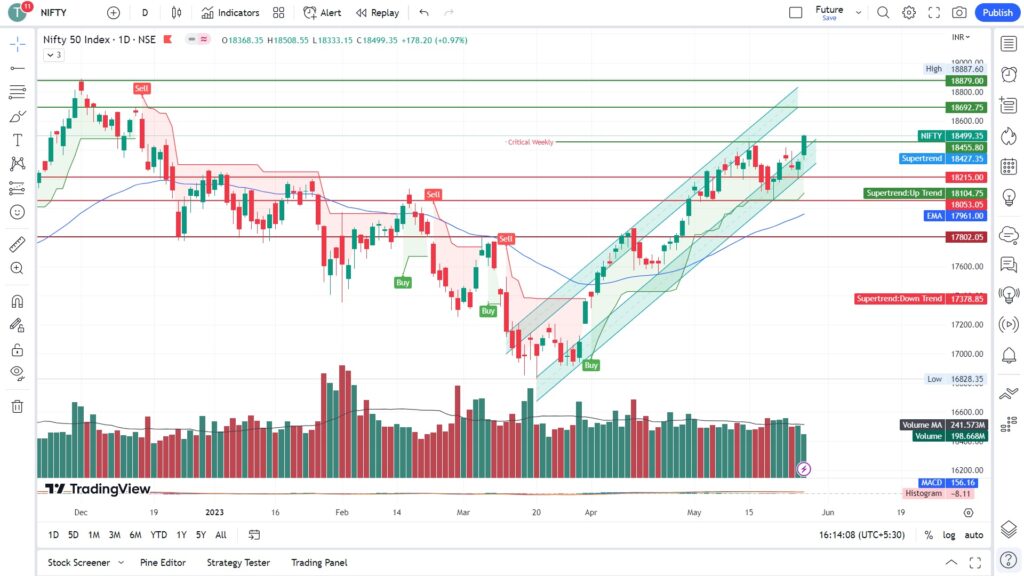
Weekly View- Another expiry ended in green, if tomorrow closes above 18135, weekly closure also will be positive. But after a bull run a healthy weekly correction, is expected or anticipated for further upward movement, I would prefer buy on dip. Refer the Fig. 2

Daily View- Bull run continues, and looks very strong, price action is perfectly building up, after a dip as expected at 18200 and today after a healthy correction, it has pushed and broken the 18200 level- a strong resistance both from chart and data point of view. Despite a weak performance by US and European markets, Indian indices performed well and buying observed by FIIs specially in cash segment indicating a long term positivity. Refer the Fig. 3
Important Levels from hourly Chart:-
Resistance levels are – 18250 – 18300
Support levels are – 18050 – 18150
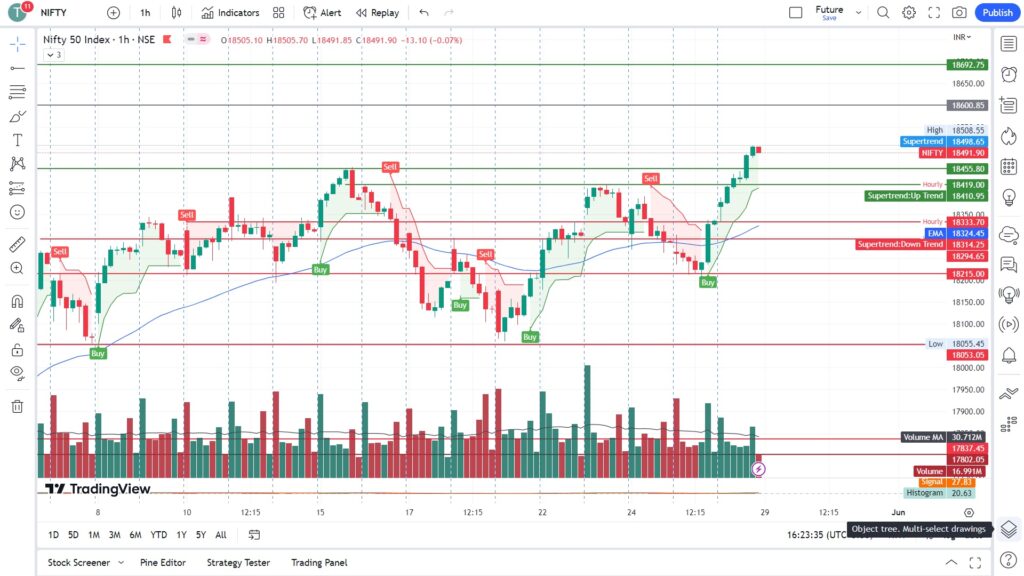
No trading Zone- 18050 – 18150
Previous Day – Strongly Positive
Previous Week – Strongly Positive.
Note:- Bull run continues, and looks very strong, price action is perfectly building up, after a dip as expected at 18200 and today after a healthy correction, it has pushed and broken the 18200 level- a strong resistance both from chart and data point of view. Despite a weak performance by US and European markets, Indian indices performed well and buying observed by FIIs specially in cash segment indicating a long term positivity.
Factors that are worrying is low VIX and market mood is at extreme greed.
Data Analysis
FII & DII Activity- Buying continues by FII in cash segments, it indicates strong bullish momentum.
FII Cash :: ▲ ++₹1,414.7 Cr
FII Futures :: ▲ +₹415.1 Cr
DII Cash :: ▲ +₹441.6 Cr
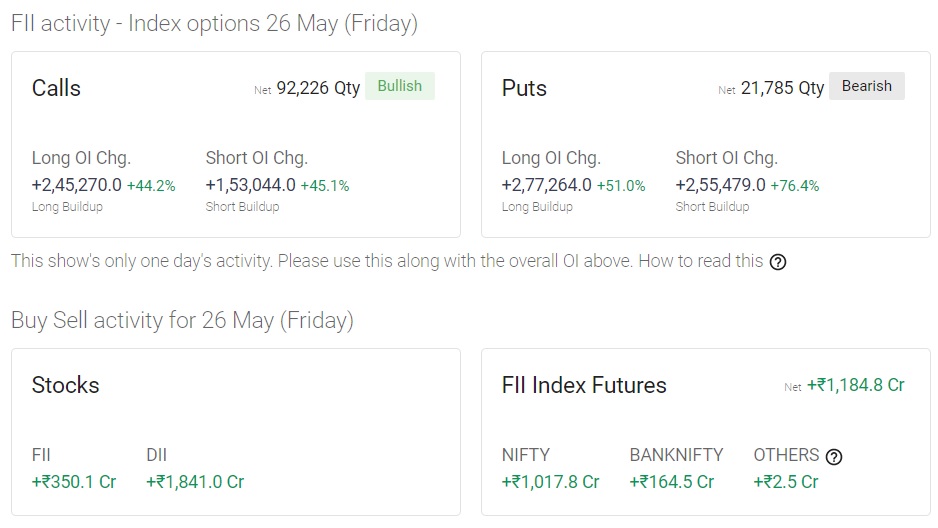
Open Interest (OI)- Both puts and calls are equally written with little more on puts side, but if we see in the last few trading sessions massive Puts are written about 1.19 Cr at 18200 & 97.66 Lakhs at 18250, and unwinding observed in calls, indicating a strong positive momentum. Factors that are worrying, is low VIX and market mood is at extreme greed. Looks mildly bullish .
PCR – 1.0 (+) Flat to Bullish.


Market Sentiments
World Markets – World market are trading mixed, digesting the US FED hikes.
SGX N50 – Closed around 18234.5 at 8:48pm 04-05-2022
Events this Expiry/week

Categories :: #safebull, Analysis, Educational, Information, Learning, Market
Quick links::
- #safebull (14)
- Analysis (6)
- Calendar (1)
- Educational (9)
- Information (10)
- Learning (27)
- Market (3)
- News (6)
- Strategy (17)
- Taxes (1)
The above analysis is solely the opinion of the author, no way an assured tips/direction to trade, they are solely for educational purposes. Please do not trade with out a proper study and analysis, we will not be responsible for your loss. We are not SEBI registered.
#SafeBull