5 EMA Breakdown Strategy
Blogs
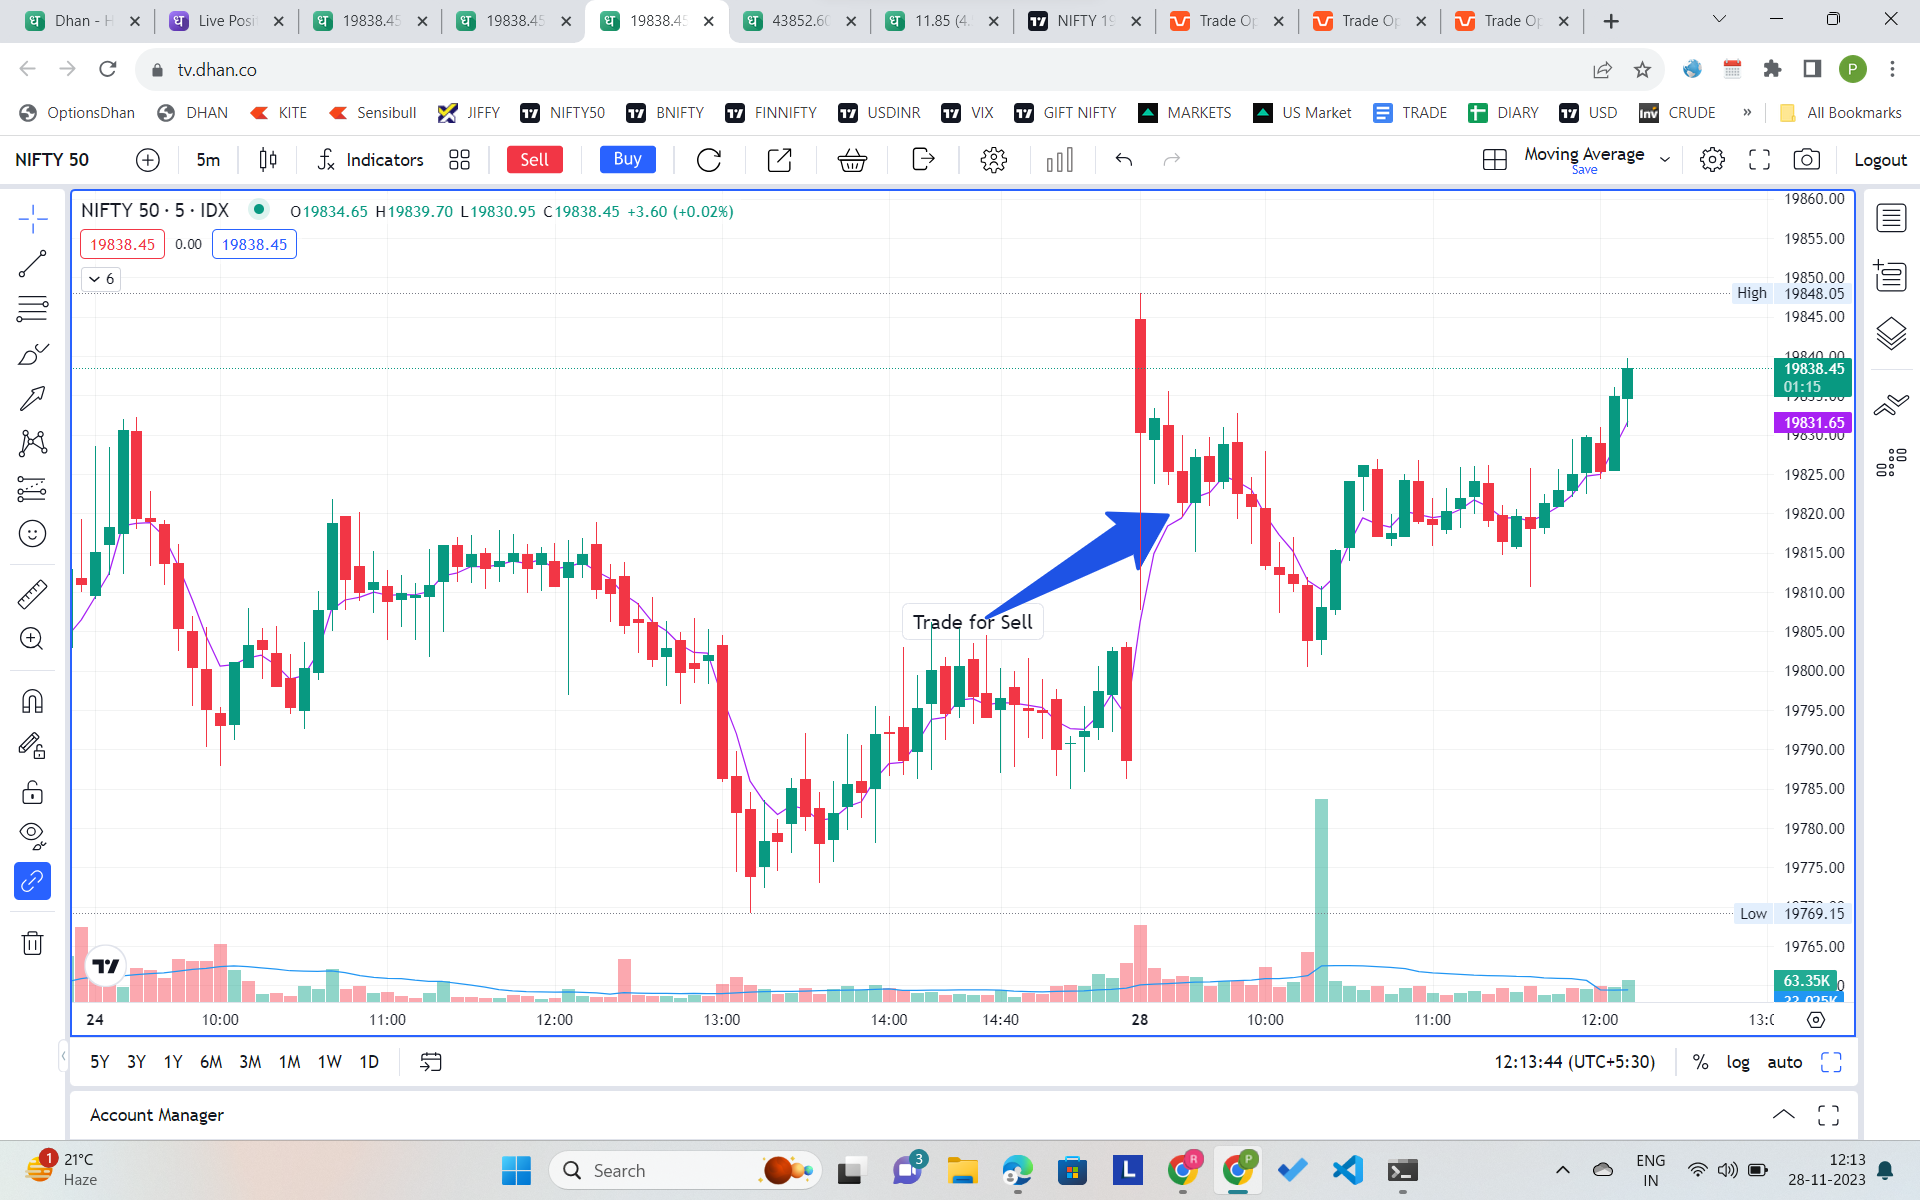
A 5-minute EMA breakdown occurs when the price of a security falls below its 5-minute EMA…[..]
:: The 5-minute Exponential Moving Average (EMA) is a commonly used technical indicator in financial markets. Traders use the 5-minute EMA as a tool to identify potential trading opportunities and to track the direction of a trend. In this blog post, we will discuss what a 5-minute EMA breakdown is, how it can be used by traders, and some key factors to consider when using this strategy.
What is a 5-minute EMA breakdown?
A 5-minute EMA breakdown occurs when the price of a security falls below its 5-minute EMA. This is considered a bearish signal and indicates that the trend is shifting downwards. Traders often use this signal as a trigger to sell the security or to enter a short position. Conversely, a 5-minute EMA breakout occurs when the price rises above its 5-minute EMA, which is a bullish signal and indicates a potential upward trend.
How can traders use the 5-minute EMA breakdown strategy?
Traders can use the 5-minute EMA breakdown strategy in a number of ways. One approach is to use it in conjunction with other technical indicators to confirm a trade signal. For example, a trader may look for a 5-minute EMA breakdown in combination with a bearish MACD crossover, indicating a stronger bearish trend.
Another approach is to use the 5-minute EMA breakdown as a standalone signal to enter a trade. For instance, a trader may place a sell order when the price of a security falls below its 5-minute EMA, with a stop-loss order in place in case the price reverses direction.

Factors to consider when using the 5-minute EMA breakdown strategy
While the 5-minute EMA breakdown strategy can be an effective tool for traders, it’s important to keep in mind that no trading strategy is foolproof. Here are some key factors to consider when using the 5-minute EMA breakdown strategy:
- Market volatility: Highly volatile markets can cause false signals, making it difficult to accurately identify a trend.
- Trading volume: Low trading volumes can also lead to false signals and increase the risk of price manipulation.
- Time frame: The 5-minute EMA breakdown strategy is most effective on shorter time frames. Traders should consider using other time frames, such as 15-minute or hourly charts, to confirm trends and avoid false signals.
- Risk management: Traders should always use stop-loss orders to manage their risk and limit potential losses.
- Confirm the Breakdown: It’s important to confirm that the price has actually broken below the 5-minute EMA before taking any action. Sometimes, prices may briefly dip below the EMA before bouncing back up. In these cases, it’s best to wait and see if the price falls further below the EMA before taking action.
- Look for Volume: When the price breaks below the 5-minute EMA, traders should also look at trading volume. If the breakdown is accompanied by high trading volume, it may be a stronger signal that the trend is reversing. This suggests that there are a significant number of traders selling the asset, which may lead to further price declines.
- Consider Multiple Time Frames: While the 5-minute EMA is a useful tool for short-term traders, it’s also important to consider longer-term trends. For example, if the asset is in an overall uptrend, a 5-minute EMA breakdown may only be a temporary dip in price. Traders should look at other time frames, such as hourly or daily charts, to get a better sense of the overall trend.
- Use Other Indicators: Traders should also use other technical indicators in conjunction with the 5-minute EMA to confirm their trading decisions. For example, they may use the relative strength index (RSI) or moving average convergence divergence (MACD) to help confirm a breakdown.
- Set Stop Losses: Finally, traders should always set stop-loss orders to protect themselves against significant losses. A stop-loss order is an instruction to sell an asset if it reaches a certain price point. Traders may set their stop loss just below the 5-minute EMA to limit their potential losses if the price continues to decline.
The 5-minute EMA breakdown is a popular technical indicator used by traders to identify bearish trends and potential trading opportunities. While it can be an effective tool, it’s important to use it in conjunction with other technical indicators and to consider market volatility, trading volume, and risk management strategies. By doing so, traders can use the 5-minute EMA breakdown strategy to make more informed trading decisions and potentially increase their profits.